
Following futures positions of non-commercials are as of April 13, 2021.
10-year note: Currently net short 2.7k, up 87.2k.
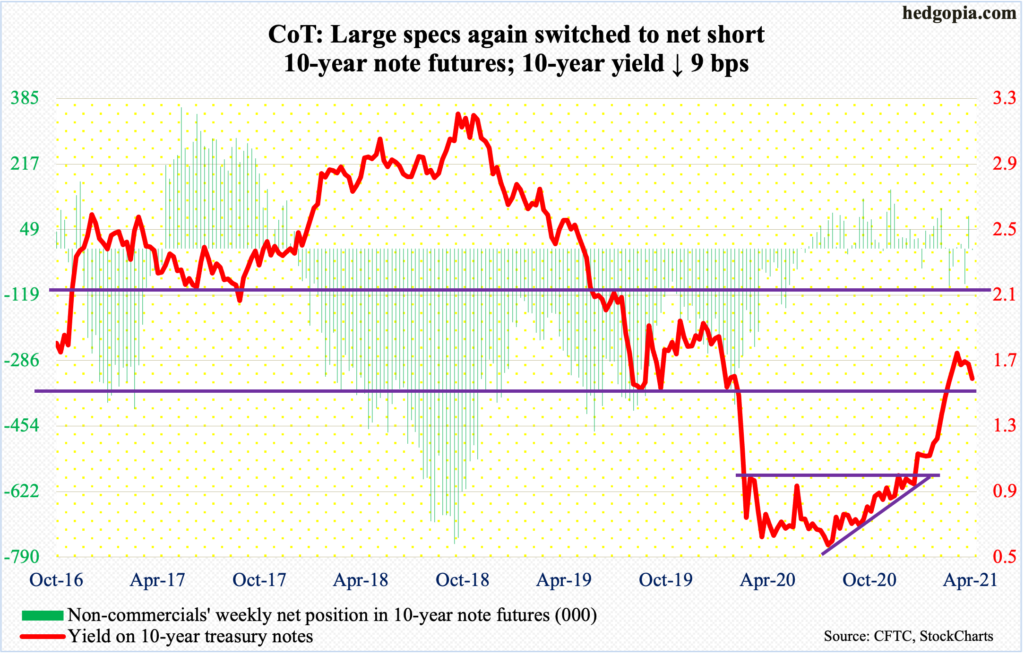
Amid investor concerns that the market may get ahead of the Fed in terms of expectations for rate hikes and/or tapering of the balance sheet, Chair Jerome Powell – and his team – keep hammering on the ‘lower for longer’ message. Thus far, they are winning.
On Thursday, in the wake of March’s much-better-than-expected retail sales (chart here), the 10-year treasury yield collapsed 11 basis points to 1.53 percent. This is a big tell. Time will tell. On Friday, rates rose four basis points to 1.57 percent.
It is beginning to look like the 10-year wants to head lower. It peaked at 1.77 percent on March 30, having earlier bottomed at 0.4 percent in March last year. Thursday’s breakdown pierced through support at 1.63 percent. The daily is getting oversold near term, but the next level to watch in earnest is 1.4 percent. Before that, the 50-day moving average lies at 1.51 percent.
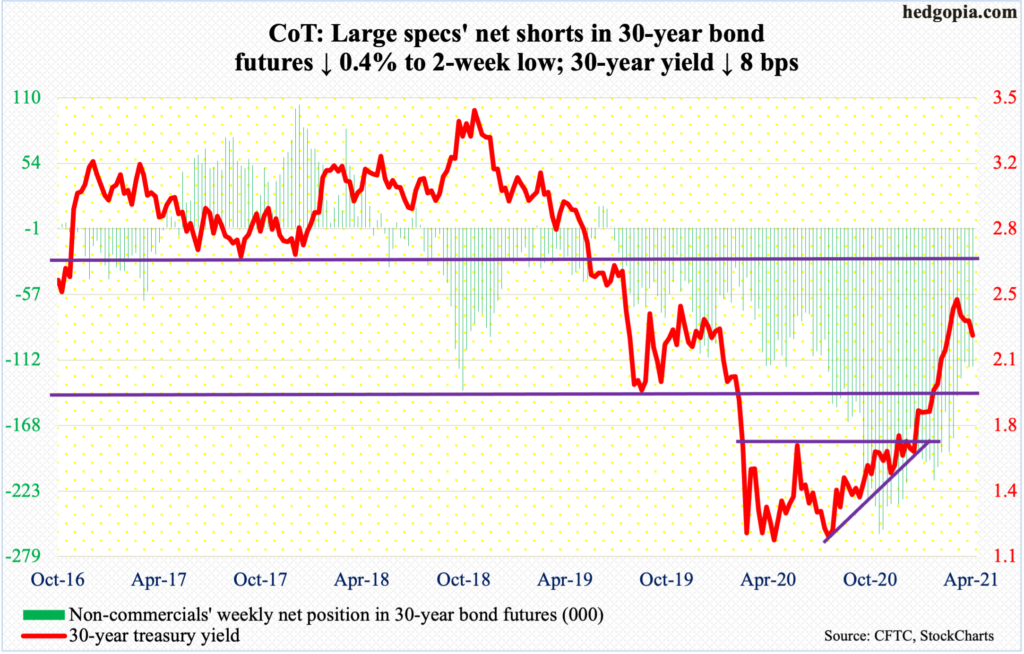
30-year bond: Currently net short 118k, down 485.
Major economic releases for next week are as follows.
Existing home sales (March) are due out on Thursday. In February, sales dropped 6.6 percent month-over-month to a seasonally adjusted annual rate of 6.22 million units. Post-pandemic, sales collapsed to 4.01 million units last May and rose as high as 6.73 million in October.
New home sales (March) come out on Friday. Sales tumbled 18.2 percent m/m in February to 775,000 units (SAAR). Post-pandemic, sales dropped to 570,000 units last April and rose as high as 979,000 in July.
WTI crude oil: Currently net long 533.9k, down 14.7k.
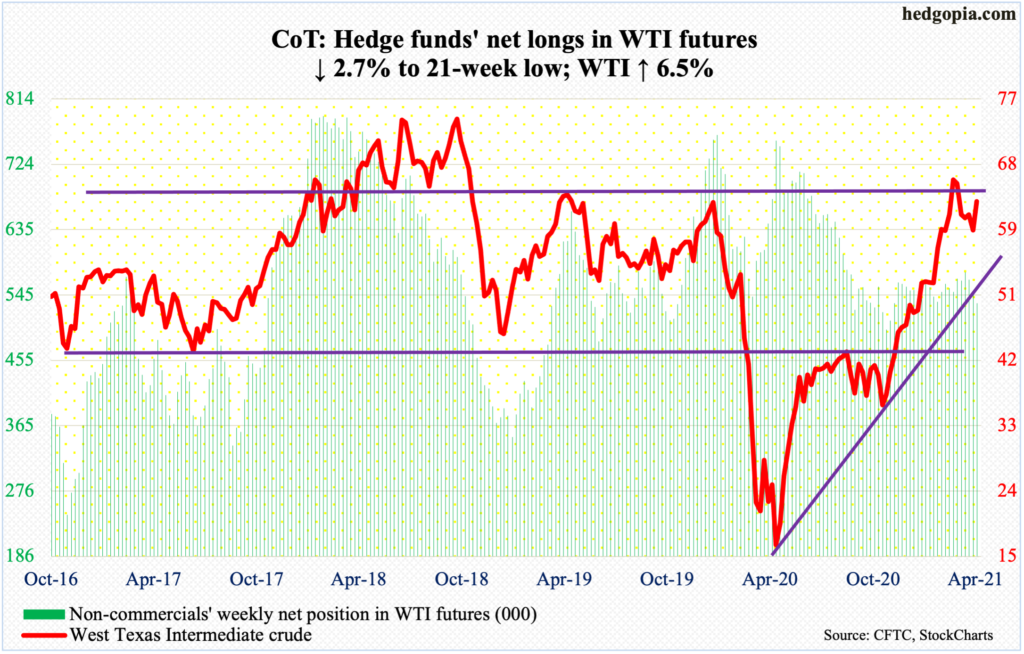
The sideways movement around the 50-day ($61.21) resolved higher on Wednesday. WTI hugged the average for nearly four trading weeks. For the week, it rallied 6.5 percent.
With this, the crude ($63.19/barrel) is now knocking on resistance at $63-$64. A takeout of this level opens the door to testing the March 8th high of $67.98.
In the meantime, US crude production increased 100,000 barrels per day in the week to April 9 to 11 million b/d. As did gasoline stocks, which were up 309,000 barrels to 234.9 million barrels. Stocks of crude and distillates decreased 5.9 million barrels and 2.1 million barrels to 492.4 million barrels and 143.5 million barrels, in that order. Crude imports dropped as well – down 412,000 b/d to 5.9 mb/d. Refinery utilization increased a percentage point to 85 percent.
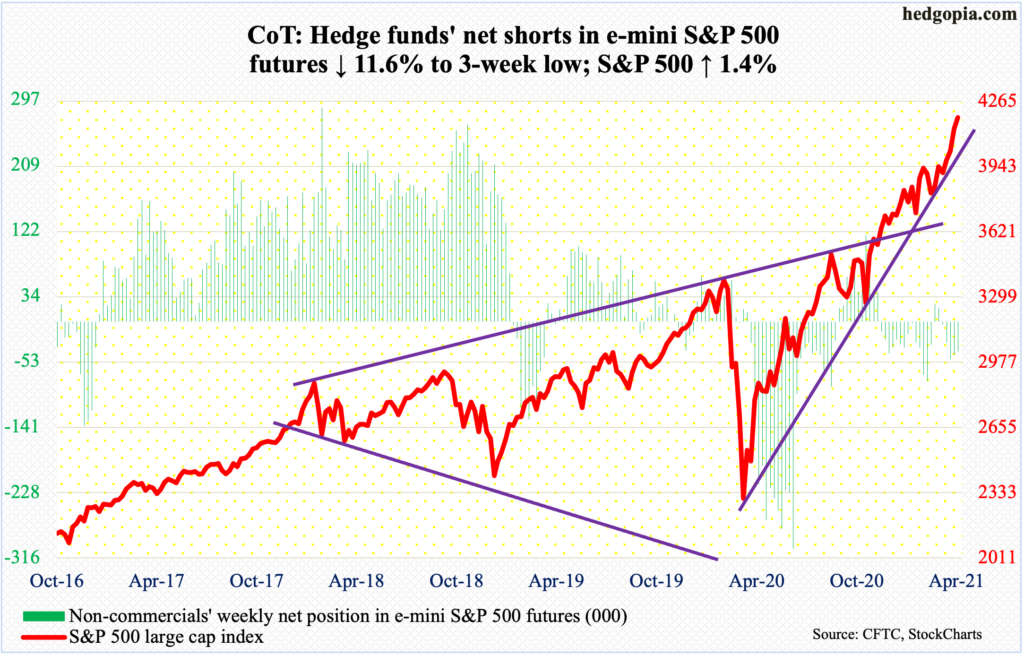
E-mini S&P 500: Currently net short 40.1k, down 5.2k.
Flows into US-based equity funds decelerated to $760 million in the week to Wednesday, although the streak of inflows has now extended to 10 weeks, during which $106 billion came in (courtesy of Lipper). In the same week, SPY (SPDR S&P 500 ETF), VOO (Vanguard S&P 500 ETF) and IVV (iShares Core S&P 500 ETF) took in $1.3 billion; this was the fourth straight weekly inflows, for cumulative gains of $13.9 billion (courtesy of ETF.com).
Inflows have obviously helped. In March, the S&P 500 rallied 4.2 percent. April-to-date, the large cap index is up another 5.4 percent. Apart from the positive flows in recent weeks, foreigners have lent a helping hand for a while now. In February, they purchased $14 billion worth in US equities, for a 12-month total of $376.8 billion – a new record (chart here).
On Thursday, the S&P 500 (4185.47) savored another mini breakout at 4130s. Last week, there was a similar breakout at 4080s, and 3980s before that. Since bulls defended the 50-day on March 25, the index has rallied 8.6 percent.
Stocks in general have rallied big into 1Q21 earnings (more on this here).
Conditions remain way overbought. Sentiment has pushed into elevated – even frothy – territory (chart here). Risk-reward odds are increasingly unfavorable for new longs, unless one is extremely nimble.
Euro: Currently net long 66.9k, down 671.
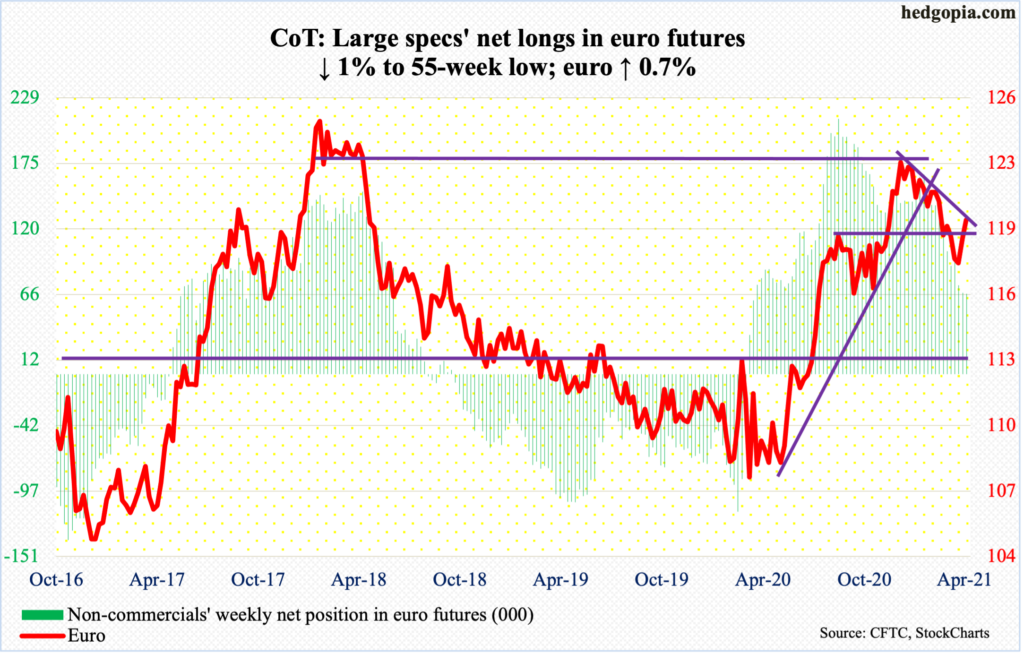
The euro ($1.1983) pushed off of the 200-day this week to go test a confluence of triple resistance – 50-day ($1.1966), horizontal resistance at $1.19-$1.20, which goes back 18 years, and a falling trend line from January 6 when the currency hit $1.2345.
This is an area where both bulls and bears will try to get active. For now, the euro is in no-man’s land, with room to weaken near term.
Gold: Currently net long 180.9k, down 8.6k.
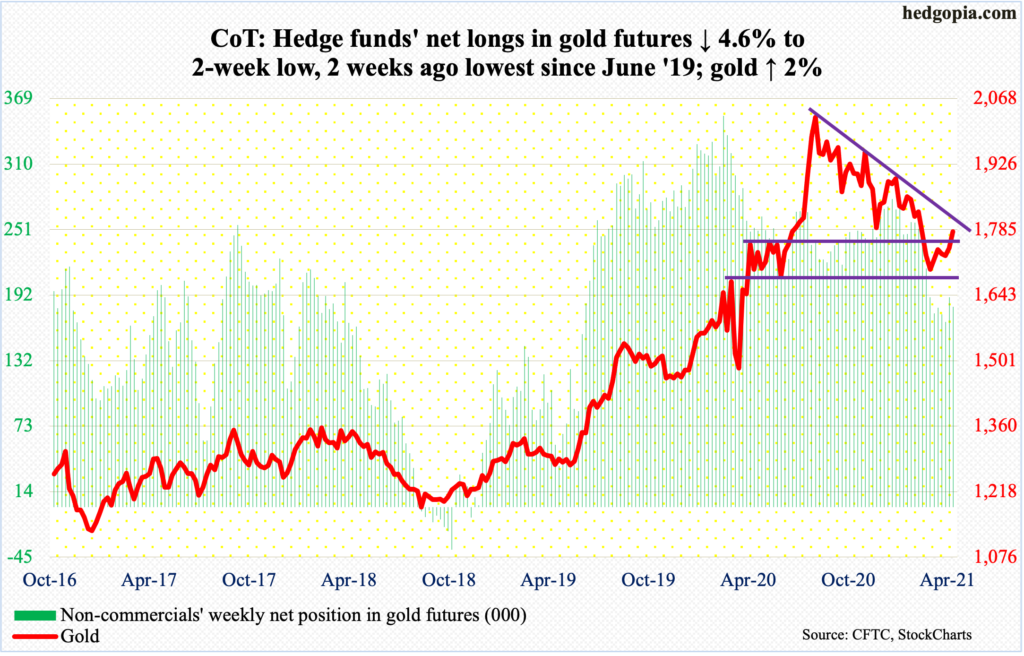
Gold bugs kept hammering on $1,760s-$1,770s, which was lost at the end of February. The metal ($1,780.20/ounce) reached its all-time high of $2,089.20 on August 7 last year, followed by a series of lower highs. The downtrend will be broken just under $1,800.
Until then, it is bears’ ball to lose. From bulls’ perspective, the good thing is that the 50-day ($1,751.59) was recaptured this week. And since bottoming on March 8 at $1,670s, there has been a pattern of higher lows.
Flows are still not cooperating. In the week to Wednesday, GLD (SPDR Gold ETF) lost another $327 million. In the last 26 weeks, 23 have experienced outflows, for a cumulative loss of $14.7 billion (courtesy of ETF.com).
Non-commercials are important at this juncture. They reduced slightly this week and have been cutting back their net longs for a while. Hopefully for gold bugs, sentiment improves after this week’s price action.
Nasdaq 100 index (mini): Currently net short 6.1k, down 3.3k.
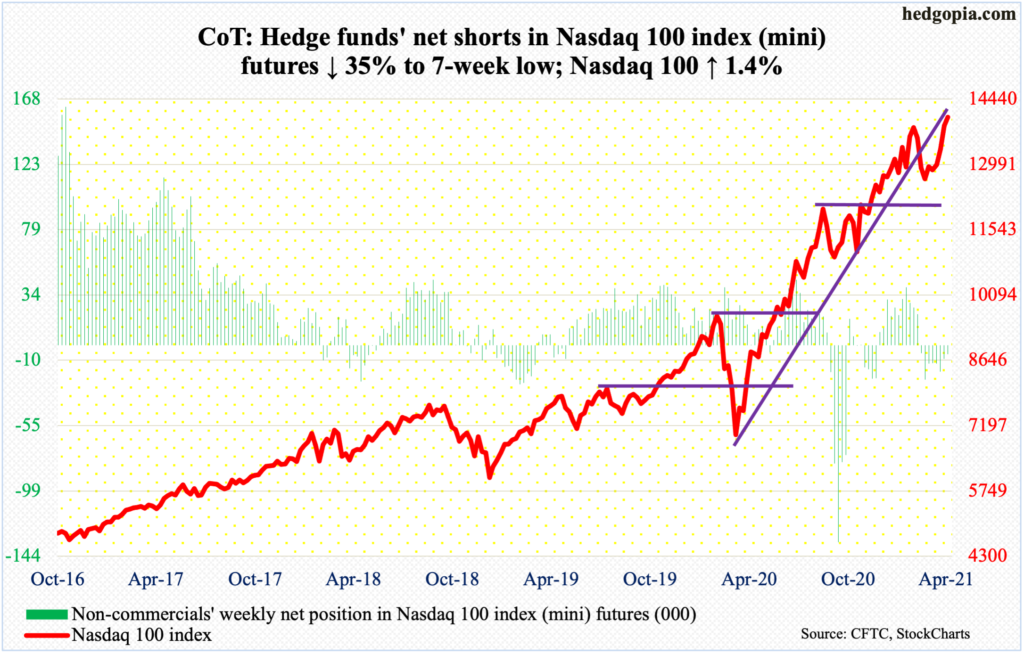
So far so good. After three monthly ominous looking candles – dragonfly doji in March, shooting star in February and long-legged doji in January – April is trying hard to negate all that, with the Nasdaq 100 up 7.3 percent.
There is one more week before the bigwigs report their March quarter. Apple (AAPL), Microsoft (MSFT), Amazon (AMZN), Google owner Alphabet (GOOG/L), Tesla (TSLA) and Facebook (FB) all report the week after. Before that, odds favor the Nasdaq 100 (14041.91) continues to creep higher or go sideways.
Russell 2000 mini-index: Currently net short 21.5k, down 2.9k.
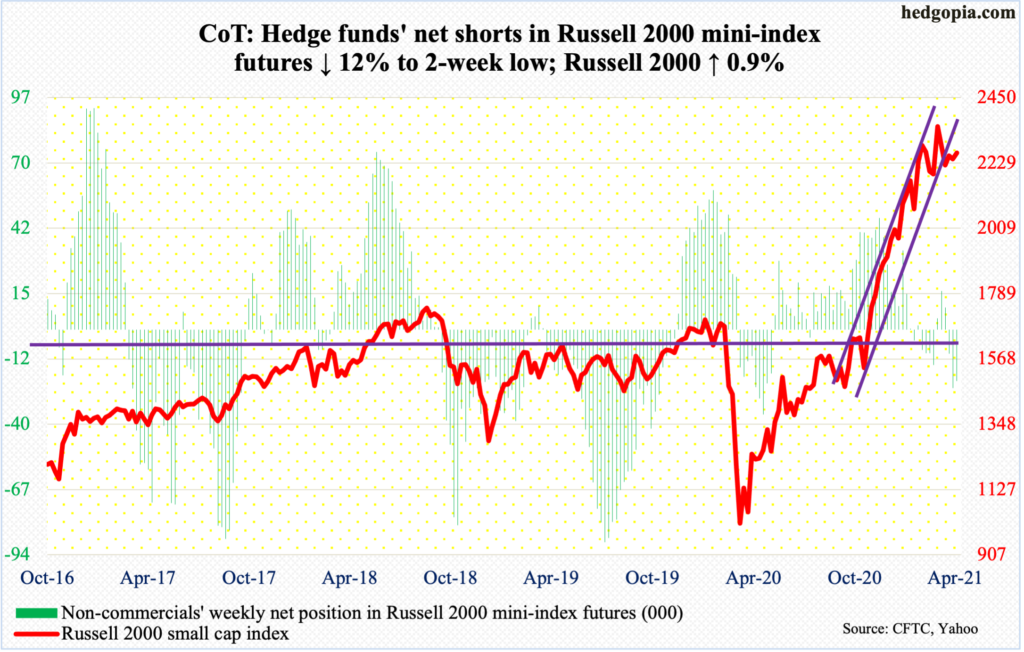
Small-caps are beginning to lag. The S&P 500 continues to post new highs. After lagging for a while, the Nasdaq 100 rallied to a new high this week. The Russell 2000, in contrast, remains well under its March 15 high.
As a matter of fact, the small cap index (2262.67) continues to chart out what looks like the right shoulder of a head-and-shoulders pattern. This is a potentially bearish formation, with the neckline at 2070s-2080s.
As this is occurring, short interest on IWM (iShares Russell 2000 ETF) rose to a nine-month high at the end of March (chart here). This is an opportunity for longs to regroup and squeeze the heck out of these shorts but odds are stacked against them given where things are.
US Dollar Index: Currently net long 6k, up 1.5k.
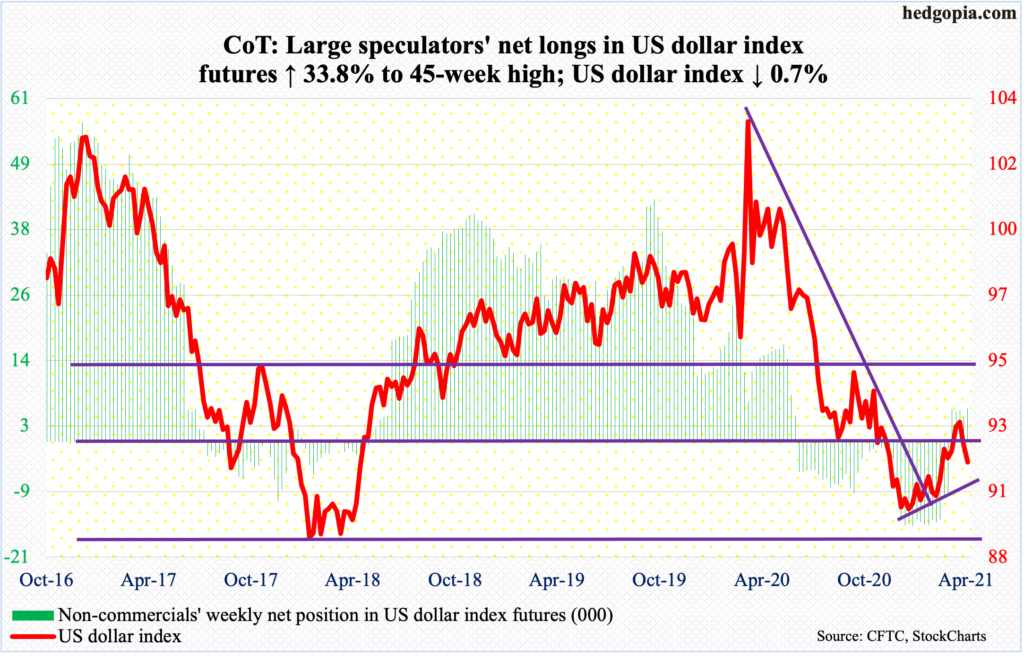
If dollar bulls are to put their foot down, they have an opportunity to do so here. The US dollar index (91.54) retreated after tagging 93.47 on March 31. In the subsequent selloff, the 200-day (92.40) was breached, while the 50-day (91.57) is currently being tested.
That said, bulls this week were unable to defend support just north of 92. Inability to defend the 50-day therefore exposes the index to 90.80s, which is where a rising trend line from January 6 when it bottomed at 89.17 extends to. This was an important low, as support at 88-89 goes back at least 17 years.
VIX: Currently net short 102.6k, up 15.1k.
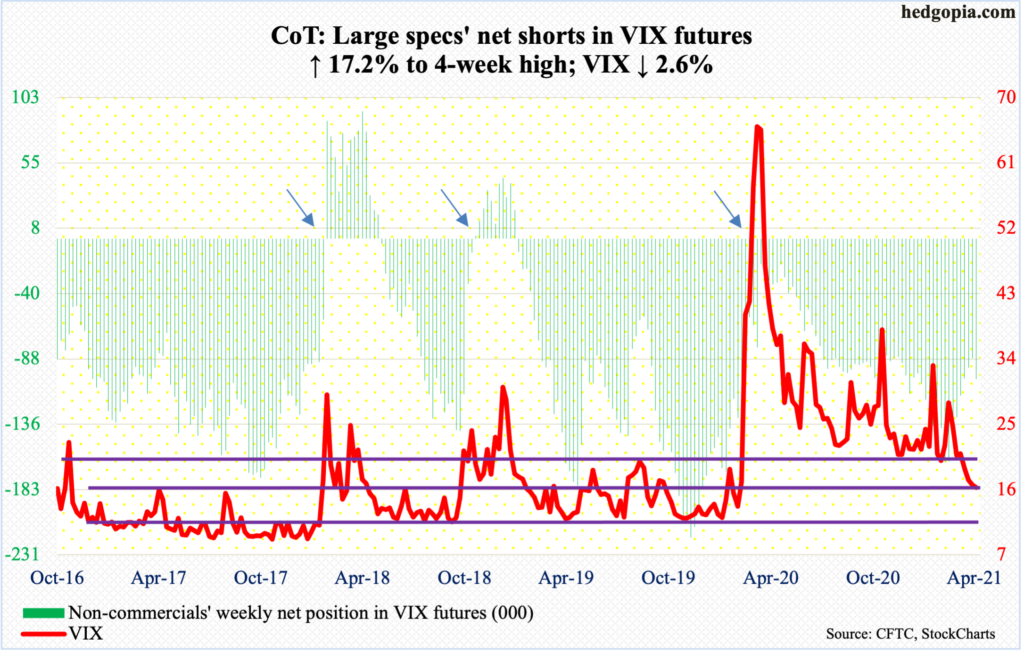
The loss of 20 toward the end of March is proving costly for volatility bulls. On Wednesday – a spinning top session – VIX touched 15.38 intraday. This was the lowest since February 20 last year when the volatility index was just getting ready to explode. VIX (16.25) ultimately peaked at 85.47 on March 18.
From that high, VIX progressively made lower highs. Throughout the downturn – or since last August in particular – 20, or low-20s, held, only to crack two weeks ago.
Before last year’s explosive rally, VIX routinely found support at low double digits. Volatility bears – or equity bulls – would love this to happen. As things stand, momentum lies with them. The thing that could potentially end up helping volatility bulls is VIX’s oversold condition – daily, in particular – and that the index is near its daily lower Bollinger band.
Thanks for reading!
