
Following futures positions of non-commercials are as of April 27, 2021.
10-year note: Currently net long 55.8k, up 40.2k.
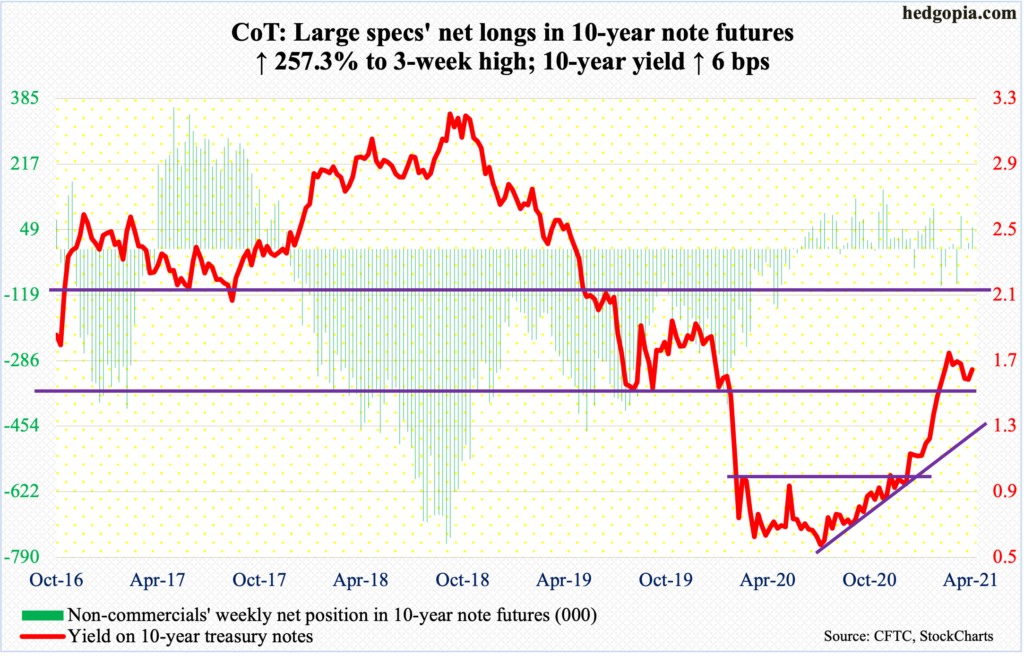
As expected, nothing much of substance came out of the FOMC meeting this week. The fed funds rate was left untouched at a range of zero to 25 basis points. As was monthly purchases of at least $80 billion of treasury notes and bonds and $40 billion of mortgage-backed securities.
The post-meeting statement did talk about the ongoing strength in the economy, but at the same time felt the need to remain easy, saying risks to the economic outlook remain. “It is not yet time to have a conversation about tapering,” Chair Jerome Powell said in the post-meeting press conference.
In the meantime, the first print showed real GDP expanded at an annual rate of 6.4 percent in the first quarter.
It is apparent the Fed wants to remain easy and is looking for reasons to do so. In the March meeting, a majority of FOMC members foresaw a hike in 2024. That is three years from now. The long end of the yield curve is beginning to hint a rate hike cycle will begin before that, but the short end is yet to make a move. Two-year treasury notes are currently yielding 15 to 16 basis points.
In Wednesday’s press meeting, Powell said it was unlikely that inflation expectations would rise before the labor market saw substantial improvement. The short end of the yield curve is on board with this thesis – so far. The question is how long before it will have a diverging opinion?
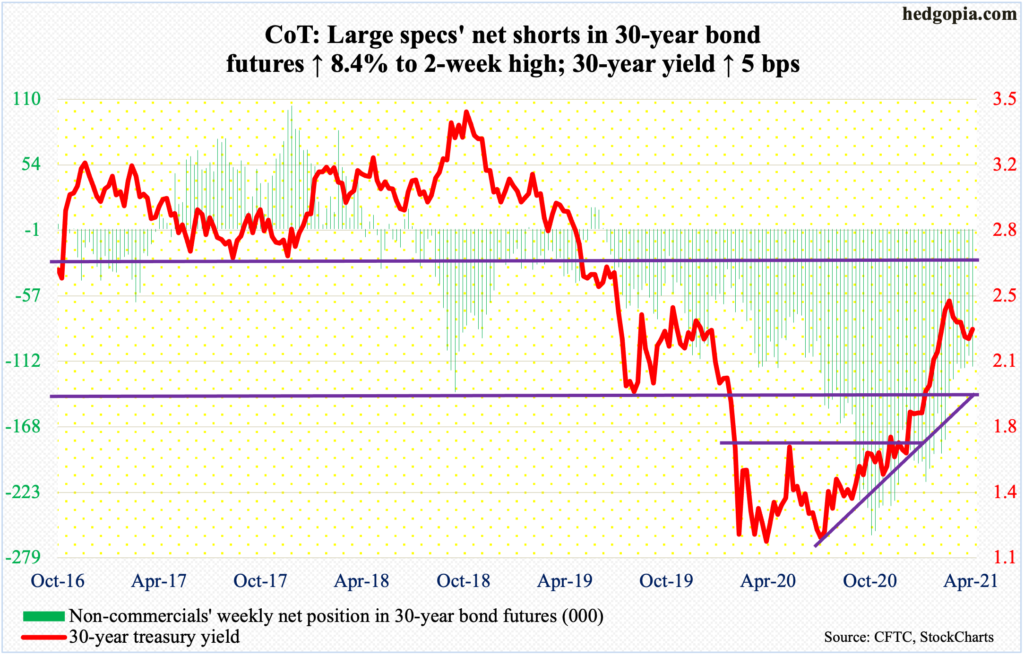
30-year bond: Currently net short 116.6k, up 9k.
Major economic releases for next week are as follows.
The ISM manufacturing index (April) is scheduled for Monday. Manufacturing activity in March increased 3.9 points month-over-month to 64.7.
Durable goods (March, final) will be reported on Tuesday. Preliminarily, orders for non-defense capital goods ex-aircraft – proxy for business capex plans – surged 11.6 percent year-over-year to a seasonally adjusted annual rate of $73.2 billion, which was a record.
The ISM services index (April) is due out on Wednesday. Services activity in March shot up 8.4 points m/m to 63.7.
Labor productivity (1Q21) is on tap for Thursday. Non-farm output/hour decelerated to growth of 2.4 percent y/y in 4Q20 from 3.9 percent in 3Q. In 1Q20, y/y growth languished at 0.8 percent.
Friday brings the employment report (April). In March, non-farm payroll jumped 916,000 m/m to 144.1 million. The post-pandemic low of 130.2 million was recorded in April last year. From the all-time high of 152.5 million in February 2020, jobs are still 8.4 million short.
WTI crude oil: Currently net long 541k, up 2.8k.
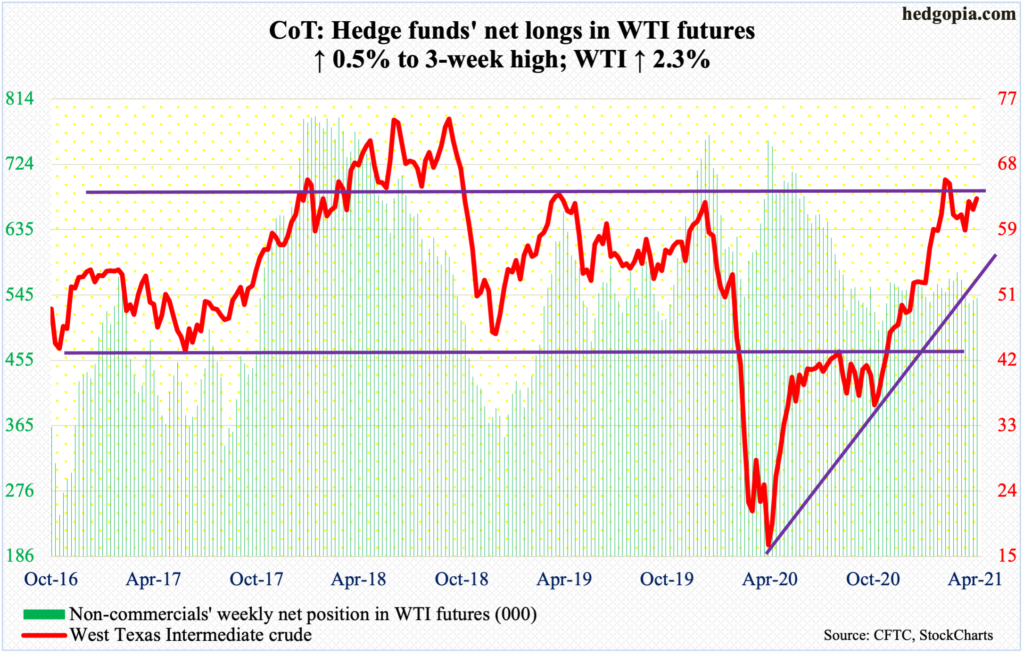
Monday’s intraday drop below the 50-day moving average was bought, with a session low of $60.66. By Thursday, WTI ($63.58/barrel) ticked $65.47 – just past the daily upper Bollinger band. This helped take out the prior high of $64.38 from April 30, but this also pushed the crude into overbought territory.
The 50-day lies at $62.03. Before rallying in mid-April, WTI hugged the average for nearly a month, during which bids showed up at $58 several times.
Beginning May through July, OPEC+ is easing oil output cuts. Global recovery is taking hold, and this has encouraged the producers to roll back some of the production cut that was initiated last year. At the April 1 meeting, the group said it planned to bring 2.1 million barrels per day back to the market. Earlier, it cut output by around eight mb/d.
In the US, crude production in the week to April 23 dropped 100,000 b/d to 10.9 mb/d. Distillate stocks fell as well, down 3.3 million barrels to 139 million barrels. Refinery utilization increased four-tenths of a percentage point to 85.4 percent. Stocks of crude and gasoline, on the other hand, rose 90,000 barrels and 92,000 barrels to 493.1 million barrels and 235.1 million barrels respectively. Crude imports increased as well – up 1.2 mb/d to 6.6 mb/d.
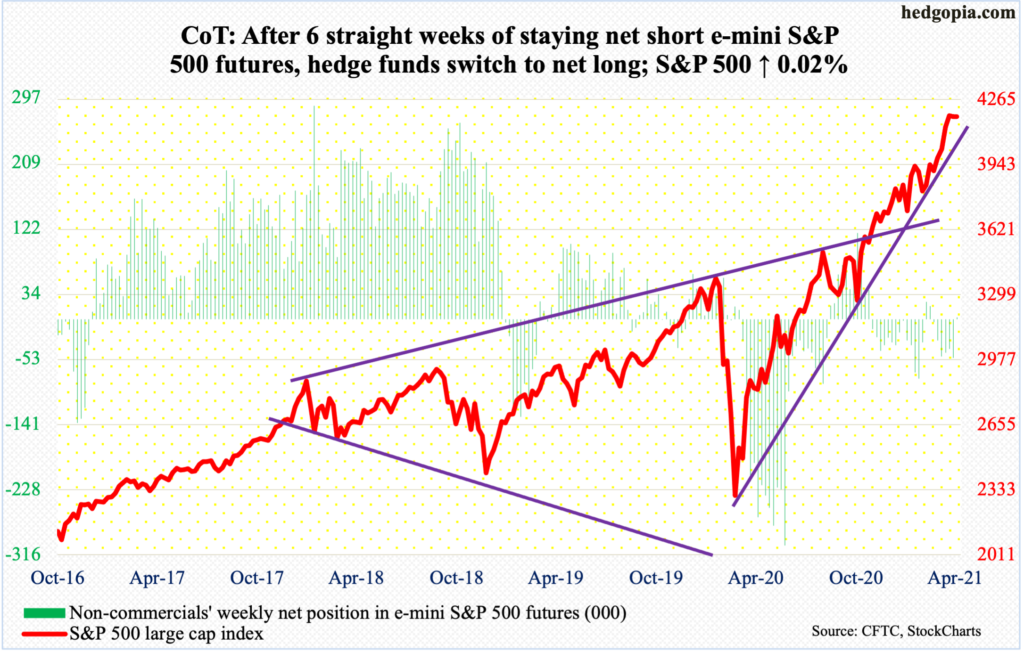
E-mini S&P 500: Currently net long 2.3k, up 54.4k.
The streak of positive flows into US-based equity funds stopped at 11 weeks during which $107.6 billion was gained; in the week to Wednesday, $3.1 billion was withdrawn (courtesy of Lipper). In the same week, SPY (SPDR S&P 500 ETF), VOO (Vanguard S&P 500 ETF) and IVV (iShares Core S&P 500 ETF) lost $3.7 billion; before this, these ETFs took in $18.4 billion over five weeks (courtesy of ETF.com).
To be fair, this was before the S&P 500 (4181.17) rallied 0.7 percent on Thursday on the back of earnings results from Apple (AAPL) and Facebook (FB). Bulls’ mettle was nevertheless tested in that session. In the very first minutes, the large cap index gapped up 0.9 percent to score a new intraday high of 4218.78, before sellers showed up; by noon, it was down 0.2 percent, but bids showed up at the 10-day, with the session ending with a daily hanging man. Sellers are beginning to come out of the woodwork.
From up 0.9 percent at Thursday’s high, the S&P 500 ended the week flat. A weekly gravestone doji appeared, having come after last week’s dragonfly doji. This took place even as non-commercials covered all their shorts and are now slightly net long.
The path of least resistance is down in the sessions ahead. There is support at 4080s, and 3980s after that. By that time, the index will have lost a rising trend line from March last year.
Euro: Currently net long 81k, up 159.
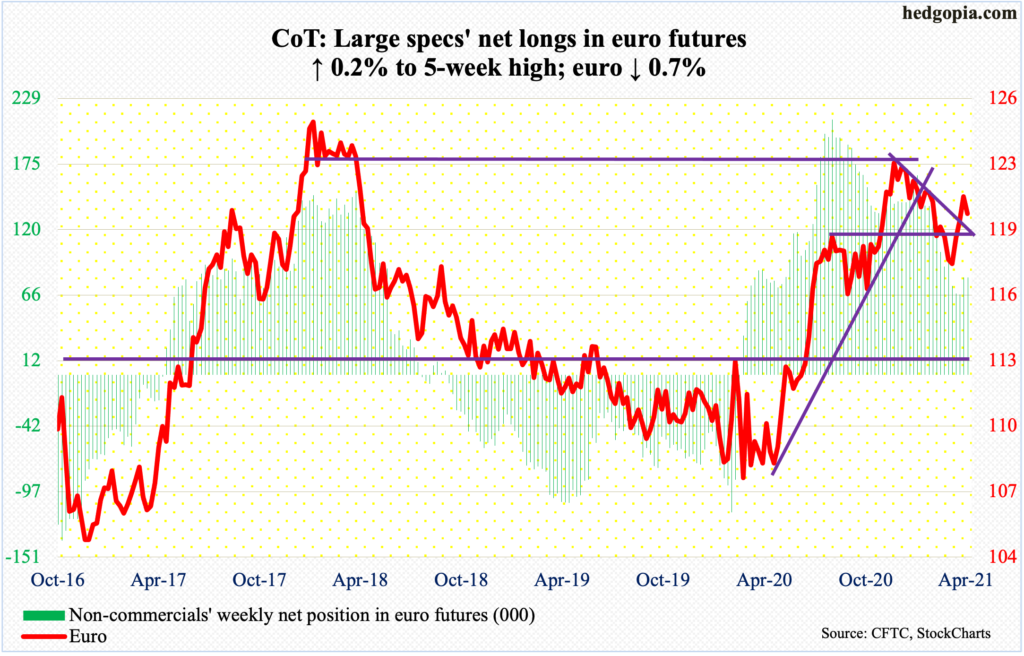
Thursday’s high of $1.2137 came close to testing horizontal resistance at $1.2170s. Friday’s low of $1.2003 successfully tested $1.19-$1.20, which was recaptured two weeks ago. This level goes back 18 years.
On the daily, the euro ($1.2019) remains overbought, unwinding of which is likely in the sessions ahead, raising breach risks of $1.19-$1.20.
Gold: Currently net long 170.6k, down 10.9k.
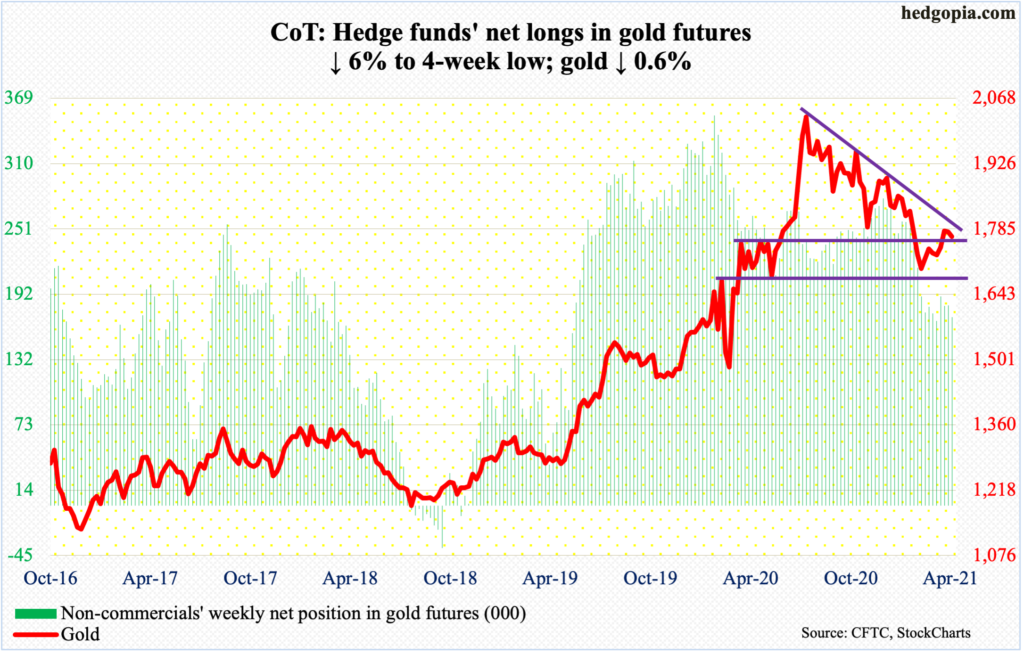
For seven consecutive sessions through Wednesday, GLD (SPDR Gold ETF) saw no activity whatsoever. This comes after cumulative loss of $14.7 billion over 24 of 27 weeks (courtesy of ETF.com). This is encouraging in that it is possible sellers may have exhausted themselves, but gold bugs need inflows at this juncture.
Gold ($1,767.70/ounce) continues to be held down by a falling trend line from August 7 last year when it reached its all-time high of $2,089.20. On Thursday, the metal rose as high as $1,789.90 intraday but only to reverse lower and end the session down 0.3 percent to $1,768.30.
Toward the end of February, horizontal support at $1,760s-$1,770s gave way. The level was retaken mid-April and is once again in play. For the metal to regain momentum, not only does it need to save this support but will also need to reclaim the trend line mentioned earlier.
Nasdaq 100 index (mini): Currently net short 7.8k, up 2.6k.
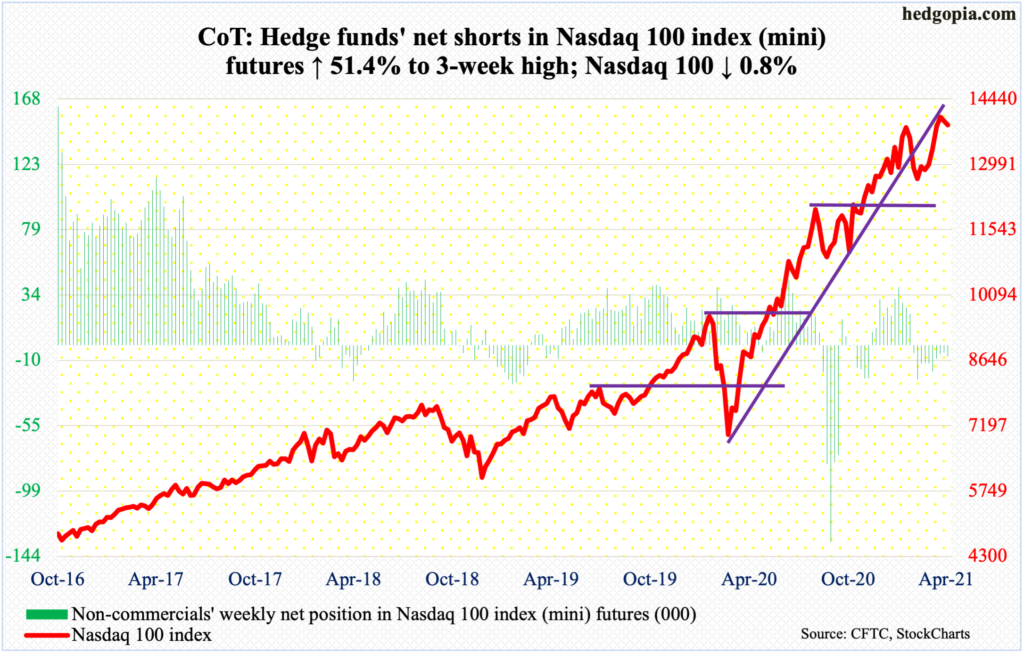
Tech bulls had to be disappointed with how Thursday traded. After AAPL and FB reported much-better-than-expected March-quarter results on Wednesday, the Nasdaq 100 gapped up 1.2 percent to a new intraday high of 14073.48. In the very first few minutes, sellers took control. By noon, the index was down 0.5 percent to test its 20-day, which held; the session ended up 0.5 percent – above both its 10- and 20-day. Come Friday, it shed 0.8 percent to close right on the 20-day, with rising risks of a potentially bearish cross-down between the averages.
This was a week in which the top six US companies – AAPL, Microsoft (MSFT), Amazon (AMZN), Google owner Alphabet (GOOG/L), Tesla (TSLA) and FB reported. Results exceeded estimates, with some of them hitting it out of the park (more on this here). But the Nasdaq 100 (13860.76) did not get much help.
Bulls should like the fact that April ended up 5.9 percent. But this probably was not enough to negate the prior three monthly ominous looking candles – a dragonfly doji in March, a shooting star in February and a long-legged doji in January.
Russell 2000 mini-index: Currently net short 20.2k, down 5k.
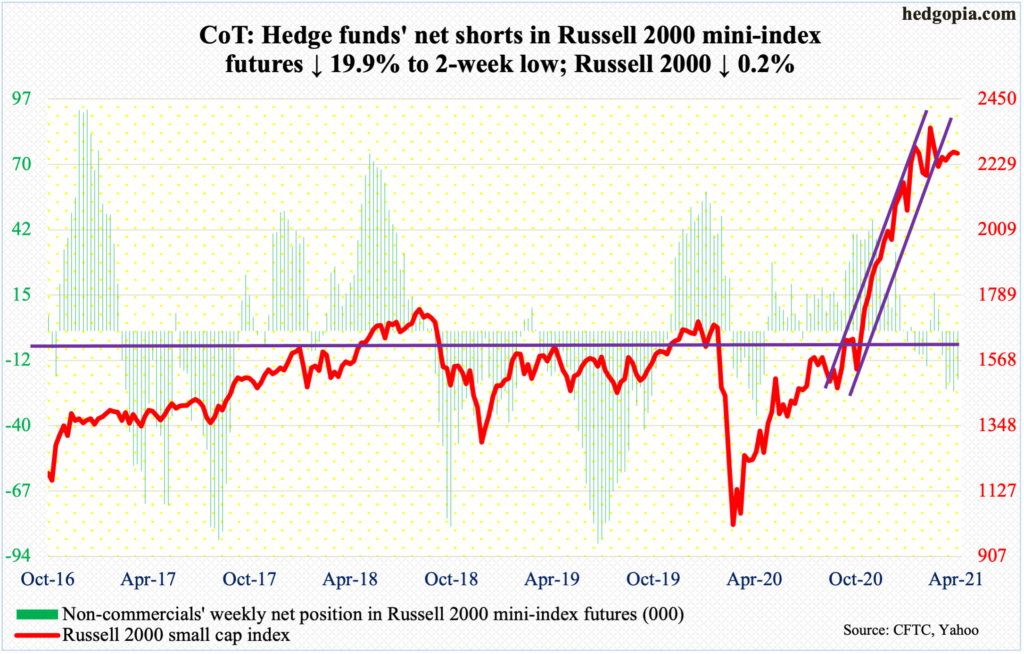
Up 2.2 percent at Thursday’s high, the Russell 2000 ended down 0.2 percent this week, continuing to work on what could turn out to be the right shoulder of a potential head-and-shoulders formation. It is a potentially bearish pattern and will complete once the small cap index (2266.45) breaks the neckline at 2070s-2080s.
The index remains under its March 15 high of 2360.17. Through that high, it rallied 144 percent from the low of March last year. The temptation to lock in profit can rise. It also lost an ascending channel from last October-November. For now, 2070s-2080s is a make-or-break.
US Dollar Index: Currently net long 2.7k, down 772.
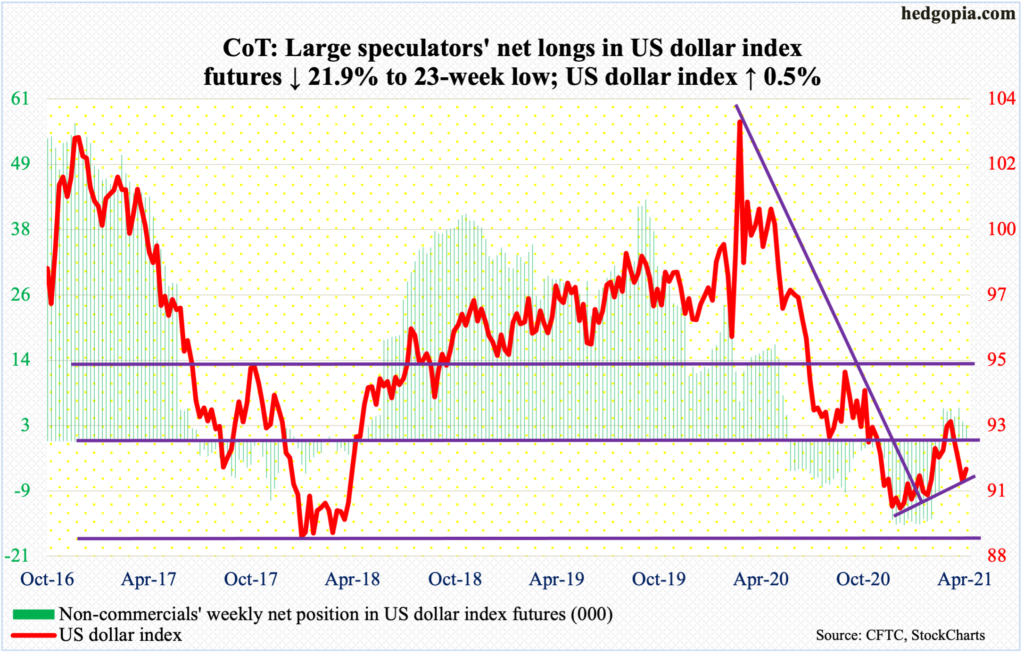
Dollar bulls defended a rising trend line from January 6 when the US dollar index (91.27) bottomed at 89.17. This was an important low, as support at 88-89 goes back at least 17 years. After that multi-year low, it rallied all the way to 93.47, which was ticked on March 31. In the selloff that followed, support just north of 92 was breached. This likely gets tested in the sessions ahead. The 200-day lies right there at 92.12.
VIX: Currently net short 94k, down 8.5k.
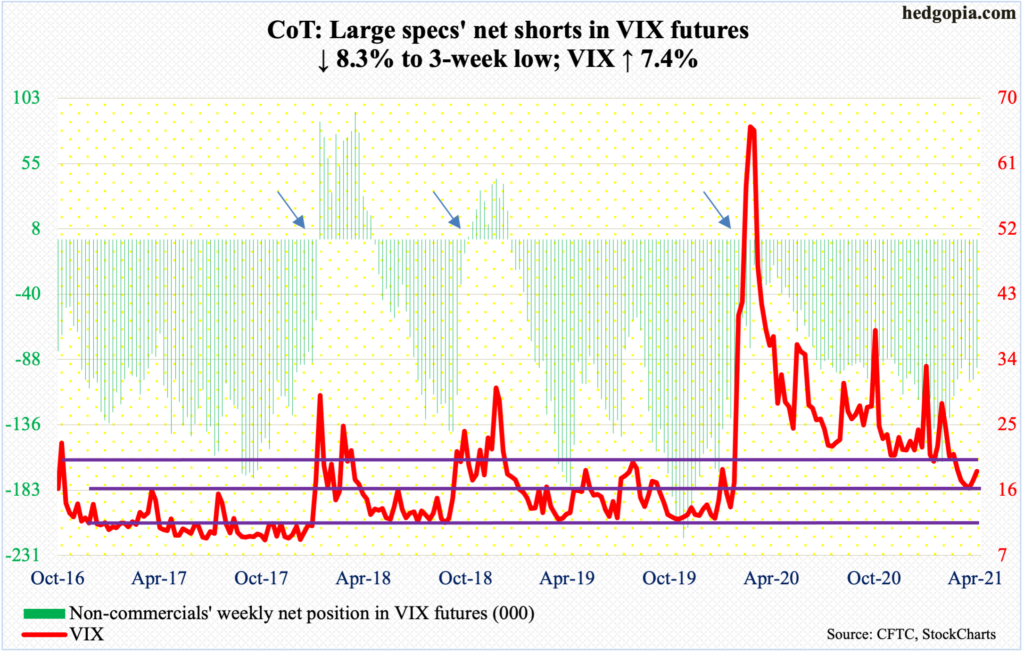
VIX completed a potentially bullish 10- and 20-day crossover on Thursday. Simultaneously, the daily Bollinger bands have narrowed, with Friday at 2.76 points. This is a precursor to a sharp move – either up or down.
On April 14, VIX (18.61) ticked 15.38 before rallying. It remains oversold on several timeframes. If a sharp move is on the horizon, odds favor it will be to the upside.
Immediately ahead, there is resistance at 19, or just under that. The volatility index tagged 18.87 on Thursday and 19.25 on Friday before pulling back. After this, the next roadblock is 20, or low-20s, and mid-20s after that. The 50- and 200-day at 20.30 and 23.92 respectively approximate these levels.
Thanks for reading!
