
Following futures positions of non-commercials are as of May 18, 2021.
10-year note: Currently net long 31.7k, up 30.4k.
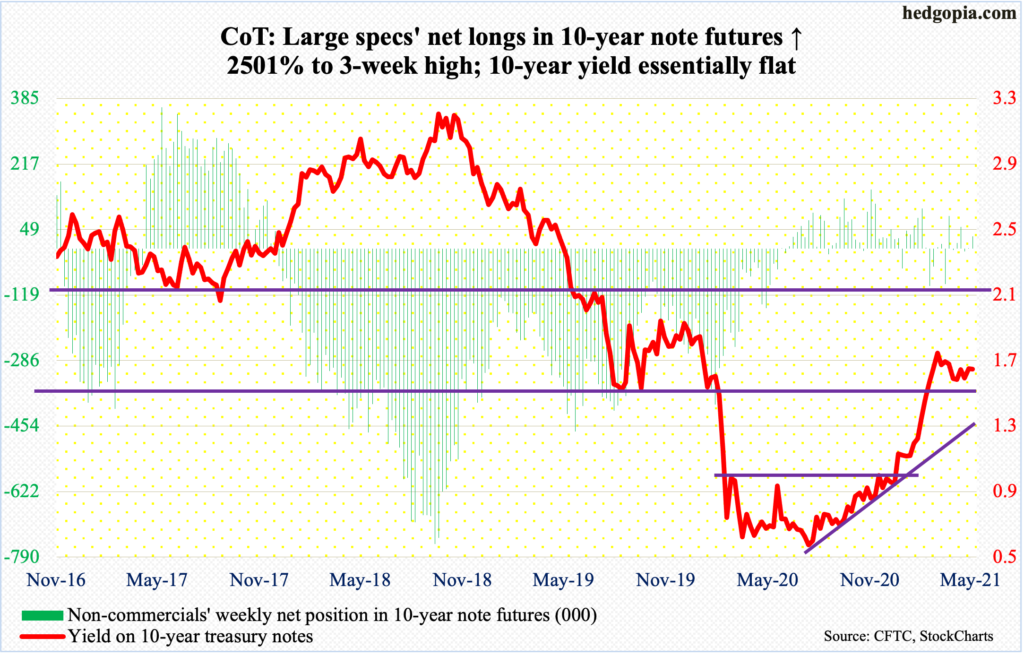
Apparently, some FOMC members at the April 27-28 meeting signaled that they were ready to discuss scaling back the Fed’s bond purchases “at some point.” This was somewhat of a surprise. The post-meeting statement did not mention this, nor did Chair Jerome Powell during a press conference immediately after the meeting.
The central bank currently buys up to $80 billion in treasury notes and bonds and $40 billion in mortgage-backed securities every month. It holds $7.9 trillion in assets, up from $4.2 trillion in early March last year. Tapering – or talk of tapering – has the potential to reverberate through all kinds of assets, including both equities and bonds.
The April meeting took place after a blockbuster March jobs report, showing the economy produced 770,000 non-farm jobs. The momentum was expected to continue in April, but the actual 266,000 jobs was much weaker than expected. This for now should buy more time for policy doves within the FOMC.
Markets will now be keenly watching May’s report. Resumption of strength in job creation is bound to decisively impact rate hike expectations. As things stand, Fed projection is to stay on hold through 2023 – a bias that increasingly becomes indefensible.
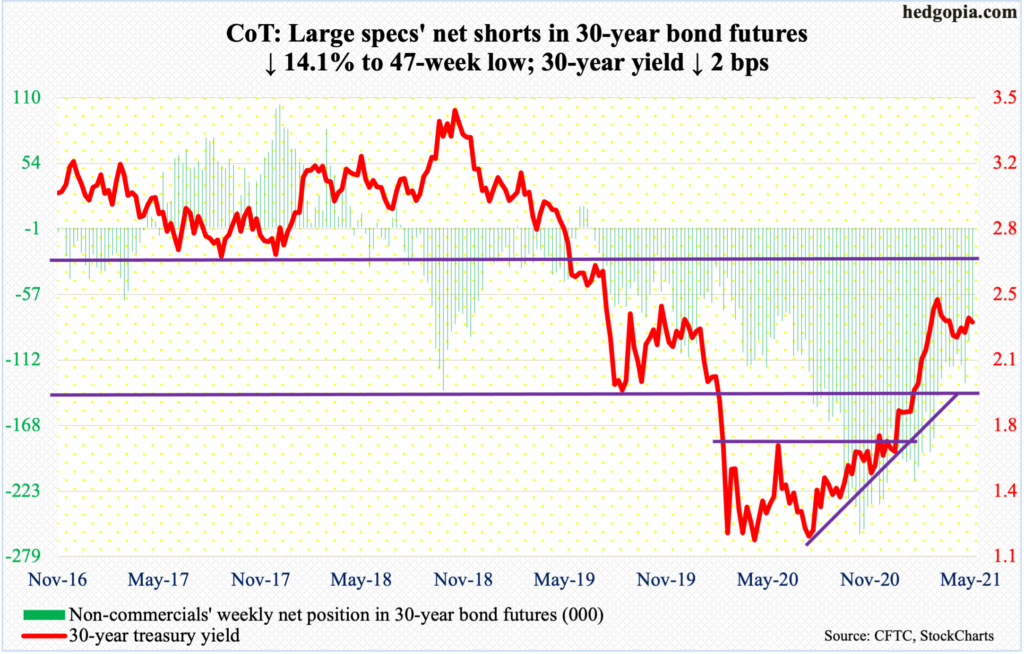
30-year bond: Currently net short 83k, down 13.6k.
Major economic releases for next week are as follows.
Tuesday brings the S&P Case-Shiller Home Price Index (March) and new homes sales (April).
Nationally, US home prices in February shot up 12 percent year-over-year. This was the fastest pace of appreciation in 15 years.
Sales of new homes jumped 20.7 percent month-over-month in March to a seasonally adjusted annual rate of 1.02 million units – the highest since August 2006. Post-pandemic in April last year, sales slumped to 570,000 units.
GDP (1Q21, 2nd estimate), corporate profits (1Q21) and durable goods orders (April) are due out on Thursday.
The first estimate showed real GDP expanded at an annual rate of 6.4 percent last quarter, coming on the heels of 4.3 percent increase in 4Q20 and 33.4 percent jump in 3Q. Before that, the economy contracted 31.4 percent in 2Q and five percent in 1Q.
In 4Q20, corporate profits with inventory valuation and capital consumption adjustments fell 1.4 percent sequentially to $2.29 trillion. The prior quarter’s $2.33 trillion was a record.
Orders for non-defense capital goods ex-aircraft – proxy for business capex plans – jumped 11.6 percent y/y in March to $73.2 billion – a record. This was the steepest y/y growth rate in nine years.
Personal income/spending (April) and consumer sentiment (May, final) will be published on Friday.
In the 12 months to March, core PCE, which is the Fed’s favorite measure of consumer inflation, rose 1.83 percent. This was the fastest pace of inflation in 13 months.
May’s preliminary reading showed consumer sentiment dropped 5.5 points m/m to 82.8 – a two-month low.
WTI crude oil: Currently net long 514.2k, down 23.6k.
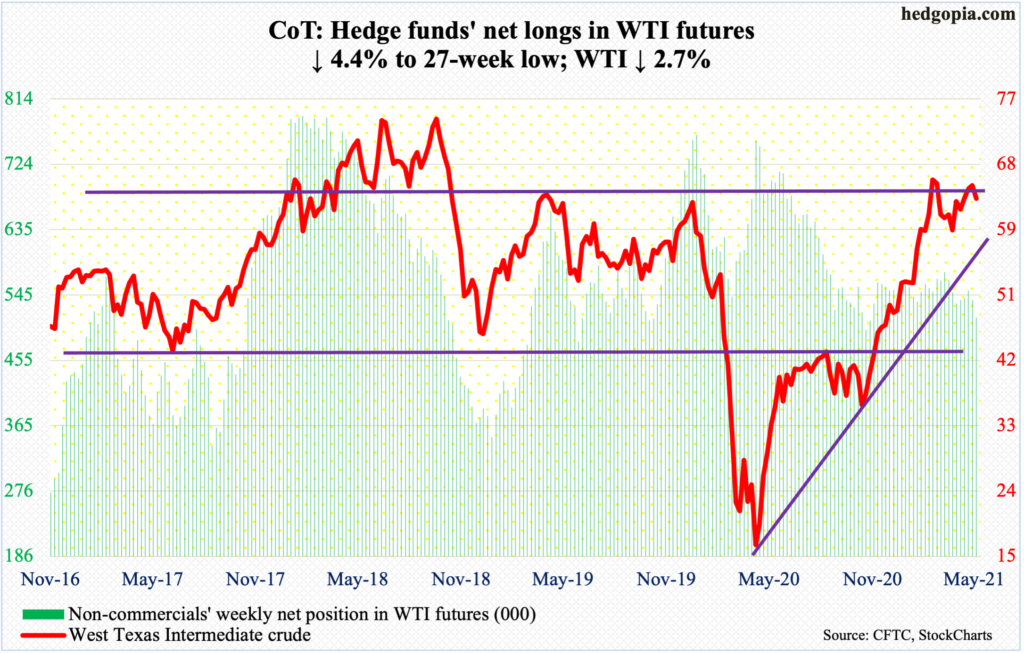
One more week and one more failed attempt at $66-$67. On Tuesday, WTI ($63.58/barrel) ticked $67.02 before retreating. This level has attracted sellers for over two weeks now. Tuesday’s high also kissed the daily upper Bollinger band; by Thursday, the lower band was touched, past the 50-day at $62.62. The average was reclaimed on Friday.
Resistance at $66-$67 currently also lines up with a falling trend line from July 2008 when the crude retreated after rallying to a new all-time high of $147.27. Failure here can be construed as a strong message for growth and inflation outlook.
A trend line from the low of April last year gets tested at $60, a loss of which opens the door to a test of horizontal support at $58.
In the week to May 14, US crude production was unchanged at 11 million barrels per day. Crude imports rose 923,000 b/d to 6.4 mb/d. As did crude stocks, which were up 1.3 million barrels to 486 million barrels. Gasoline and distillate stocks, however, dropped – down two million barrels and 2.3 million barrels respectively to 234.2 million barrels and 132.1 million barrels. Refinery utilization increased two-tenths of a percentage point to 86.3 percent.
E-mini S&P 500: Currently net short 23.2k, down 13.6k.
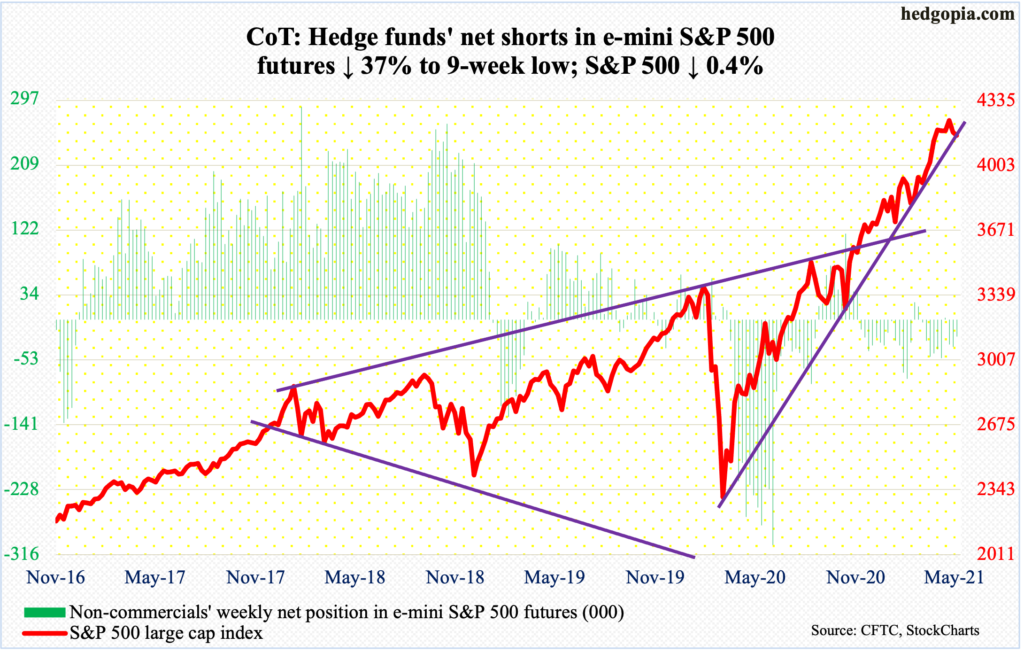
For the second week running, bears first struck a blow but bulls soon regained their footing. At Wednesday’s low, the S&P 500 was down 2.7 percent for the week, but bids appeared just under the 50-day (4091) to close out the week 0.4 percent lower. By the end of the week, a weekly hanging man was formed. Last week evolved similarly – down 1.4 percent but was down as much as 4.2 percent at the lows, for a weekly hanging man.
On both occasions, a rising trend line from the low of March last year was tested. Last week, it was convincingly breached intra-week but saved by close, ending the week right on it. This week, bulls were unable to repeat the feat, although the breach is not by a whole lot.
The other thing is, both this week and last, the 50-day was defended. The average is still rising and could begin to flatten out if this bull-bear back-and-forth continues. Bulls at this juncture would not want to see non-cooperation from fund flows.
In the week to Wednesday, US-based equity funds lost $3.5 billion (courtesy of Lipper). This was the second weekly outflows in the last four; otherwise, the last time flows were negative was in the week to February 3. Also in the week to Wednesday, a combined $4.4 billion left SPY (SPDR S&P 500 ETF), VOO (Vanguard S&P 500 ETF) and IVV (iShares Core S&P 500 ETF), versus a loss of $50 million in the prior week (courtesy of ETF.com).
On the weekly, this week’s was a third hanging man in a row, and this was preceded by a gravestone doji and a dragonfly doji. These are potentially bearish candles and need confirmation. For now, 4060s has taken on significance, with the large cap index at 4155.86 comfortably above this level.
Euro: Currently net long 99.9k, up 6k.

Euro bulls further built on the break two weeks ago out of a falling trend line from January 6 when it ticked $1.2345. On Wednesday, the currency ($1.2182) touched $1.2239, just about matching the February 25 high of $1.2243.
Momentum lies with the bulls. The January 6 high has taken on significance. A break opens the door toward $1.25.
That said, this week’s candle with a long upper shadow is worth watching. The weekly is beginning to get extended, and a reversal can occur.
Gold: Currently net long 198.9k, up 6.6k.
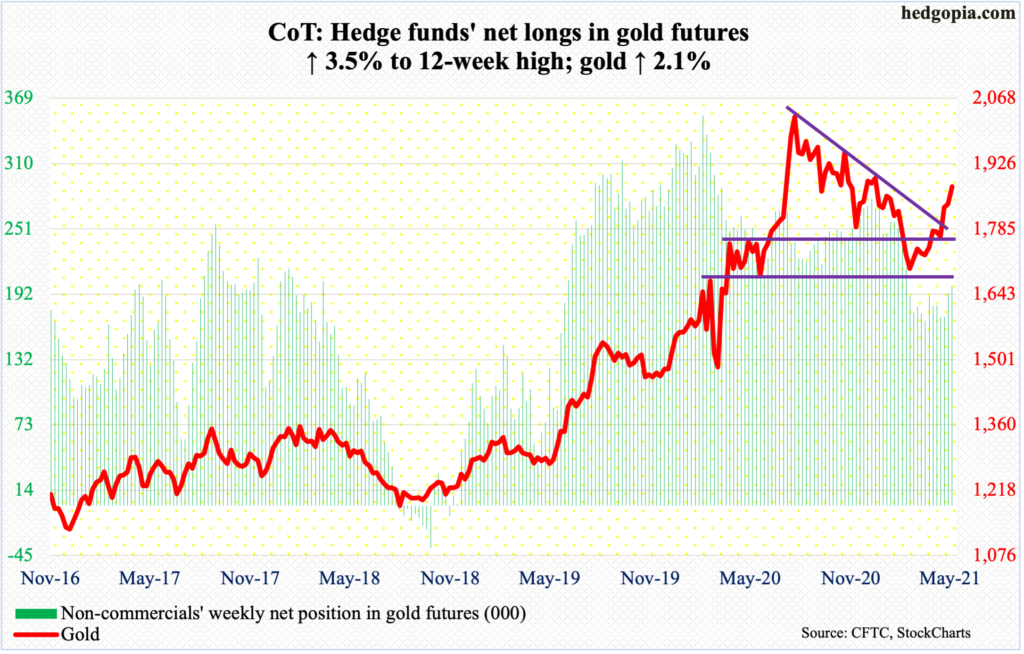
Last week, gold ($1,876.70/ounce) broke out of $1,840s. This week, it took care of the 200-day ($1,851), rising as high as $1,891.30 on Wednesday.
In the week to Wednesday, for the second consecutive week in the last 17, GLD (SPDR Gold ETF) saw positive flows, gaining $355 million, having attracted $340 million before that (courtesy of ETF.com). In the prior 15, $8.7 billion was withdrawn.
As things stand, gold bugs would love to go test $1,920s. This was the level the metal reached back in September 2011 before coming under pressure to eventually bottom at $1,045 in December 2015. For 10 months now, bulls and bears have repeatedly fought for control of $1,920s, which the former lost last November. Even if they succeed in testing this resistance in the sessions ahead, a breakout may not happen immediately. The daily is way extended, with RSI in low-70s; a pause is likely.
Nasdaq 100 index (mini): Currently net short 6.1k, up 91.
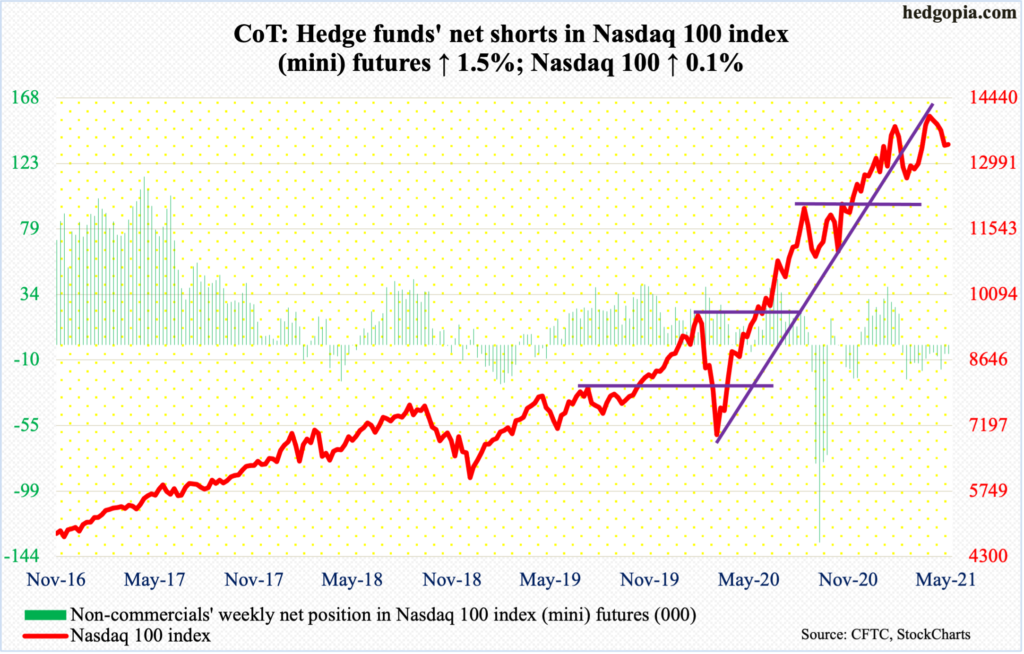
From down three percent at the lows on Wednesday to finish up 0.1 percent, bulls could not be happier with how the week turned out. Last week, too, the Nasdaq 100 was down 5.5 percent at the lows but recovered to only lose 2.4 percent. To boot, last week’s low of 12900s was defended this week, with reclaiming of the 50-day by Thursday.
Tech bulls hope they can build on this week’s encouraging action. There is decent resistance at 13600s. This is near term. Medium term, they might be looking at a worsening picture. The index (13411.74) already breached a rising trend line from the low of March last year, starting January with a monthly long-legged doji, followed by a dragonfly doji in February and a gravestone doji in March. With five sessions to go this month, it is down 3.2 percent.
Russell 2000 mini-index: Currently net short 36.8k, up 9k.
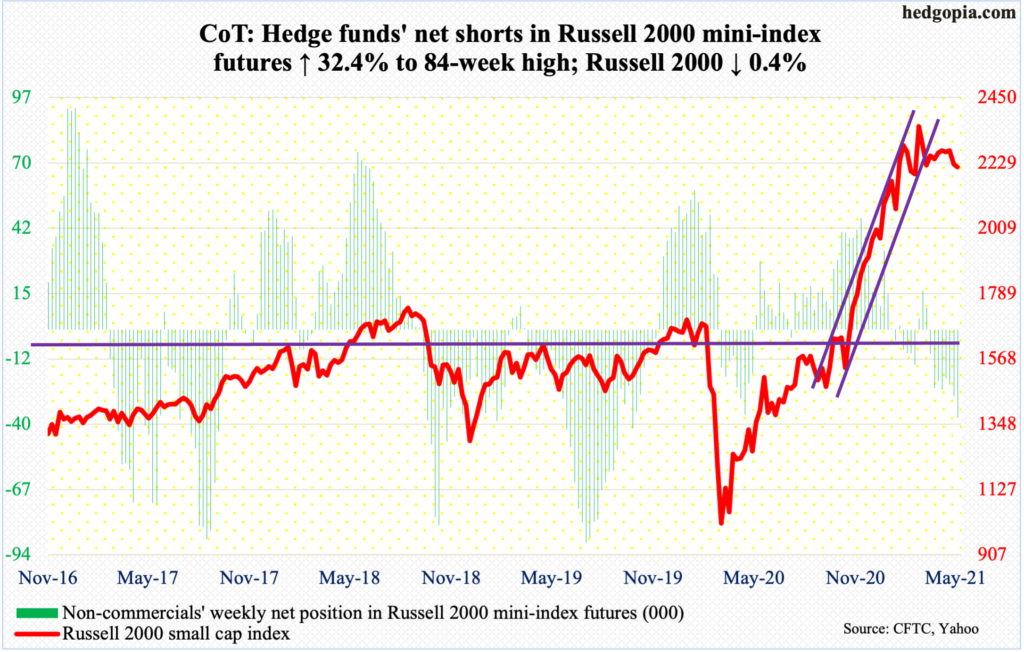
More sideways action on the Russell 2000 between the right shoulder and neckline of a potential head-and-shoulders pattern. At Wednesday’s low, the small cap index was down 2.9 percent but rallied to finish the week down 0.4 percent. Last week saw a similar reversal to the upside – from down 6.1 percent mid-week to down 2.1 percent when it was all said and done.
The index (2215.27) remains trapped between the neckline at 2070s-2080s and straight-line resistance at 2280s, with rising risks of a break to the downside in due course.
US Dollar Index: Currently net long 2.7k, up 261.
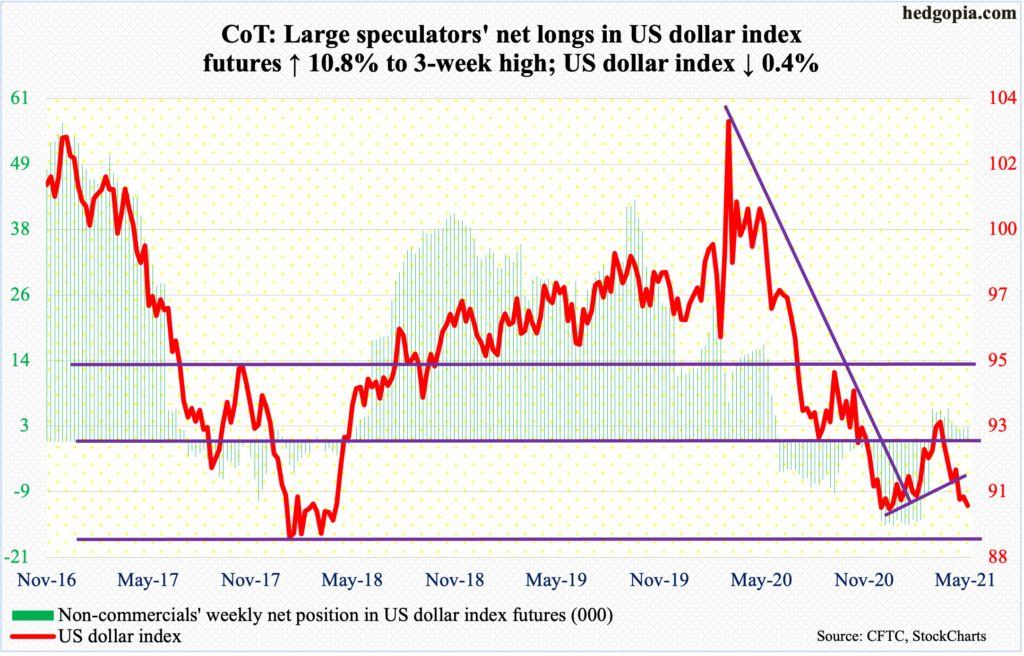
After last week’s loss of a rising trend line from January 6 when the US dollar index bottomed at 89.17, dollar bears pushed the currency lower toward support at 88-89. Post-January defense of this support, which goes back at least 17 years, the index (90) rallied all the way to 93.47 by March 31.
Bulls are hoping for similar defense. Right here and now, odds are in their favor. Dynamics change if 88-89 decisively gives way, with repercussions felt across all kinds of assets.
VIX: Currently net short 62.2k, down 25k.
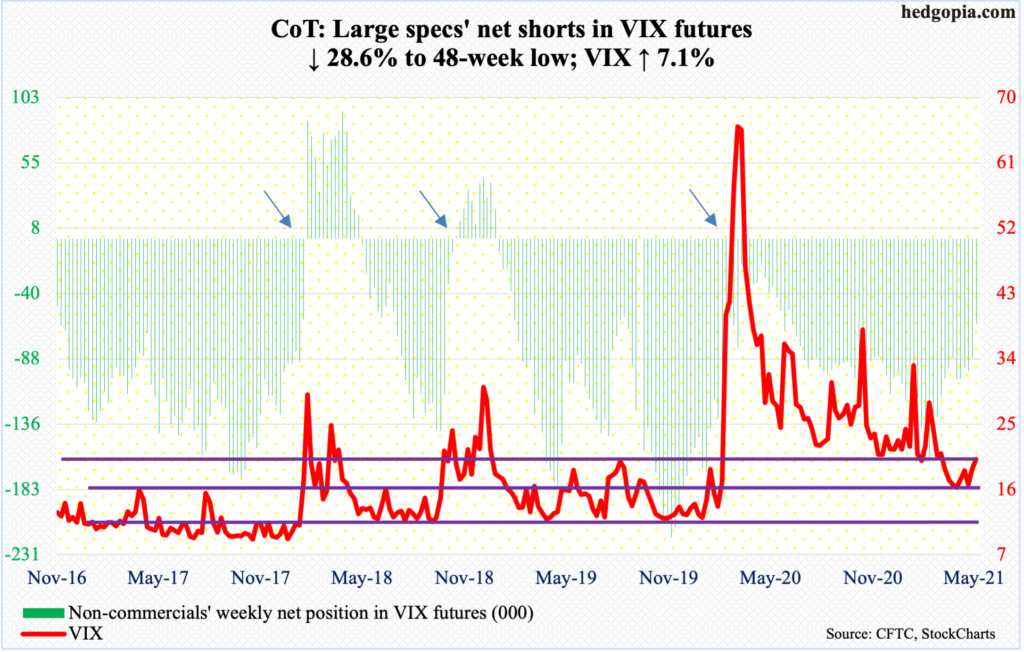
On Thursday last week, VIX reversed after spiking intraday to 28.93, which was yet another lower high since surging to 85.47 in March last year. On Wednesday this week, as the S&P 500 was testing last week’s lows, the volatility index rallied but could only reach 25.96 before reversing lower. It was apparent investors were not betting on higher volatility – not this time around anyway.
The 200-day has been lost, with the 50-day at 19.08. A breach of 20 exposes VIX to downside risks of mid- to high-teens.
Amidst this, non-commercials have been quietly reducing their net shorts, which are currently at a 48-week low. The short-covering has not yet resulted in meaningful upward pressure on VIX. Historically, the volatility index has tended to peak as these traders go long or get close to doing that.
Thanks for reading!
