Following futures positions of non-commercials are as of September 21, 2021.
10-year note: Currently net long 61.2k, down 68.2k.
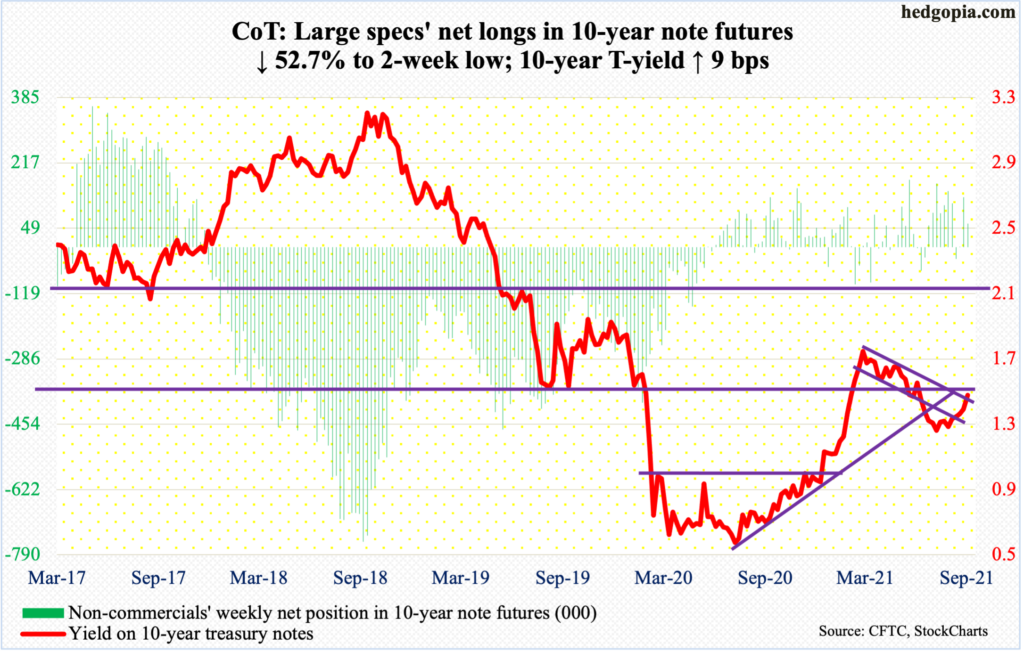
Markets took this week’s FOMC meeting well. Stocks recovered after heavy losses in the first two sessions. Bonds sold off, with the 10-year treasury yield up nine basis points. At least that is the initial reaction.
These assets were reacting to the hints that rates may rise sooner than expected. The 18-person FOMC was evenly split on the prospects for a rate hike next year.
Chair Jerome Powell also set the stage for a tapering announcement in November. Currently, the Fed buys up to $120 billion a month in treasury notes and bonds and in mortgage-backed securities. They intend to end the program around the second half of next year. The balance sheet has doubled from $4.24 trillion in early March last year to $8.49 trillion.
So, for markets to take the tapering/tightening news in stride should have soothed equity bulls as well as bond bears (on price), but it may be too early to do so definitively. The bigger question is if the Fed will manage to taper entirely. It is possible they will miss the window. The US economy is softening – although from a torrid pace. Post-FOMC meeting, the Fed itself downgraded its growth forecast for the year.
30-year bond: Currently net short 88.3k, up 27.7k.

Major economic releases for next week are as follows.
Durable goods orders (August) are due out on Monday. Orders for non-defense capital goods ex-aircraft – proxy for business capital expenditure plans – grew 15.7 percent year-over-year to a seasonally adjusted annual rate of $76.6 billion, which is a new record.
The S&P Case-Shiller Home Price Index (July) will be published on Tuesday. Nationally, US home prices shot up 18.6 percent y/y in June. In the series’ 46-year history, this was the steepest price appreciation ever.
Thursday brings real GDP (2Q21, 3rd revision) and corporate profits (2Q21, revised).
The second estimate showed the economy grew at a 6.6-percent annual rate in 2Q – a three-quarter high.
Preliminarily, 2Q corporate profits increased 9.2 percent quarter-over-quarter to $2.79 trillion (SAAR) – a new high.
On Friday, personal income/spending (August), the ISM Manufacturing Index (September) and the University of Michigan Consumer Sentiment Index (September, final) are on tap.
In the 12 months to July, core PCE, which is the Fed’s favorite measure of consumer inflation, increased 3.62 percent – the steepest pace since May 1991.
Manufacturing rose four-tenths of a point month-over-month in August to 59.9. This was the second consecutive sub-60 reading after five 60-plus prints in a row.
Preliminarily, September consumer sentiment edged up seven-tenths of a point to 71, which is still lower than the post-pandemic low of 71.8 from April last year.
WTI crude oil: Currently net long 381.9k, up 5.9k.
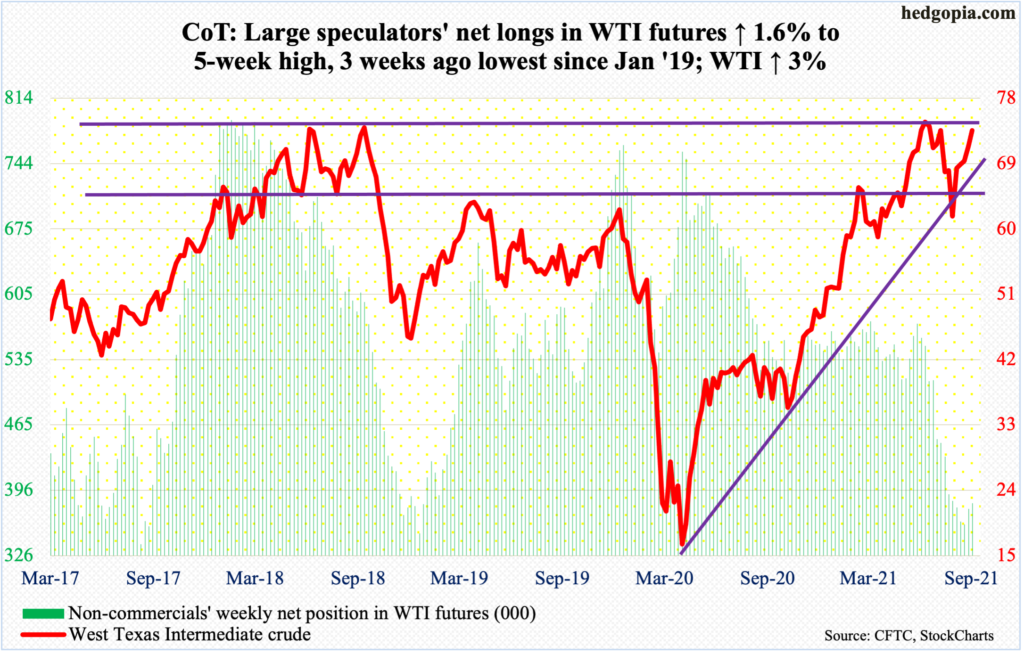
Oil bulls were once again made to test the 50-day. In a long-legged doji session Tuesday, WTI tagged the average ($69.47) and drew buying interest. By Friday, the crude ticked $74.27 intraday, which was the highest price since July 14.
WTI ($73.98/barrel) has come a long way after bottoming on August 23 at $61.74, rallying for five straight weeks. Nevertheless, it remains under the July 6 high of $76.98. In October 2018, it reversed sharply lower after ticking $76.90. It is possible a double top is in the process of forming.
In the meantime, the US oil infrastructure continued to recover from the disruptions caused by Hurricane Ida. In the week to September 17, crude production increased 500,000 barrels per day to 10.6 million b/d. Crude imports rose 704,000 b/d to 6.5 mb/d. Refinery utilization rose 5.4 percentage points to 87.5 percent. Stocks of gasoline increased 3.5 million barrels to 221.6 million barrels. Crude and distillate stocks, however, fell – down 3.5 million barrels and 2.6 million barrels to 414 million barrels and 129.3 million barrels respectively.
E-mini S&P 500: Currently net long 49.8k, up 85.7k.
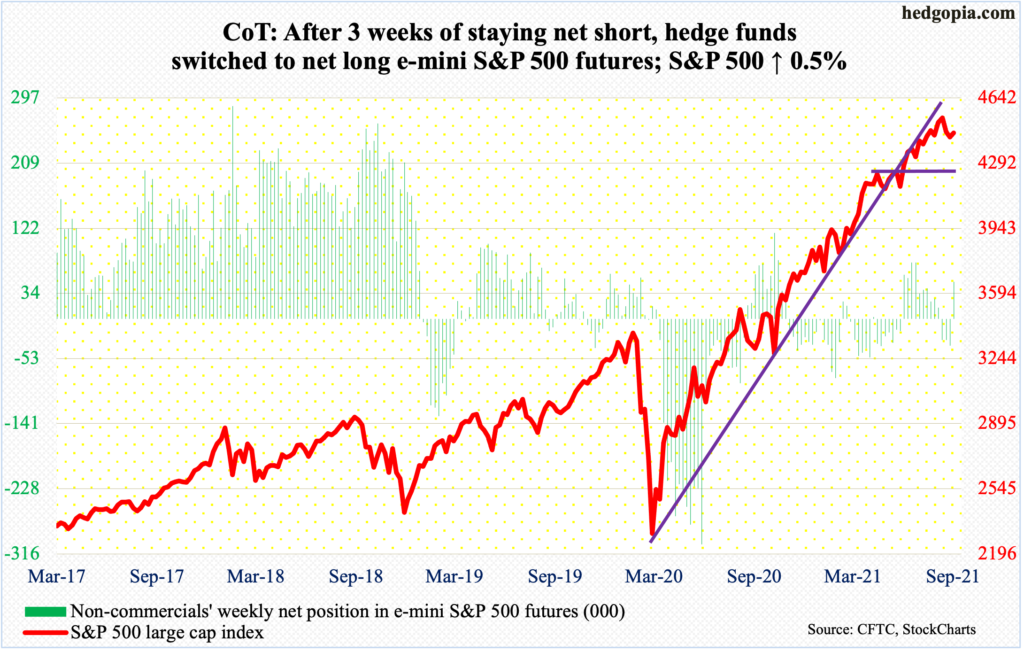
Both bulls and bears could claim victory this week – sort of.
Last week, the S&P 500 essentially closed on the 50-day. This week began with Monday’s gap-down to drop 5.3 percent from the September 2 record high of 4546. This was a small victory for the bears. The bulls, however, promptly put their foot down. Monday’s intraday low of 4306 was bought. By Thursday, the 50-day was reclaimed (more on this here).
Prior to this, going back to May last year, the average was tested 10 times – all successfully. Turns out the latest test is evolving similarly. There is decent resistance at 4480s, and after that of course the September 2 high.
With four sessions to go this month, the large cap index (4455) is up 3.7 percent in 3Q. This will have further raised US households’ equity allocation. In 2Q, this was 37.8 percent – a record. In 1Q20 when the S&P 500 put in a major low in March, this was 28.4 percent (chart here). The parabolic rise since – and leading up to that – has excesses written all over it.
The latest selloff had some negative impact on fund flows, but unless this continues for weeks, this is not going to develop into a meaningful headwind. In the week to Wednesday, US-based equity funds lost $6.7 billion (courtesy of Lipper). In the same week, SPY (SPDR S&P 500 ETF), VOO (Vanguard S&P 500 ETF) and IVV (iShares Core S&P 500 ETF) gained $40 million (courtesy of ETF.com). In the prior three weeks, they respectively took in $19.7 billion and $18 billion.
Euro: Currently net long 12.1k, down 15.7k.
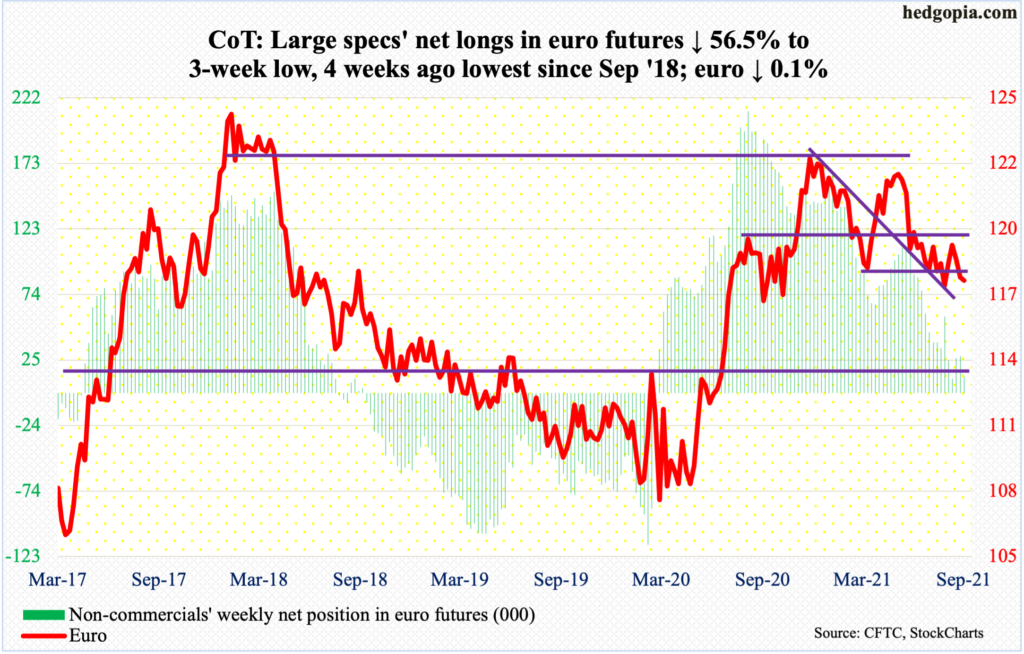
Wednesday’s intraday low of $1.1685 came close to matching the August 20 low of $1.1664 – for a higher low.
On the daily, the euro ($1.1721) can rally. There was decent support just north of $1.17 and this seems to be holding – at least for now.
Importantly, several monthly indicators such as the RSI have reached the median, with the MACD just having developed a potentially bearish cross-under. Thus, if there is a time for euro bulls to put their foot down, this is it. Otherwise, the monthly can continue lower, and $1.17 will be breached at some point.
Gold: Currently net long 187.6k, down 20.1k.

Once again, horizontal support at $1,760s-$1,770s is being tested. This week’s rally attempt stopped on Thursday at $1,788 – just under the 50-day ($1,792). The 200-day lies at $1,807. Both these averages are now slightly pointing down.
This is an important test gold ($1,752/ounce) is facing. A decisive breach of $1,760s-$1,770s opens the door toward $1,670s, which was defended in August and in March before that.
Non-commercials this week cut their net longs to a six-week low.
Nasdaq 100 index (mini): Currently net long 9.4k, down 140.
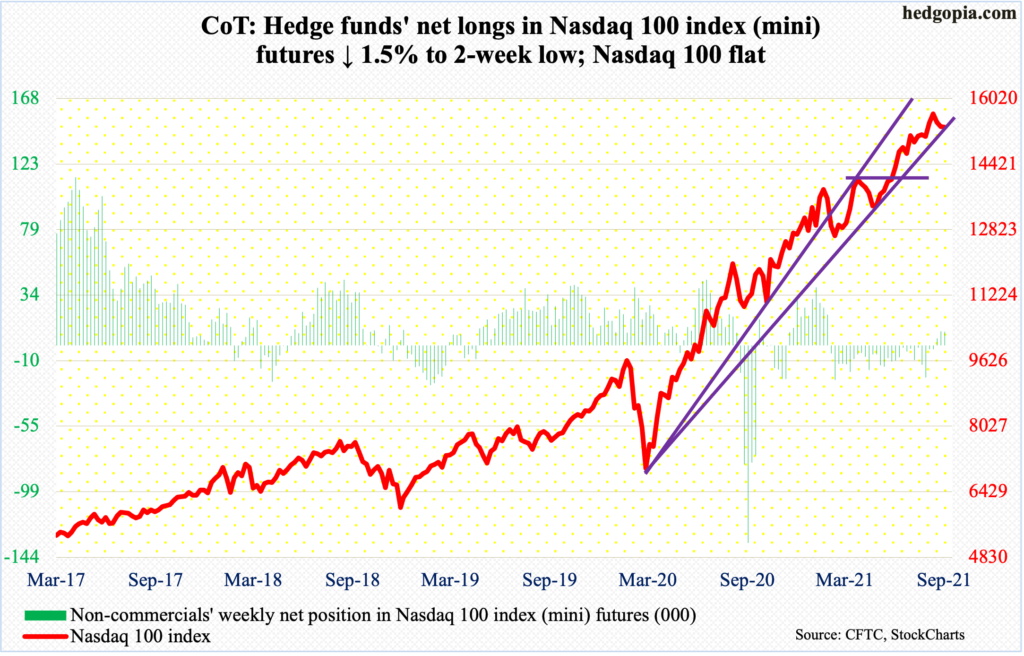
From the September 7 high of 15701 through Monday’s (this week) low of 14821, the Nasdaq 100 lost 5.6 percent. Monday’s gap-down low essentially tested the August 19 low of 14773, which was posted just above the 50-day. This week’s low was put in after the average was breached. The tech-heavy index remained under the average for three sessions before Thursday’s 0.9-percent rally recaptured it. The gap has been filled.
Should the index (15330) continue to rally, which is likely near term, there is straight-line resistance at 15500s.
Longer-term, the monthly seems to want to go lower.
Russell 2000 mini-index: Currently net short 66.6k, up 3.6k.
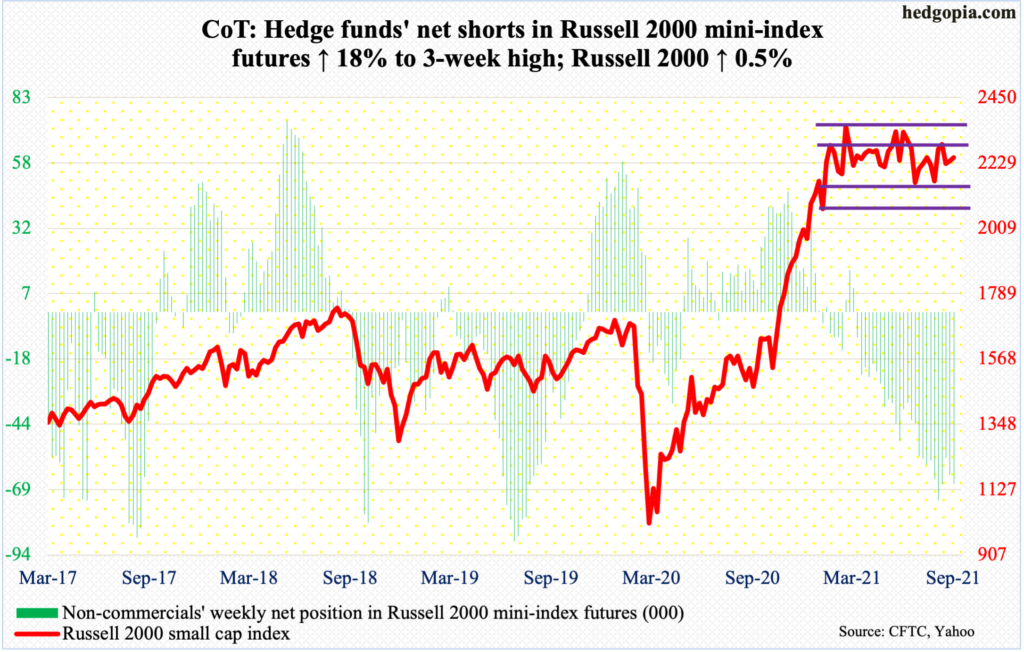
The Russell 2000 has been rangebound between 2350s and 2080s for over six months now. Within this rectangle lies another range between 2280s and 2150s, the lower bound of which was defended on Monday. From that session’s low of 2155, it then proceeded to just about test 2280s on Thursday when the small cap index ticked 2266.
The bottom line is that the sideways action continues – more within the inner range for two and a half months now. Until the index (2248) breaks one way or the other, choppiness continues.
US Dollar Index: Currently net long 25.1k, up 827.
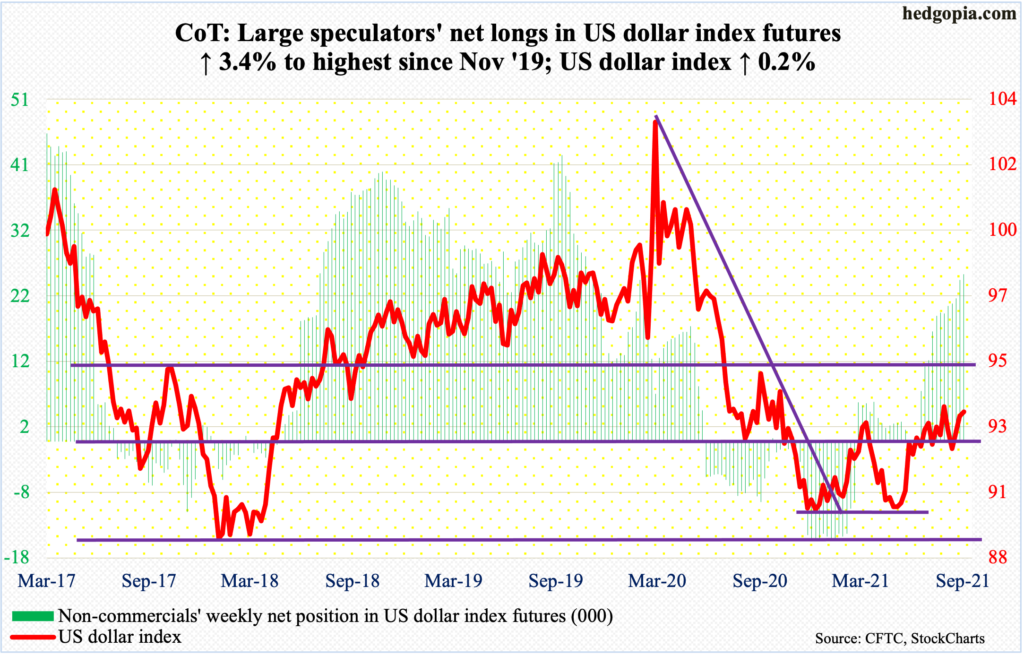
Resistance at 93.50s is proving to be tough. This was tagged on both Wednesday and Thursday. It is possible the US dollar index (93.33) is working on a reverse-head-and-shoulders with a neckline at 93.50s, or a just above. Or it could be a W setup. A breakout will be a major win for dollar bulls. The technically oriented ones will be eyeing 97-98 post-breakout.
But for now, the index is itching to go lower. The 50-day is right underneath at 92.75, followed by the daily lower Bollinger band at 92.02. The latter lines up with support just north of 92, which goes back to June 2003. So long as this support holds, bulls deserve the benefit of the doubt.
VIX: Currently net short 61.9k, down 21.8k.
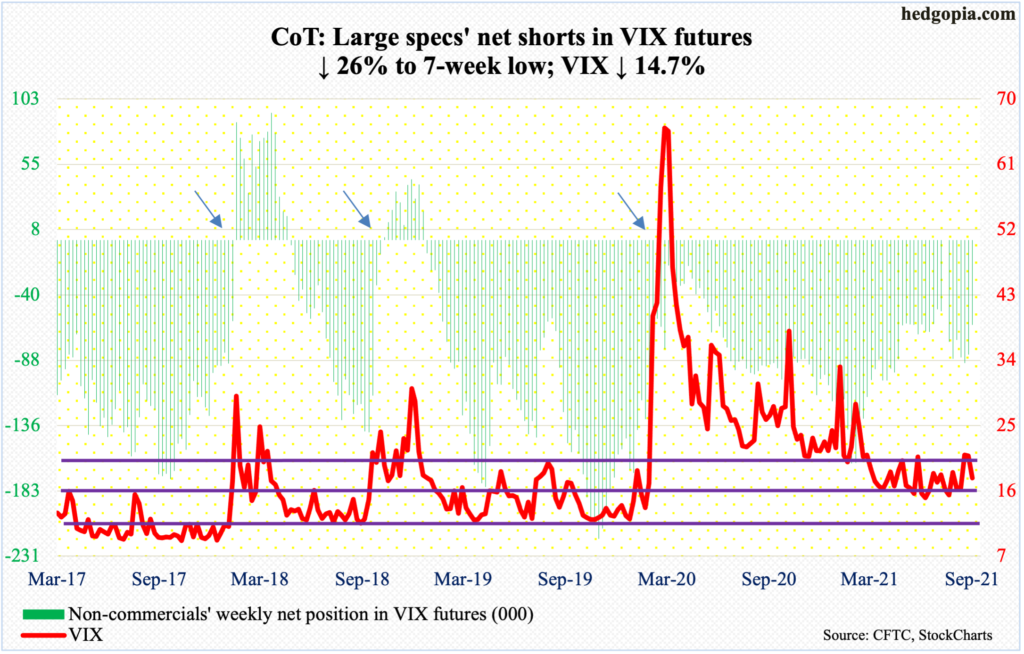
On Monday, VIX (17.75) came within 0.15 points of surpassing the May 13 high of 28.93; volatility bulls, however, were unable to save the session high 28.79, closing at 25.71. Several times in the past, spike reversals led to quick unwinding of rallies. This time was no different. By Thursday, the index lost the 200-day (19.99) and on Friday the 50-day (18.35).
The daily can still head lower. There is crucial three-month, trend-line support at 16.50.
This week, VIX went back to maintaining its negative correlation with the S&P 500. Last week, the two moved in unison (more on this here).
Thanks for reading!

