
Following futures positions of non-commercials are as of September 28, 2021.
10-year note: Currently net long 181.2k, up 120k.
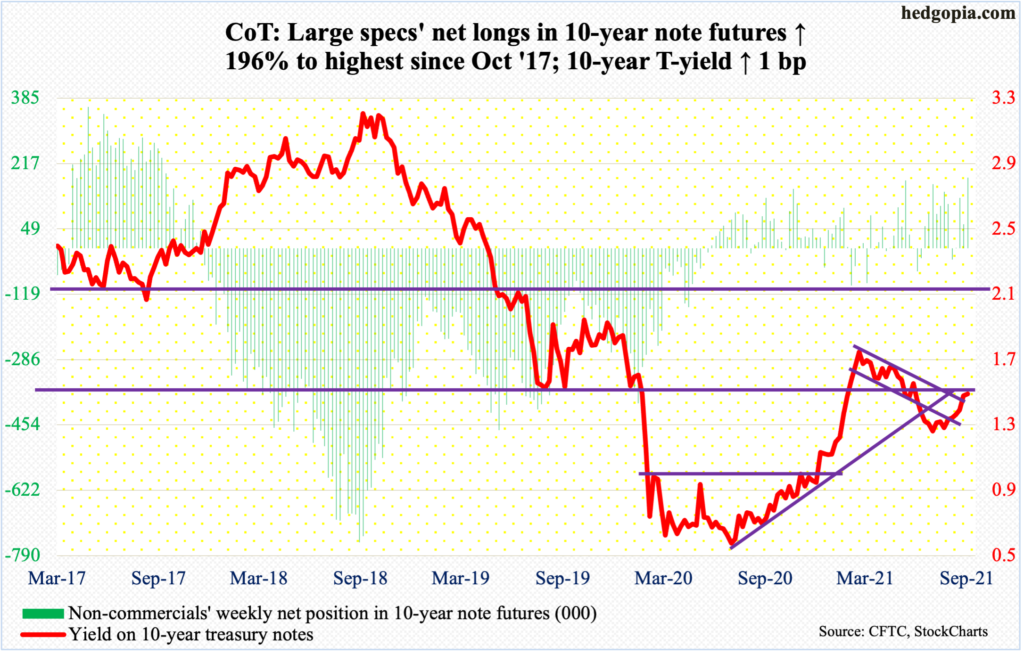
In February last year, the 10-year treasury yield breached mid-1.40s, before tumbling to bottom at 0.4 percent in the following month. It was not until February this year that bond bears (on price) were able to reclaim the level. Rates then peaked at 1.77 percent on March 30, before once again proceeding to lose mid-1.40s in early July. This time around, it took the bears two and a half months to reclaim the level.
This is taking place even as the Fed is getting ready to both taper and tighten (more on this here). At last week’s FOMC meeting, Chair Jerome Powell set the stage for a tapering announcement in November. Currently, the Fed buys up to $120 billion a month in treasury notes and bonds as well as mortgage-backed securities. They intend to end the program around the second half of next year. The balance sheet has doubled from $4.24 trillion in early March last year to $8.45 trillion. Concurrently, benchmark rates may begin to lift off in the second half next year.
Post-FOMC meeting last week, rates took out mid-1.40s on Friday. By Tuesday’s spinning top session (this week), the 10-year (1.47 percent) rose as high as 1.57 percent before backing off. To boot, a shooting star showed up on the weekly.
The daily is overbought. Breakout retest is just a matter of time. Odds favor it fails to hold in the sessions ahead. Non-commercials are betting on that outcome, as they aggressively added to net longs in 10-year note futures.
30-year bond: Currently net short 106.9k, up 18.7k.

Major economic releases for next week are as follows.
Factory orders (August) are due out on Monday. August’s preliminary data showed orders for non-defense capital goods ex-aircraft – proxy for business capex plans – rose 13.7 percent year-over-year to a seasonally adjusted annual rate of record $77.1 billion. This is a very high growth rate but at the same time represents deceleration from April’s 25.8 percent growth.
The ISM non-manufacturing index (September) will be published on Tuesday. Manufacturing activity in August declined 2.4 percentage points month-over-month to 61.7 percent. This was the sixth consecutive month of 60-plus reading.
Friday brings non-farm payroll (September). August only produced 235,000 jobs, much softer than 1.1 million in July and 962,000 in June. From the post-pandemic low of 130.2 million, 17 million new jobs have been created. That said, this is still 5.3 million fewer than the record high of 152.5 million from February last year.
WTI crude oil: Currently net long 396.9k, up 15k.
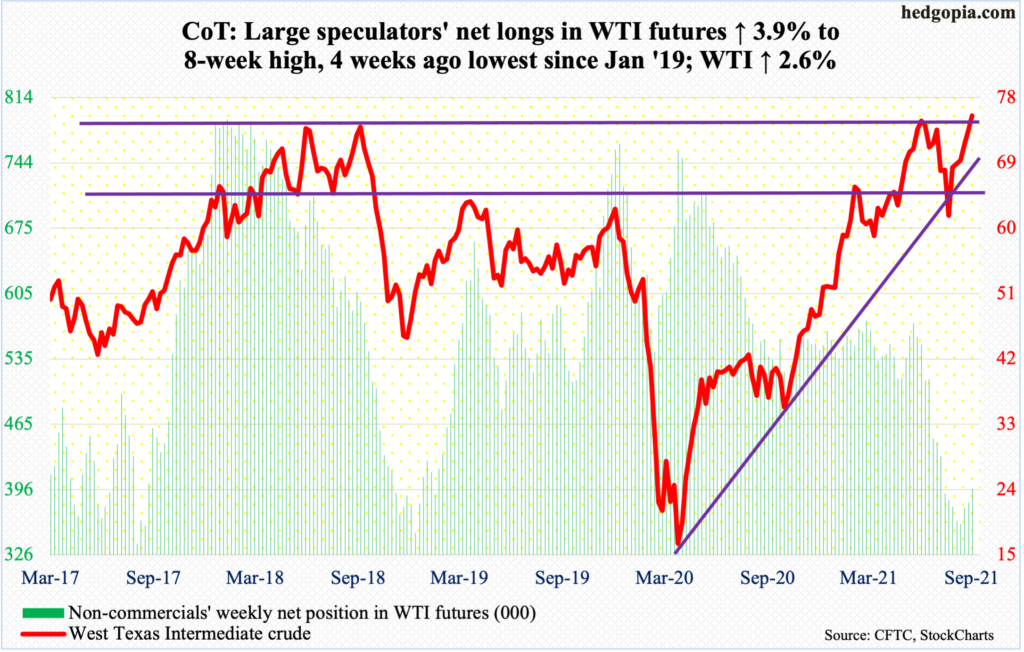
Oil bulls began the week where they left off. Last week, WTI ($75.88/barrel) rallied three percent. This week began with Monday’s two percent rally. By Tuesday, in a spinning top session, the crude tagged $76.67 intraday, testing major resistance. Earlier on July 6, WTI retreated after ticking $76.98 and before that $76.90 in October 2018. As a matter of fact, this level has proven to be important for bulls and bears alike going back 15 years.
Bulls’ mettle is being tested. Trading this week shows there are doubters. Wednesday and Thursday, too, produced a spinning top.
The daily is extended.
In the meantime, the US oil infrastructure continued to recover from the disruptions caused by Hurricane Ida. In the week to September 24, crude production increased 500,000 barrels per day to 11.1 million b/d. Crude imports rose 87,000 b/d to 6.6 mb/d. As did stocks of crude, gasoline and distillates – respectively up 4.6 million barrels, 193,000 barrels and 384,000 barrels to 418.5 million barrels, 221.8 million barrels and 129.7 million barrels. Refinery utilization rose six-tenths of a percentage point to 88.1 percent.
E-mini S&P 500: Currently net long 73.2k, up 23.3k.
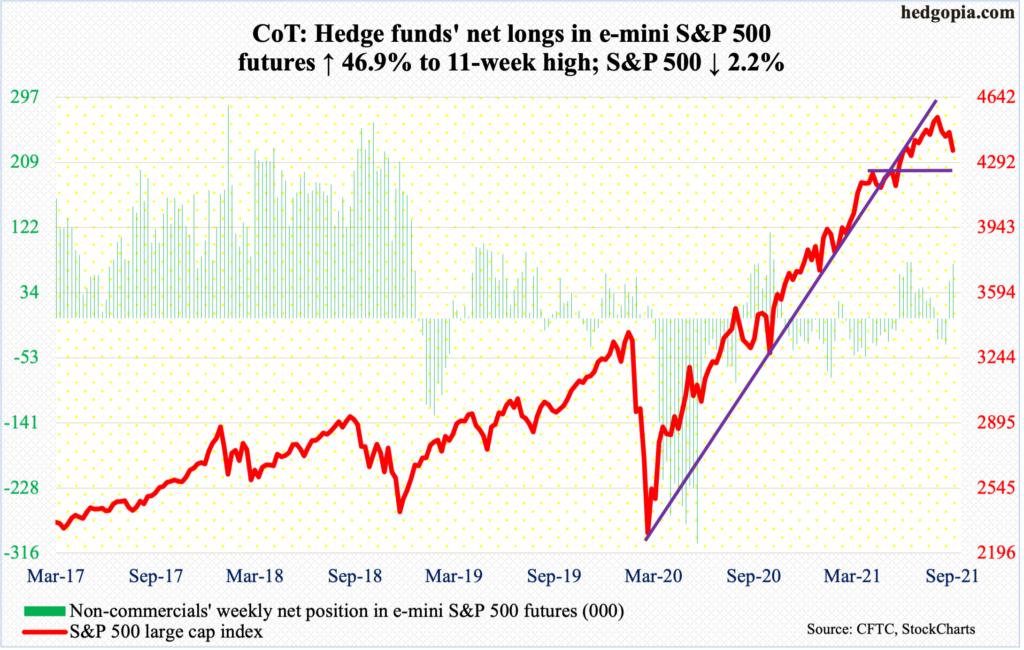
After seven consecutive positive months – and in nine out of last 11 – the S&P 500 suffered a down month. September cost the large cap index 4.8 percent.
The index (4357) began to reverse on the 2nd last month after ticking a new intraday high of 4546. It then proceeded to lose 5.7 percent through Friday’s low of 4289, which was bought. Bids showed up well before testing straight-line support at 4230s.
The 50-day (4443) has been breached and likely gets tested in the sessions ahead. After this, 4480s is the one to watch.
Flows meanwhile are beginning to get defensive. In the week to Wednesday, US-based equity funds lost $9.3 billion (courtesy of Lipper). In the same week, SPY (SPDR S&P 500 ETF), VOO (Vanguard S&P 500 ETF) and IVV (iShares Core S&P 500 ETF) lost $4.9 billion (courtesy of ETF.com). This compares with outflows of $6.7 billion and inflows of $40 million in the prior week, in that order.
Buybacks, on the other hand, are beginning to once again act as a tailwind (more on this here).
Euro: Currently net long 872, down 11.2k.
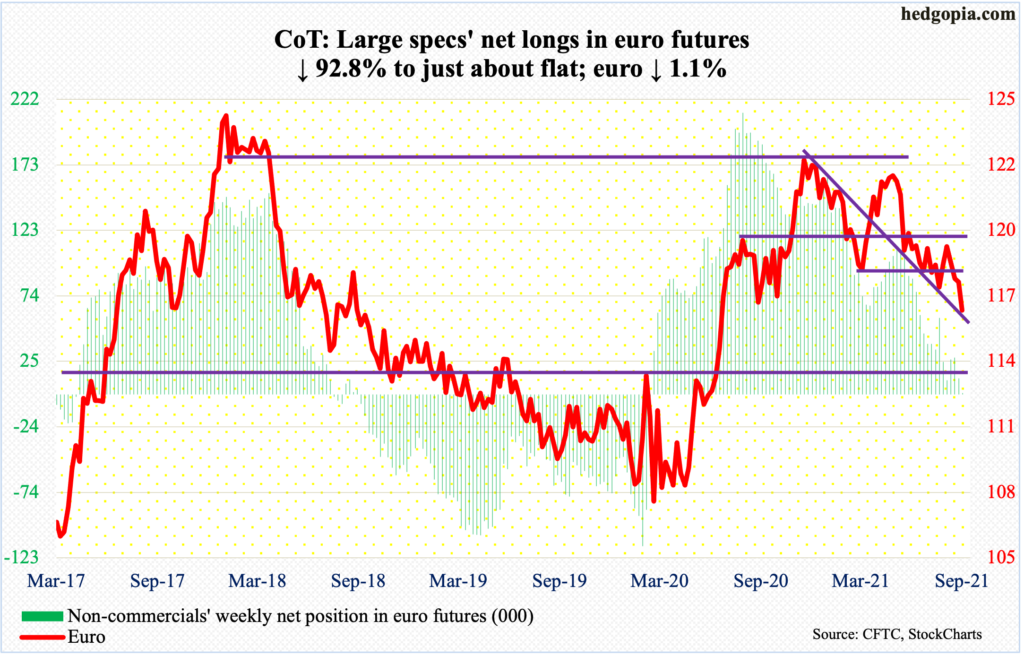
The euro ($1.1595) broke down this week, dropping 1.1 percent. Last week, it closed right on support just north of $1.17, which gave way this week, as did the August 20 low of $1.1664.
On the daily, the currency remains grossly oversold, but momentum remains down. There is horizontal support just south of $1.15. In the event longs put their foot down right here, which is looking highly likely, it is possible shorts get active again at the broken-support-turned resistance of $1.17-plus.
Gold: Currently net long 168.4k, down 19.2k.
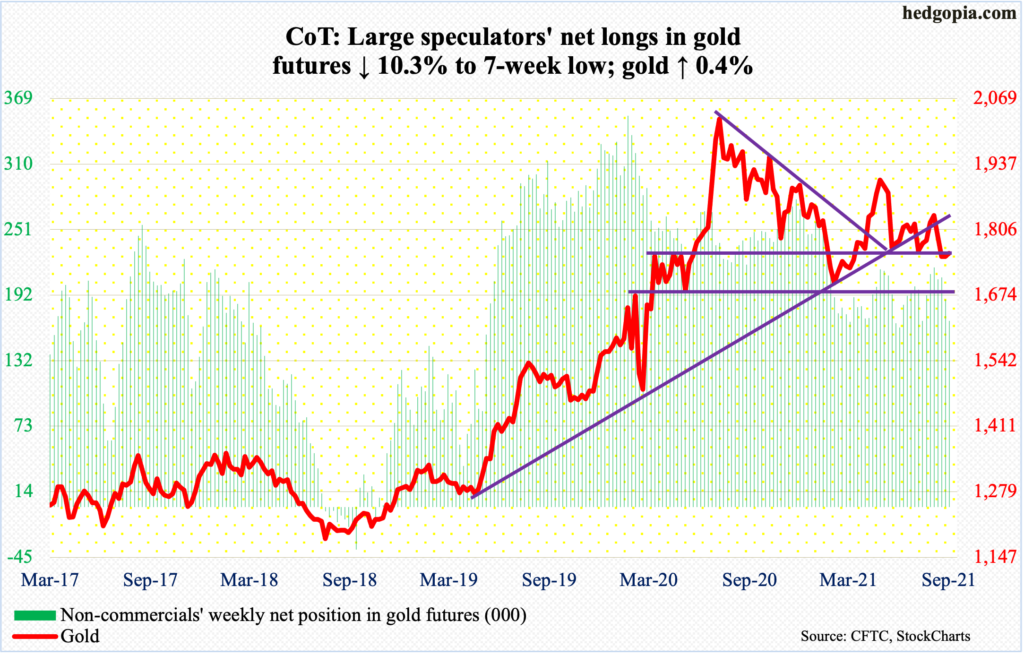
Gold ($1,758/ounce) remains in limbo – trapped between $1,760s-$1,770s and $1,670s – with rising odds of a rally. The daily seems to want to rally. The upper range probably gets reclaimed in the sessions ahead, which opens the door to a test of the 50- and 200-day ($1,786 and $1,804 respectively). A falling trend line from August last year when gold peaked at $2,089 extends to $1,830s, which approximates straight-line resistance.
Nasdaq 100 index (mini): Currently net short 2.3k, up 11.7k.
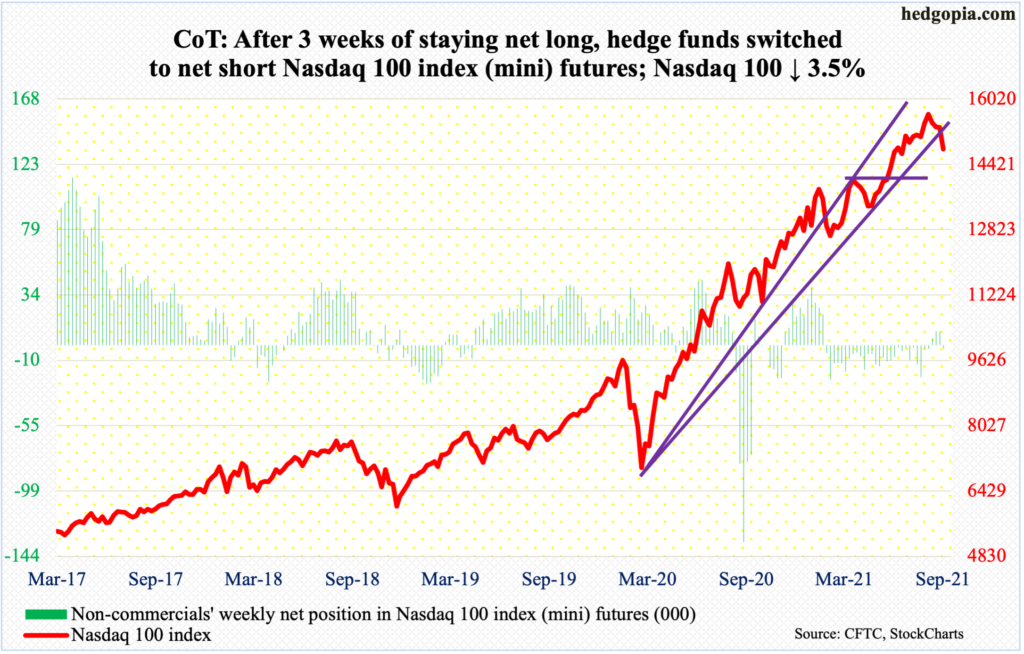
As did the S&P 500, the Nasdaq 100 suffered an outside month in September. Down 4.8 percent, this was the first down month in four – second in five and third in 11.
A new intraday high of 15701 was posted on September 7. On Thursday, short-term horizontal support at 14700s was breached, followed by Friday’s intraday low of 14555. But that low was bought, resulting in a potentially bullish hammer.
For the week, the tech-heavy index (14792) declined 3.5 percent.
Ahead, there is gap-down resistance at 15000, followed by the 50-day at 15209.
Longer-term, the monthly is beginning to unwind its overbought condition. The only question is the extent of unwinding that is likely to unfold in the weeks ahead. Tech bulls would not want to see the index unwind all the way to oversold territory. There is a long way before that happens.
Russell 2000 mini-index: Currently net short 55.6k, down 11k.
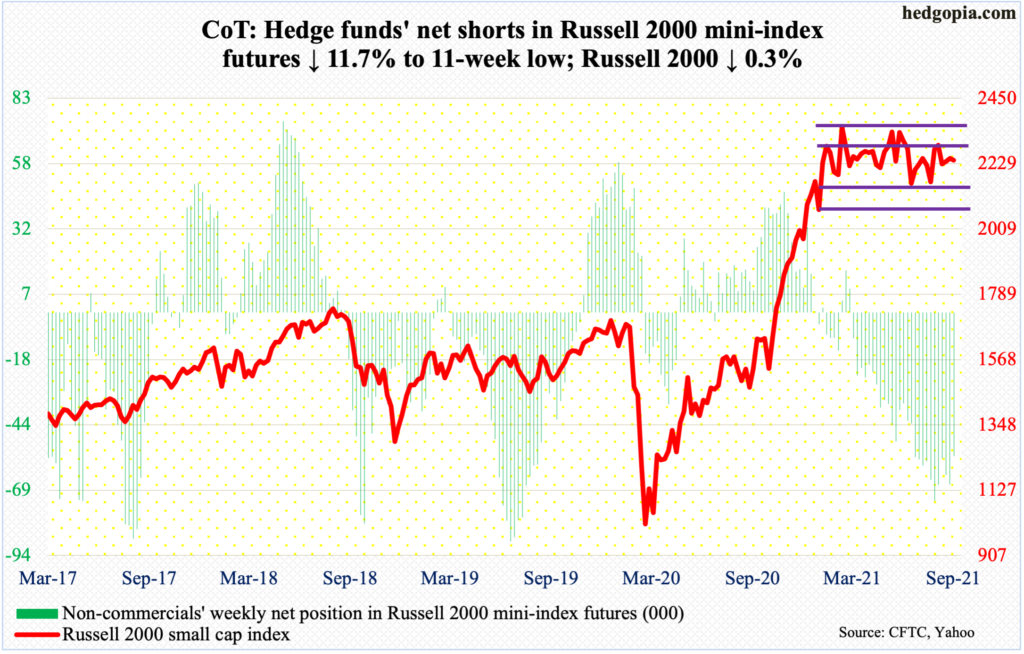
Versus their large-cap peers, small-caps fared much better this week. The Russell 2000 was down 0.3 percent for the week and had momentum strong enough early on to go attack 2280s.
The small cap index (2242) has been rangebound between 2350s and 2080s for six and a half months now. Within this rectangle lies another range between 2280s and 2150s. On Monday, the index rose as high as 2293 before retreating; this was followed by a 2280 print on Tuesday. But the ceiling held firm.
In essence, the rangebound action continues. Whichever way it breaks, momentum likely follows.
US Dollar Index: Currently net long 26.5k, up 1.4k.
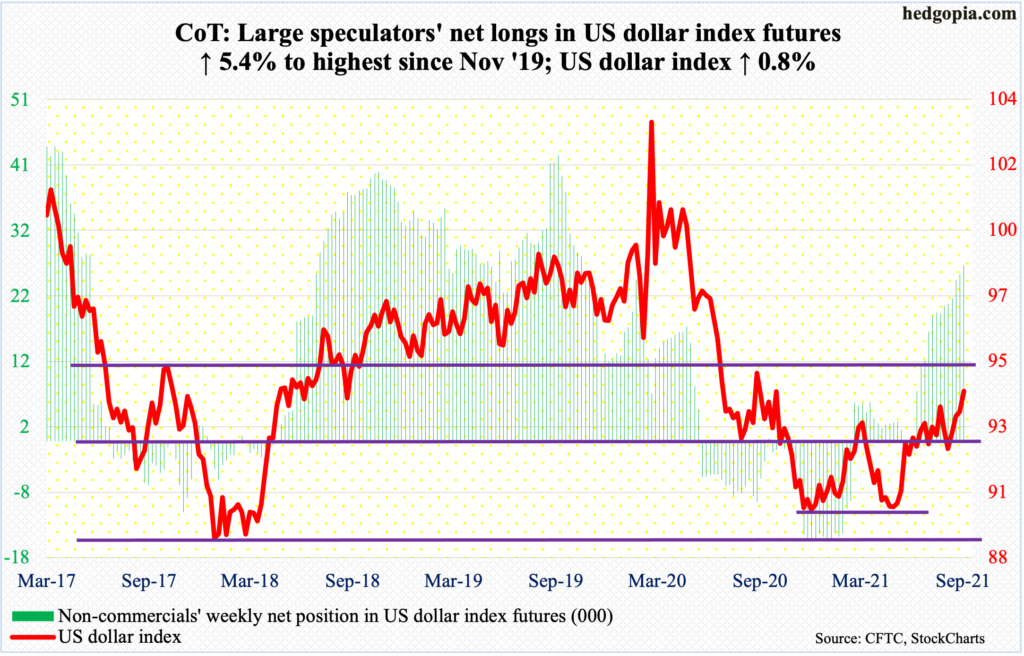
Resistance at 93.50s gave way on Tuesday. By Thursday, the US dollar index tagged 94.52. Around 95 lies major resistance. If this goes, dollar bulls would be one step closer to seeing 97-98; 93.50s makes up the neckline of a reverse-head-and-shoulders pattern. This could also be a W setup. The measured move of a breakout leads to 97-98.
The US dollar index is in an uptrend, with Thursday’s high kissing the rising trend line. The daily is overbought, and should it begin to unwind, breakout retest at 93.50s is worth a watch.
VIX: Currently net short 67.4k, up 5.4k.
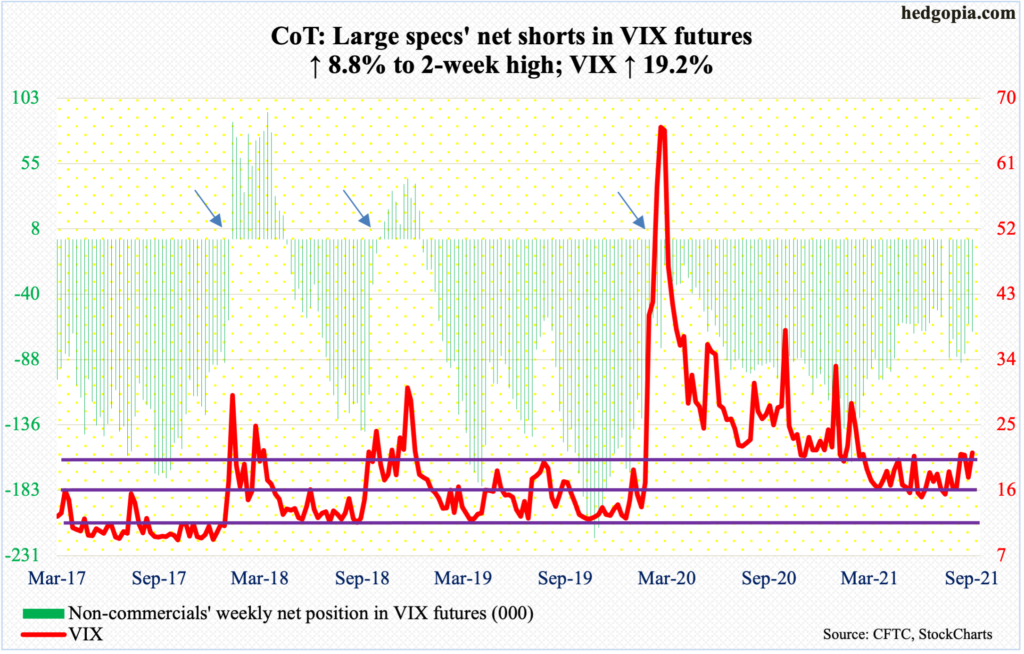
On the S&P 500, Thursday’s close undercut the September 20 close by 50 points, yet VIX was nowhere close. On that day, the volatility index closed at 25.71, with an intraday high of 28.79; in contrast, Thursday’s close was 23.14 and intraday high 24.71.
Investors are looking for protection, but they are not willing to do so at any cost. In other words, VIX (21.15) is diverging with the S&P 500. This is a potential positive for equity bulls near term.
Thanks for reading!
