
Following futures positions of non-commercials are as of October 19, 2021.
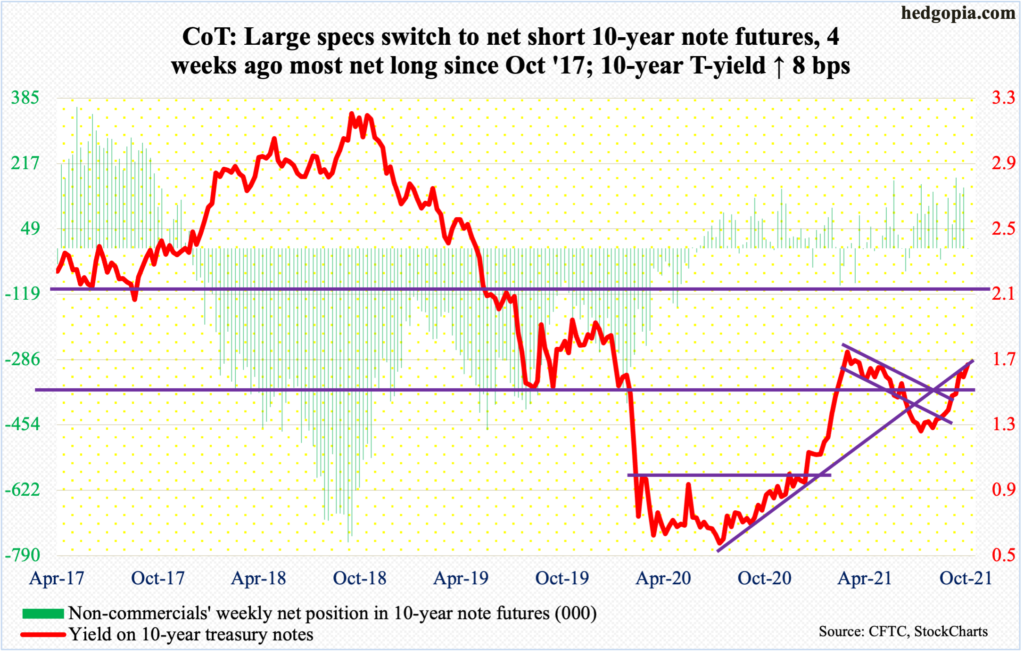
10-year note: Currently net short 544, up 156.6k.
In the 12 months to August, foreigners purchased $3.8 billion in treasury notes and bonds. As recently as February this year, they were selling $685.1 billion worth, which was a record. August was the first positive month since December 2018. This is quite a U-turn on their part. The current trajectory is decidedly up.
In contrast, the Fed is getting ready to taper. The next FOMC meeting is scheduled for November 2-3. In the September 21-22 meeting, Chair Jerome Powell set the stage for a tapering announcement in November.
The central bank currently sits on $4.71 trillion in treasury notes and bonds, up from $2.03 trillion in early March last year. As its purchases peter out in the coming months, out goes the artificially created demand for these securities. At least in theory, this should exert upward pressure on the long end of the yield curve, but then again foreigners seem ready to fill the vacuum – magnitude notwithstanding.
Amidst these dynamics, the 10-year treasury yield (1.66 percent) continues higher, having tagged 1.69 percent in Friday’s outside day session. This was preceded by Thursday’s dragonfly doji. Early August, rates bottomed at 1.13 percent. Conditions are getting extended, with subtle signs of fatigue.
Non-commercials, in the meantime, went from heavily net long to slightly net short 10-year note futures. Bond bears risk being in a crowded trade (more on this here).
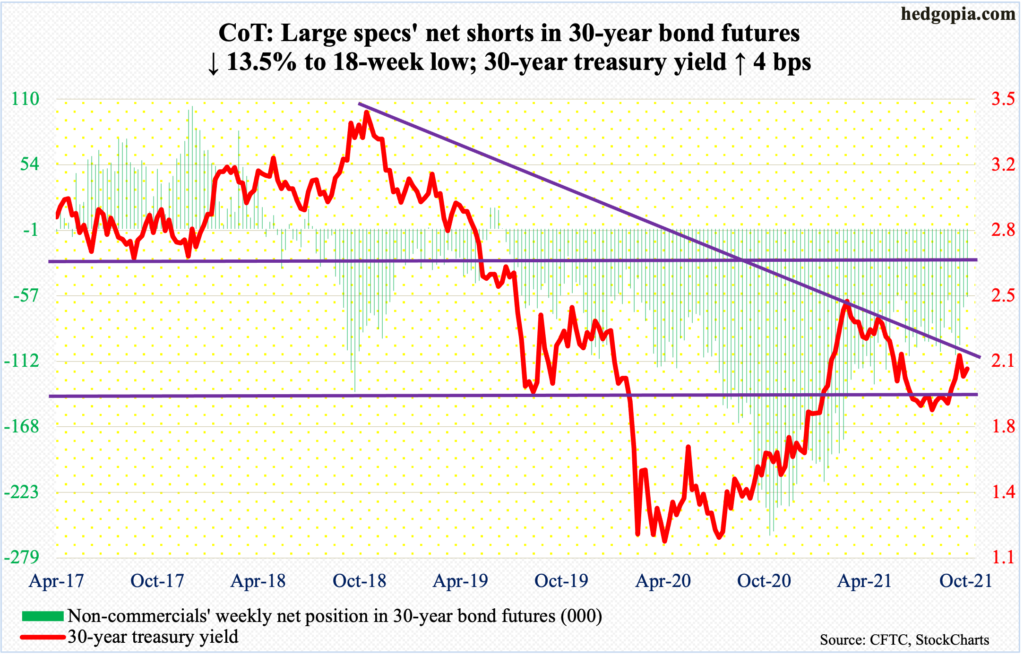
30-year bond: Currently net short 57.6k, down 9k.
Major economic releases for next week are as follows.
The S&P Case-Shiller Home Price Index (August) and new home sales (September) are scheduled for Tuesday.
Nationally in July, US home prices shot up 19.7 percent year-over-year – the best growth rate ever. (Data goes back to January 1975.)
Sales of new homes rose 1.5 percent month-over-month in August to a seasonally adjusted annual rate of 740,000 units – a four-month high.
Durable goods orders (September) are due out Wednesday. In the 12 months to August, orders for non-defense capital goods ex-aircraft – proxy for business capex plans – jumped 13.7 percent to $77.1 billion (SAAR), which is a new record. The post-pandemic low of $59.9 billion was set in April last year.
Thursday brings GDP (3Q21, first estimate). In 2Q, real GDP grew at an annual rate of 6.7 percent. The Atlanta Fed’s GDPNow model forecasts growth of 0.5 percent in 3Q (no typo).
On Friday, personal income/spending (September), the employment cost index (3Q21) and the University of Michigan’s consumer sentiment index (October, final) are on tap.
In the 12 months to August, core PCE, which is the Fed’s favorite measure of consumer inflation, increased 3.62 percent. This was the fastest pace of inflation since May 1991.
In 2Q, total comp of private industry workers grew 3.1 percent y/y. This was the steepest increase since 1Q08.
October’s preliminary reading showed consumer sentiment declined 1.4 points m/m to 71.4. In August, sentiment tumbled to 70.3, which is lower than the post-pandemic low of 71.8 from April last year.
WTI crude oil: Currently net long 452.8k, up 35.4k.
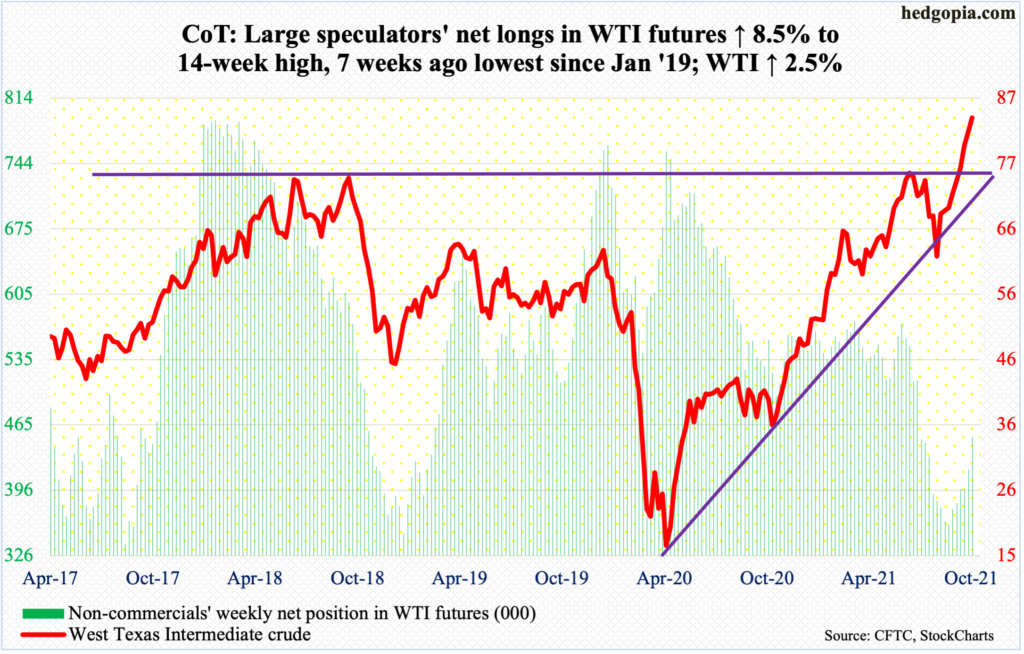
On Friday, WTI ($83.76/barrel) rallied as high as $84.22 – a seven-year high. Bulls kept defending the 10-day moving average. As recently as August 23, the crude bottomed at $61.74, so has come a long way.
Particularly on the daily, conditions have remained overbought for some time. Along the way, signs of indecision/fatigue have appeared here and there on the daily, but none so meaningfully on the weekly. The crude has rallied for nine straight weeks.
In the meantime, stocks of crude, gasoline and distillates all fell in the week to October 15 – down respectively 431,000 barrels, 5.4 million barrels and 3.9 million barrels to 426.5 million barrels, 217.7 million barrels and 125.4 million barrels. US crude production declined as well – down 100,000 barrels per day to 11.3 million b/d. As did crude imports, which dropped 169,000 b/d to 5.8 mb/d. Refinery utilization dropped two percentage points to 84.7 percent.
E-mini S&P 500: Currently net long 67.6k, down 31.2k.
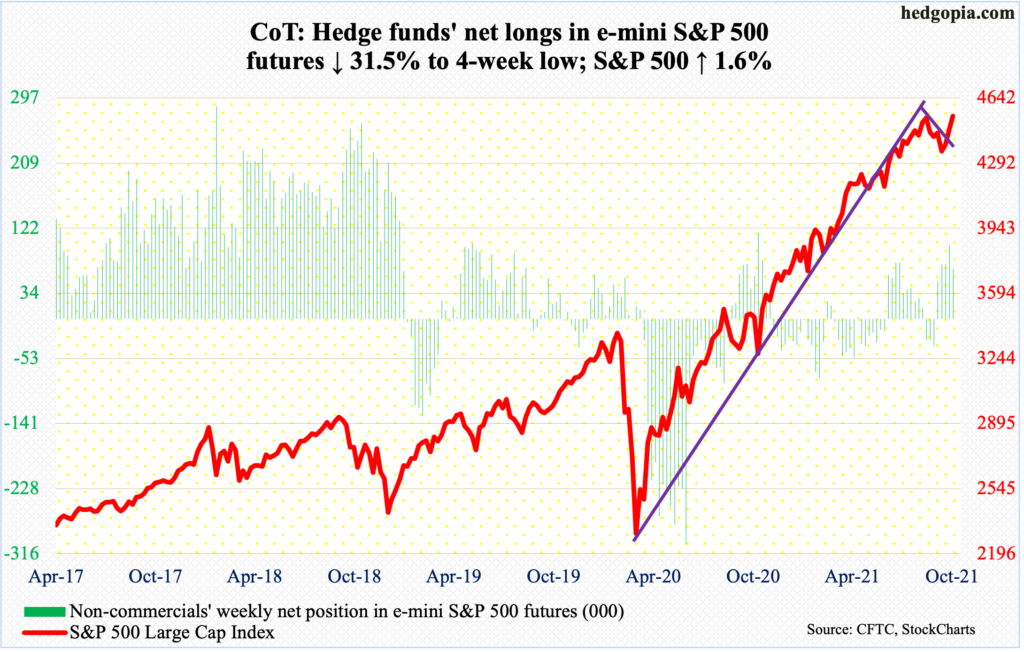
After rallying the S&P 500 for seven consecutive sessions, bulls registered a new intraday high of 4551 on Thursday, past the prior high of 4546 from September 2. Come Friday, the large cap index posted another intraday day high of 4560 but ended up down 0.1 percent to 4545, forming a spinning top. A spinning top also formed on September 2, as well as on the 3rd, before losing 5.9 percent through October 4.
Action next week is worth watching.
In the week to Wednesday, US-based equity funds took in $10.9 billion, coming on the heels of inflows of $6.6 billion in the prior two (courtesy of Lipper). In the same week, SPY (SPDR S&P 500 ETF), VOO (Vanguard S&P 500 ETF) and IVV (iShares Core S&P 500 ETF) gained $3.2 billion (courtesy of ETF.com).
In all likelihood, margin debt has cooperated. October-to-date, the S&P 500 is up 5.5 percent; if this holds, this will have negated September’s outside month. In September, FINRA margin debt dropped 0.9 percent, or $8.4 billion, from August’s record $911.5 billion (chart here). September’s 4.8-percent drop in the S&P 500 was not the result of these borrowers closing out their books. They are staying put. Bulls will have a problem in their hands once margin debt begins to sustainably come down.
Foreigners are already beginning to reduce exposure to US stocks. In the 12 months to August, they bought $243.8 billion worth, down from record $405.5 billion posted in March this year (chart here). Both margin debt and foreigners’ purchases tend to correlate strongly with the S&P 500.
Euro: Currently net short 12.1k, down 6.3k.
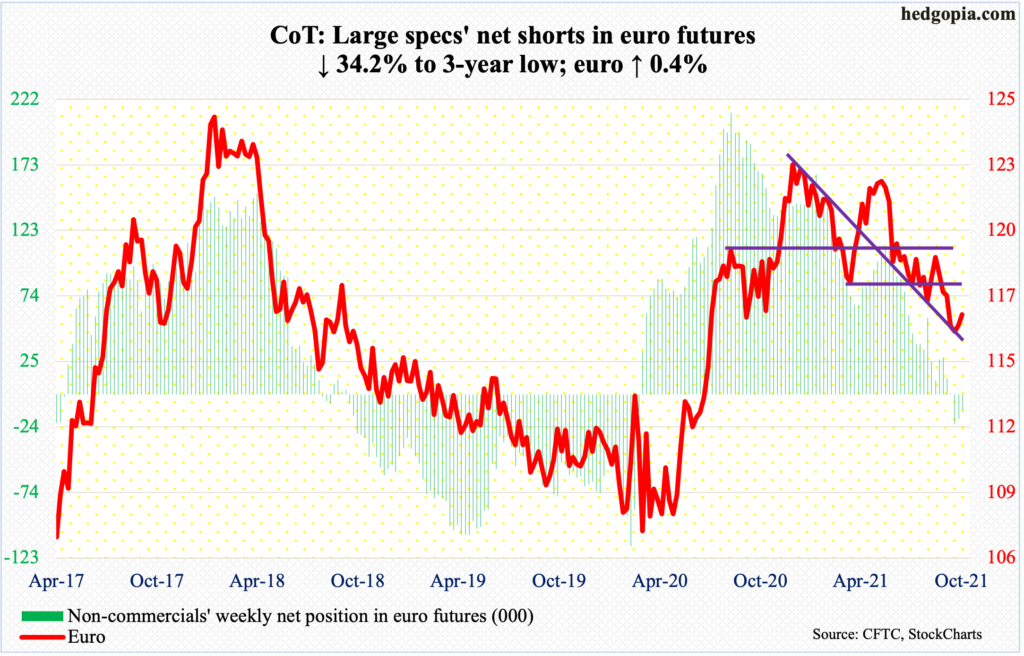
Last week was the first positive week in six. This week, the euro ($1.1644) rose another 0.4 percent. On Tuesday, it touched $1.1660 before facing straight-line resistance.
The currency has room to continue higher on the weekly. So long as the low of $1.1525 posted on the 12th is not breached, bulls deserve the benefit of the doubt. If this week’s high is taken out, then there is stronger resistance just north of $1.17, which also lines up with the 50-day at $1.1707.
Gold: Currently net long 193.3k, up 7.8k.
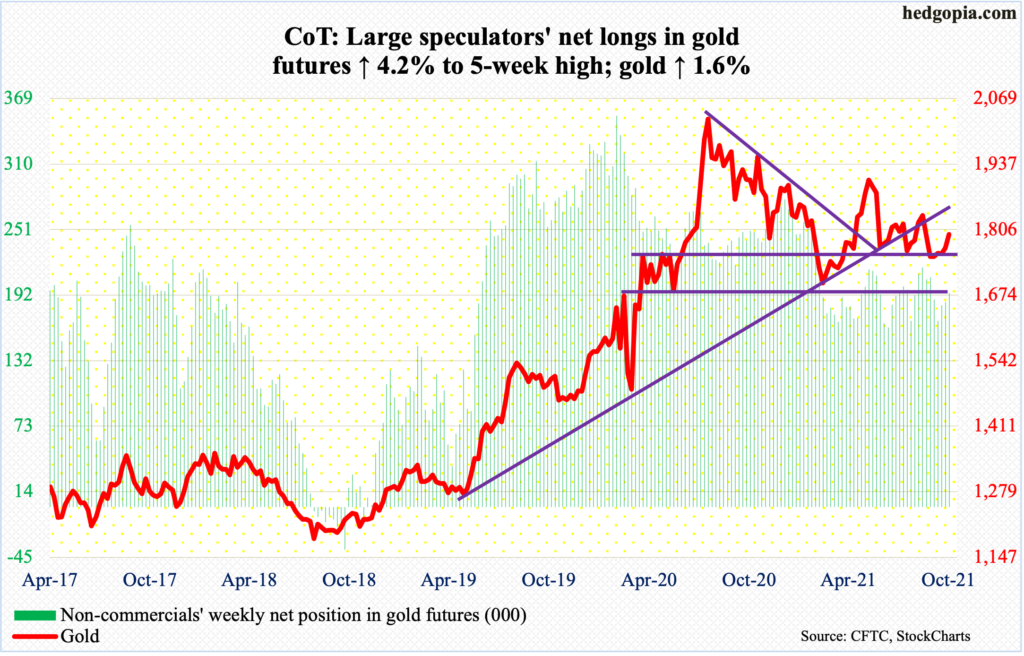
Gold bugs late last week were vehemently denied at the 200-day. Early this week, they repeatedly put their foot down where they needed to. Support at $1,760s-$1,770s was defended.
As things stand, the 200-day ($1,795) has repelled rally attempts for over three months now. The average continues to slightly point down, even as the 50-day ($1,781) is beginning to point up. Not much separate the two.
Once the 200-day is decisively reclaimed, gold ($1,796/ounce) faces a bigger test at $1,820s, where a falling trend line from August last year extends to. In fact, Friday’s high of $1,816 just about tested this roadblock, unsuccessfully this time. Odds favor this eventually gives way in the sessions/weeks ahead.
Nasdaq 100 index (mini): Currently net short 3.1k, up 2.2k.
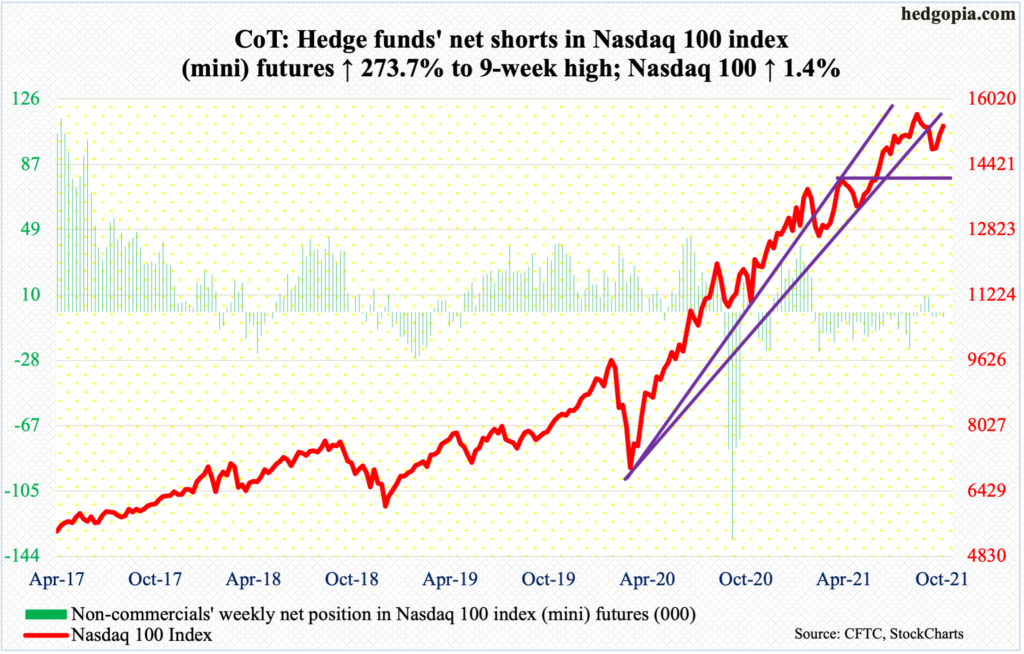
The Nasdaq 100 (15355) began the week by recapturing 15100s as well as the 50-day. By Thursday, it came within 1.3 percent of the record high 15701 from September 7 before pulling back a tad on Friday. From the October 4 low through this week’s high, the tech-heavy index rallied 7.7 percent. Earlier from the September 7 high, it declined 8.4 percent.
Next week is key. Of the top six US companies – all tech – Tesla (TSLA) reported this week and was rewarded, up 7.9 percent. The remaining five – Apple (AAPL), Microsoft (MSFT), Amazon (AMZN), Google owner Alphabet (GOOG) and Facebook (FB) – report next week. They wield too big of an influence on market cap-weighted indices such as the Nasdaq 100 (more on this here). Ahead of this, only MSFT rose to a new high this week. AMZN, GOOG and FB are below their 50-day, and AAPL is barely above the average.
The big honchos need to cooperate post-earnings for the index to rally toward, or surpass, its high from last month.
Russell 2000 mini-index: Currently net short 59.3k, up 10.6k.
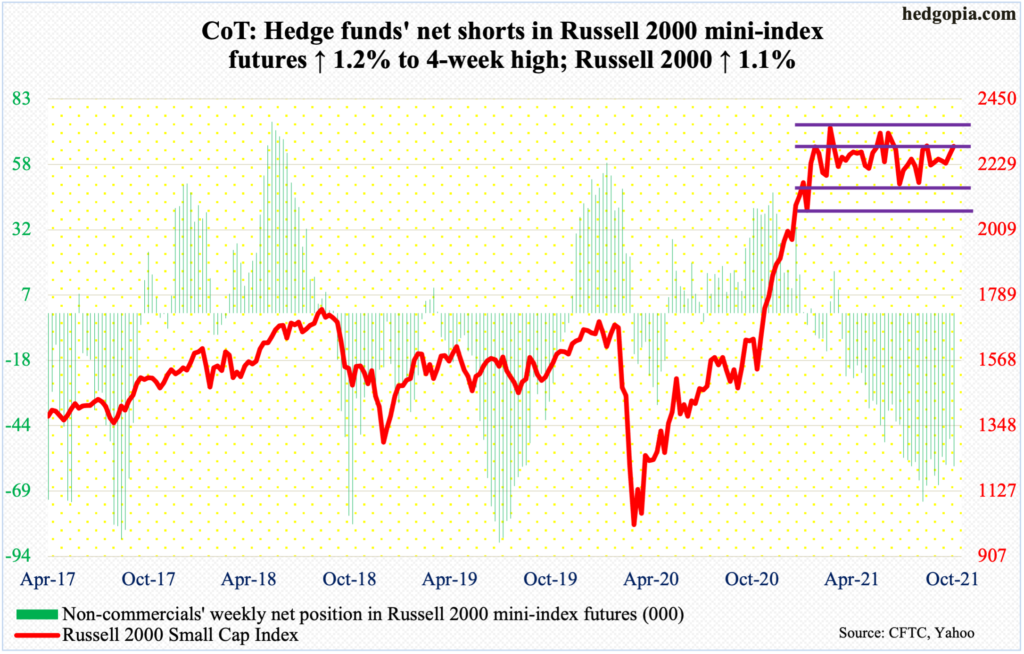
Small-cap bulls are not giving up. Last Friday, they were strongly rejected at 2280s with a daily shooting star.
The Russell 2000 (2291) has been rangebound between 2350s and 2080s for over seven months now. Within this rectangle lies another range between 2280s and 2150s.
This week, they went after the resistance again, with a breakout on Thursday. At that session’s high of 2304, the small cap index was 2.4 percent from the record high posted in March this year. The ongoing earnings season could be playing a role.
As of Monday, blended 3Q operating earnings estimates for S&P 600 companies stood at $18.26, up $0.12 from Oct 6 estimates. This is not that big of a beat, but the reporting season has just begun. Investor optimism is elevated.
US Dollar Index: Currently net long 35.9k, up 872.

The monthly RSI is itching to turn back down from the median. This is potentially bearish momentum-wise. The US Dollar Index has gone more or less sideways in the last four weeks, with the week down 0.3 percent and weekly candles with long upper shadows in the prior three.
This precedes an intraday high of 94.57 on the 12th this month and 94.52 on September 30. Around 95 lies major resistance.
The weekly acts like it wants to go lower. Below lies some important support. In four of the five sessions this week, straight-line support at 93.50s was defended. A breach opens the door toward the 50-day at 93.30, which also lines up with a rising trend line from the May 2021 low of 89.51. This better hold.
VIX: Currently net short 86.8k, up 13.2k.

For the first time since July 2 (this year), VIX (15.43) broke 15 on Thursday with a low of 14.92. Come Friday, the handle was breached again with a low of 14.84, but only to rally to end the session with a spinning top.
On the weekly, the RSI ended the week at 44.73. Going back several years, low-40s has held. This should be no different this time.
Volatility is itching to perk up.
Thanks for reading!
