Following futures positions of non-commercials are as of November 9, 2021.
10-year note: Currently net short 267.3k, down 1.3k.
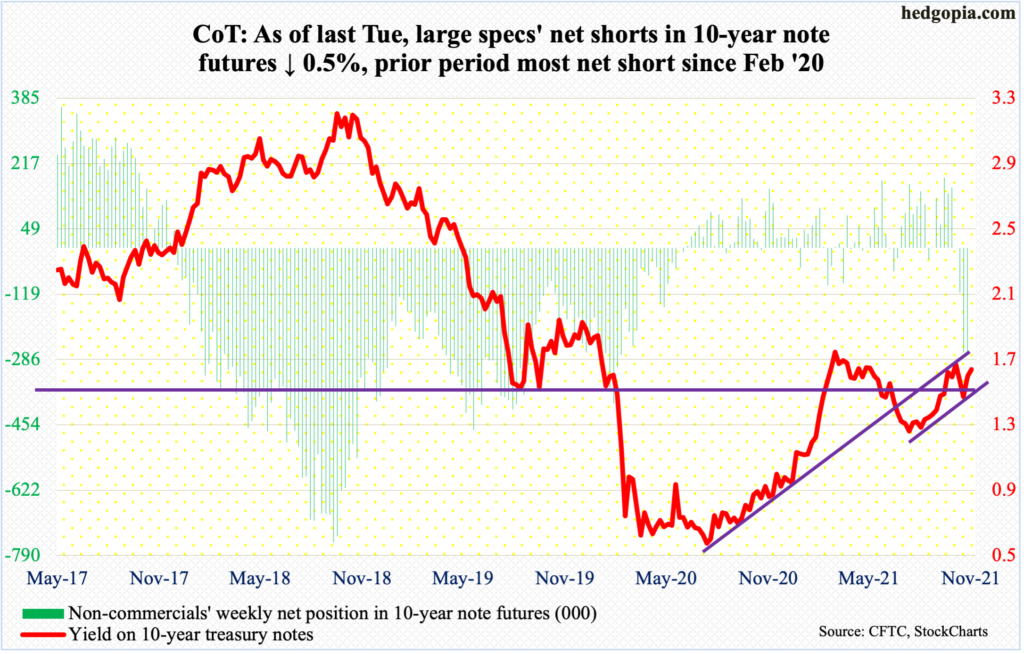
Bond bears (on price) have managed to defend support at low-to mid-1.40s on the 10-year treasury yield. On Tuesday last week, rates breached the 200-day, closing at 1.42 percent, but the average was recaptured in the very next session.
The 10-year (1.62 percent) came under pressure after posting a five-month high 1.69 percent on October 22. So, if last week’s defense of low-to mid-1.40s is genuine, then that high should be within sight. Incidentally, that is where the daily upper Bollinger band lies.
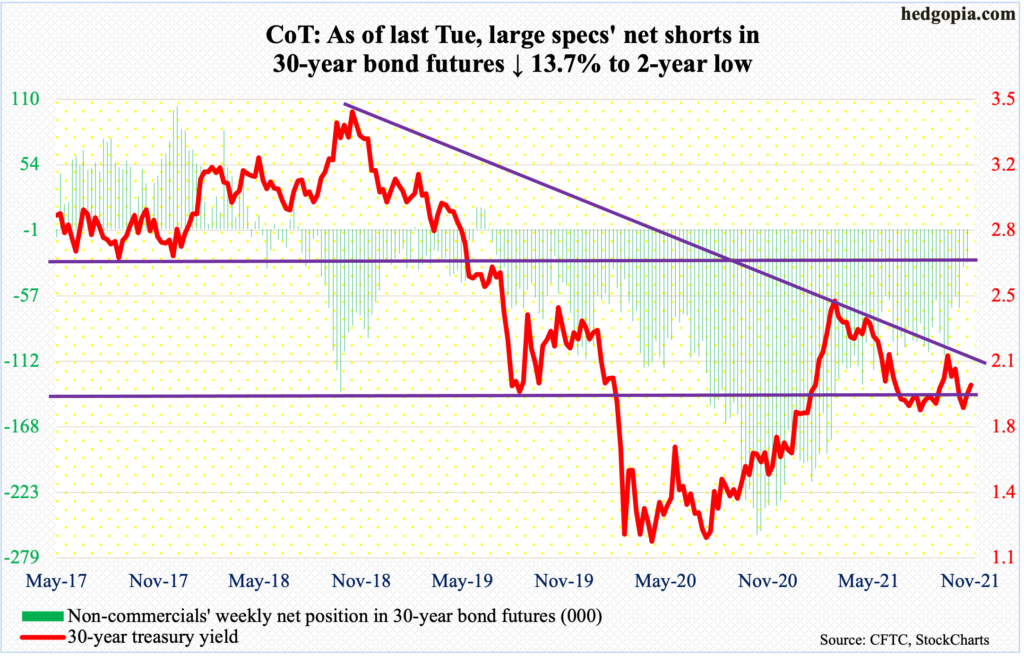
30-year bond: Currently net short 28.1k, down 4.5k.
Major economic releases for rest of this week are as follows.
Retail sales (October), industrial production (October), the NAHB Housing Market Index (November) and Treasury International Capital data (September) will be published today.
Retail sales in September rose 0.7 percent month-over-month to a seasonally adjusted annual rate of $625.4 billion. The record high $628.8 billion was hit in April this year; a year before that, the post-pandemic low of $409.8 billion was recorded.
US capacity utilization declined 1.3 percent m/m in September to 75.2 percent. The post-pandemic high of 76.3 percent was reached in July this year.
In October, homebuilder confidence increased four points m/m to 80. Last November, the index peaked at 90, which incidentally was three times the post-pandemic low of 30 reached in April last year.
In the 12 months to August, foreigners purchased $243.8 billion in US stocks. This is still very healthy but lower than March’s record $405.5 billion. Momentum is slowing.
Housing starts (October) are due out on Wednesday. Starts fell 1.6 percent m/m to 1.56 million units (SAAR) – a five-month low.
WTI crude oil: Currently net long 448.9k, up 14.1k.
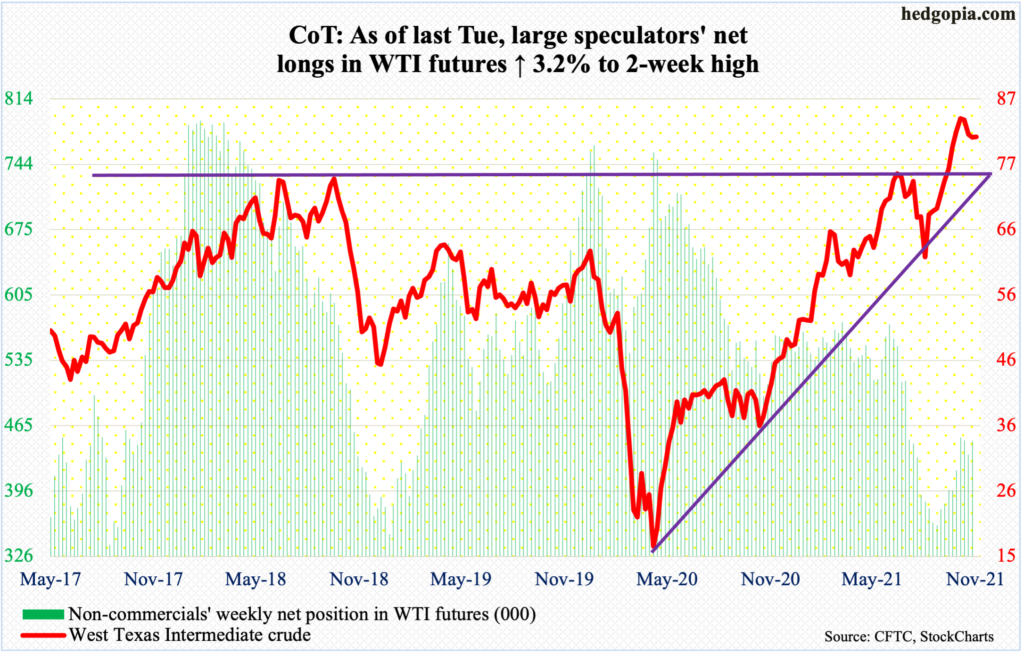
Last Wednesday, WTI ($80.88/barrel) tested its recent high of $85.41 from October 25 but only to reverse sharply lower after tagging $84.97. By the end of the week, it had lost both its 10- and 20-day.
The peak three weeks ago was registered in a spinning top week, with last week forming a gravestone doji. As recently as August 23, WTI bottomed at $61.74. Both the weekly and monthly are grossly overbought. There is room for the black gold to continue lower.
E-mini S&P 500: Currently net long 97.6k, down 27.9k.
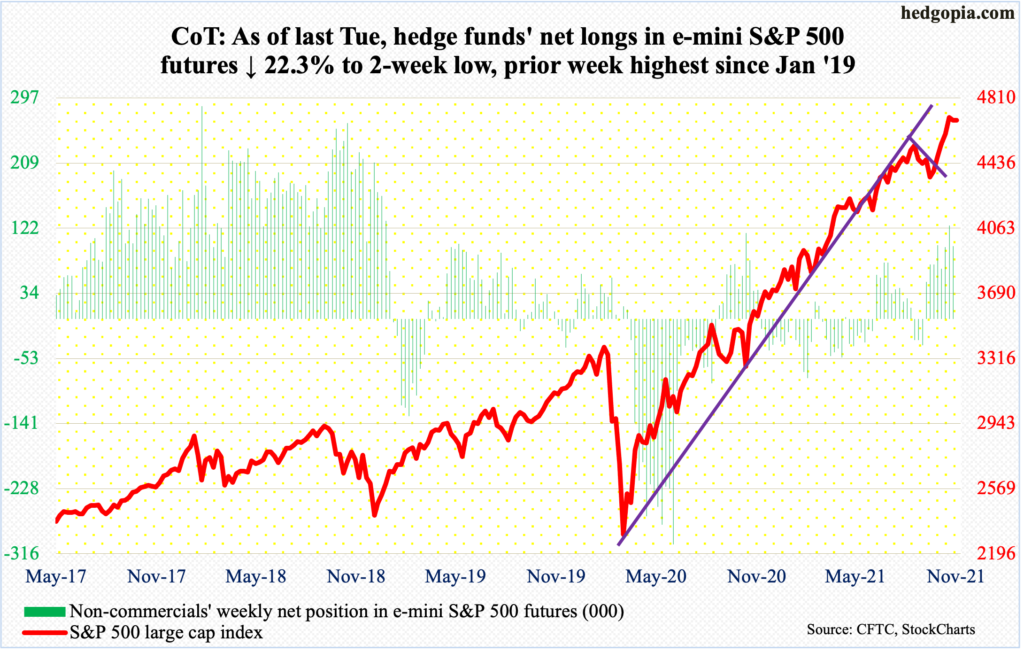
For the first time in six weeks, the S&P 500 suffered a negative week last week, but once again bulls let it be known that they are not going to give up that easy. At Wednesday’s low of 4631, the large cap index was down as much as 1.9 percent for the week but rallied to end it down 0.3 percent.
On the 5th this month, when the index (4683) posted its all-time high of 4719, a spinning top formed, followed by a doji in the very next session. These candles have appeared after the S&P 500 rallied north of 10 percent in a month.
With that said, momentum is yet to crack. After straddling the 10-day for a couple of sessions, bulls wrestled it back last Friday. Both the 10-and 20-day are still rising; they need to at least flatten out for the bears to begin to get some traction, which in all probability is in the process of unfolding.
Euro: Currently net long 3.8k, up 9.9k.
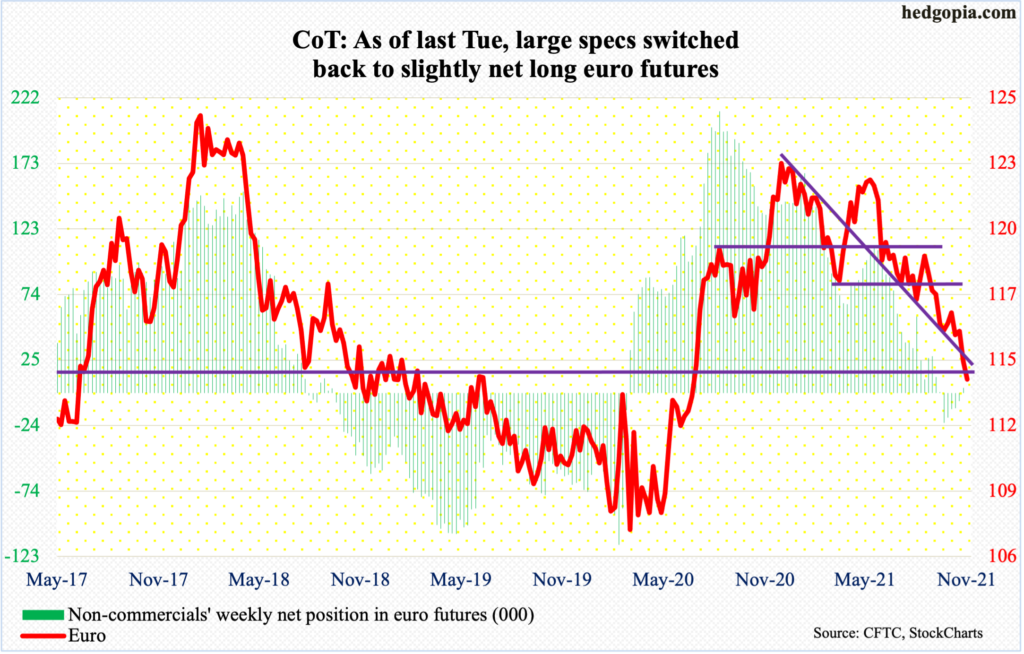
The euro is hanging by a thread. Last Wednesday, it pierced through straight-line support at $1.1530s. Bulls could still salvage this thing by not losing $1.14. There is strong support at $1.14-$1.15.
On Monday, the currency, in a downtrend since peaking at $1.2345 in January this year, lost another 0.7 percent to close at $1.1371.
The daily is getting oversold. The euro is still caught in a downtrend. In the event of a rally near term, what happens around $1.1530s will be telling.
Gold: Currently net long 250.2k, up 35.1k.
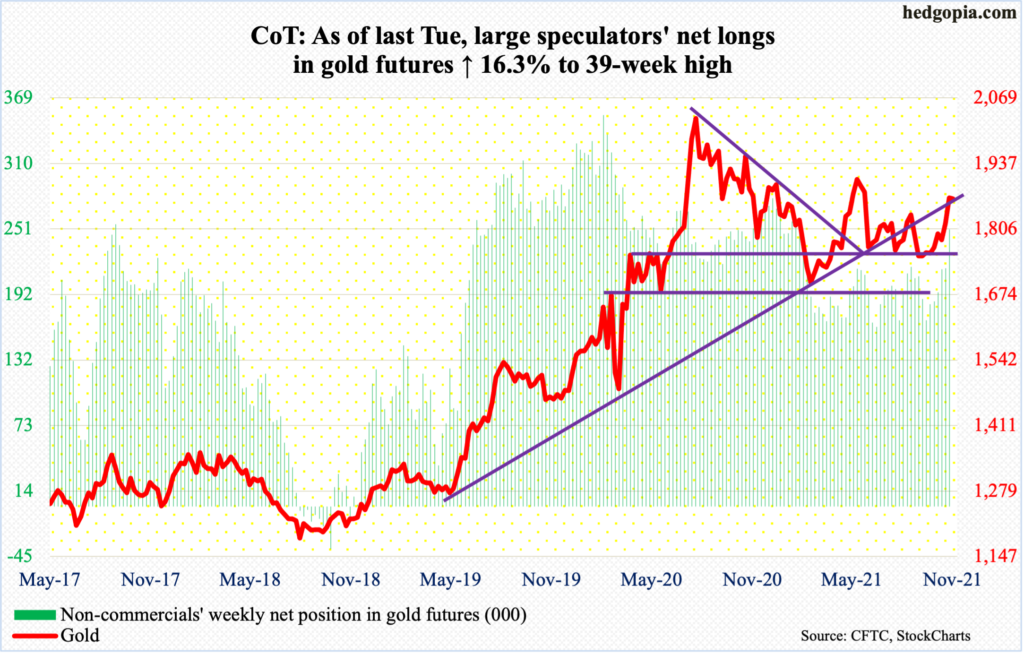
Gold ($1,867/ounce) last week rallied 2.9 percent to break through a falling trendline from August last year when it peaked at $2,089. Concurrently, on the monthly, the RSI turned back up from just above the median.
Back in September 2011, the yellow metal peaked at $1,924. The subsequent drop bottomed at $1,045 in December 2015. In the one year through June this year, gold hesitated around $1,920s several times. Bulls would love to have another go at it. They have a shot at it, should $1,830s hold.
Nasdaq 100 index (mini): Currently net long 16.2k, up 9k.
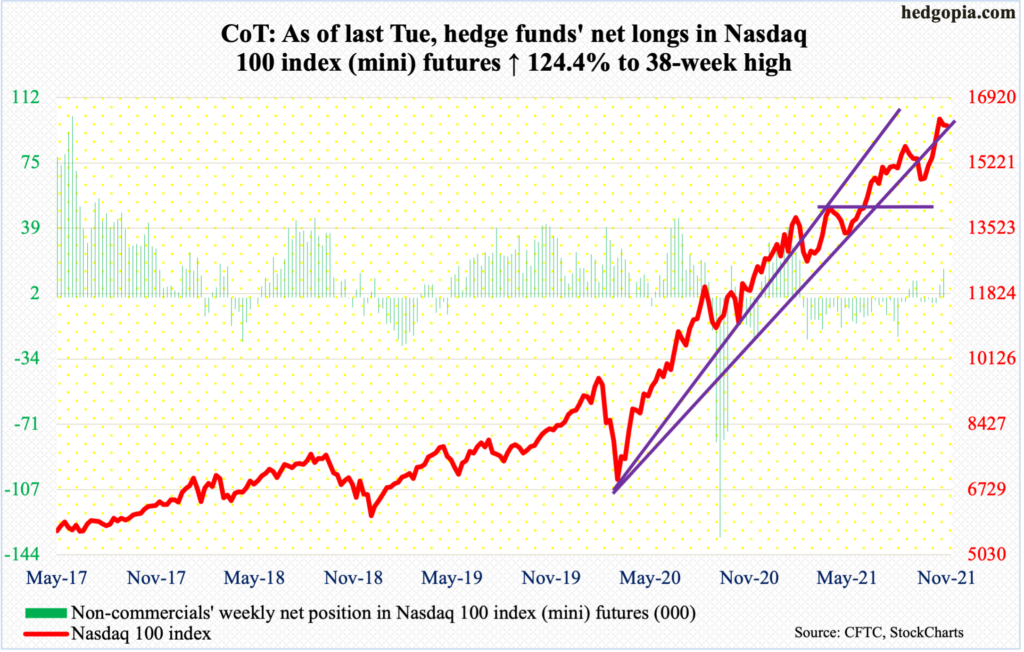
After five up weeks, last week produced a potentially bearish hanging man. It needs confirmation, so this week’s action is important.
Last Wednesday, the Nasdaq 100 (16189) dropped as low as 15905 before drawing bids. The tech-heavy index has horizontal support at 15700s, and 15100s after that.
Russell 2000 mini-index: Currently net short 24.5k, down 13.7k.
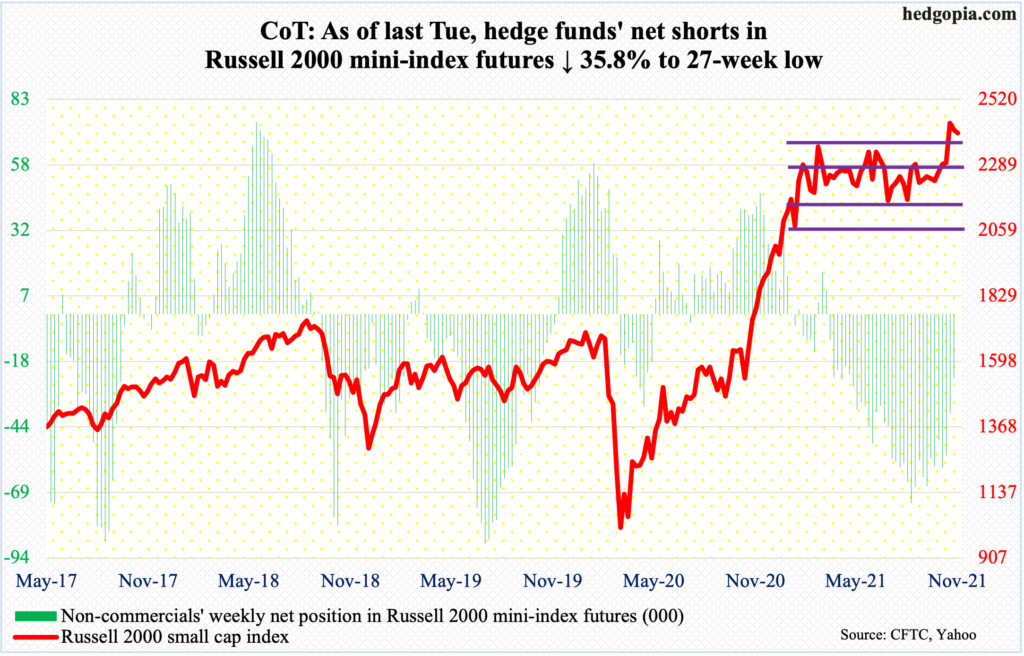
The Russell 2000 began November with a strong rally, ending right on the top end of an eight-month rectangle. Two sessions later, it had another strong session, decisively breaking out. If it is a genuine breakout, technicians would in due course be eyeing 2600.
Since March, the small cap index (2401) has been rangebound between 2350s and 2080s, and between 2280s and 2150s within this box.
On Monday last week, momentum continued early on posting a fresh high 2459, but only to see it falter to end the session with a shooting star. In due course a breakout retest at 2350s is likely in the cards, and that will help shed light on the nature of the breakout.
US Dollar Index: Currently net long 35.4k, up 466.
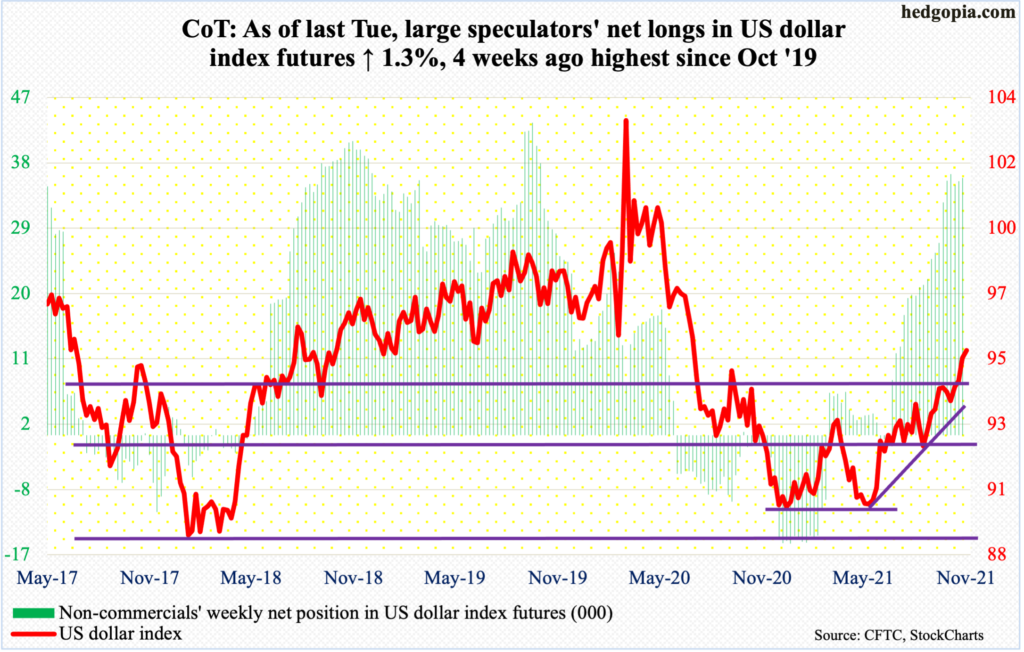
After six weeks of trying to break out of 94.50s, the US dollar index (95.40) finally succeeded last week.
In late October, as dollar bulls defended the 50-day, they also defended the lower end of a rising six-month channel. There is still room before the top end is tested.
VIX: Currently net short 79.9k, down 23.4k.
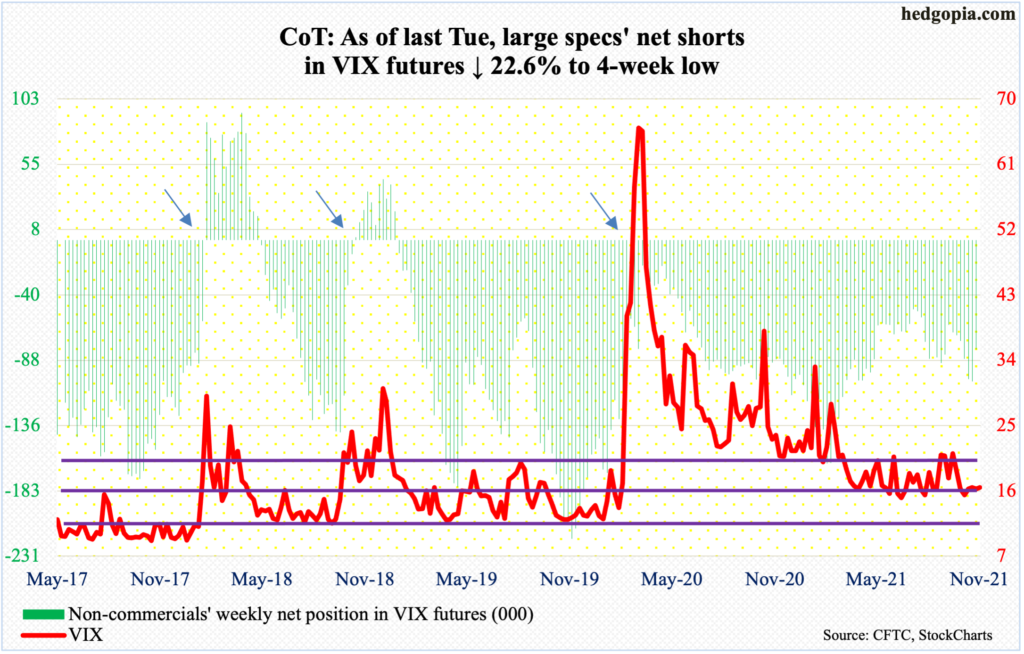
Last Wednesday, VIX (16.49) rallied to 19.90 intraday to just about test 20. Four sessions before that, the volatility index tagged 14.73 before rallying. But the upward momentum soon ran out of steam, ending the week with a 16 handle.
In a worse-case scenario for volatility bulls, there is decent support at 15, or just south of it.
Thanks for reading!

