
Following futures positions of non-commercials are as of December 28, 2021.
10-year note: Currently net short 213.3k, down 126k.

FOMC minutes for the December 14-15 meeting come out on Wednesday. This was a meeting in which markets essentially forced the Fed’s hands. Leading up to that, futures traders were betting the central bank would end up raising the fed funds rate three times in 25-basis-point increments in the second half this year. Rates are currently zero-bound.
The Fed was nowhere near as hawkish. Then, in the last meeting, it made a U-turn. Not only did it aggressively dial back its bond buying but projected three rate hikes this year. Beginning this month, it plans to cut back the monthly buying to $60 billion; until recently, it had been buying $120 billion in treasury notes and bonds plus mortgage-backed securities every month. From early March 2020, its balance sheet more than doubled to $8.8 trillion.
Once the bond-buying program unwinds late winter or early spring, the Fed plans to raise interest rates three times this year and two more each in 2023 and 2024.
Accordingly, the two-year treasury yield, which tends to be the most sensitive to the Fed’s interest rate outlook, closed last week at 0.73 percent, up from mid-teens as recently as last August; yesterday, it rose further to 0.78 percent. The 10-year, however, is only up slightly during the period, although it jumped 12 basis points on Monday to 1.63 percent. The yield curve increasingly seems to be doubting the Fed’s hiking plans for 2023 and 2024, fearing it will be too restrictive.
30-year bond: Currently net short 20k, down 16.1k.

Major economic releases for rest of the week are as follows.
Later this morning, the ISM manufacturing index (December) and job openings (JOLTs, November) come out.
Manufacturing activity in November inched up three-tenths of a percentage point to 61.1 percent. The index has been north of 60 percent in eight of the last 10 months.
Non-farm job openings increased 431,000 month-over-month in October to 11 million, just slightly under July’s record 11.1 million.
Thursday brings the ISM non-manufacturing index (December) and durable goods orders (November, revised).
In November, services activity jumped 2.4 percentage points to 69.1 percent. Activity has persisted north of 60 percent in the last nine months.
Preliminarily in November, orders for non-defense capital goods ex-aircraft – proxy for business plans for capital expenditures – fell 0.1 percent from October’s record $78.9 billion (seasonally adjusted annual rate).
Non-farm payrolls (December) are scheduled for Friday. November produced weaker-than-expected 210,000 jobs, to 148.6 million, which is now merely 3.9 million from the record 152.5 million posted in February 2020. From April that year, the economy has created 18.5 million jobs.
WTI crude oil: Currently net long 375.5k, up 3.5k.
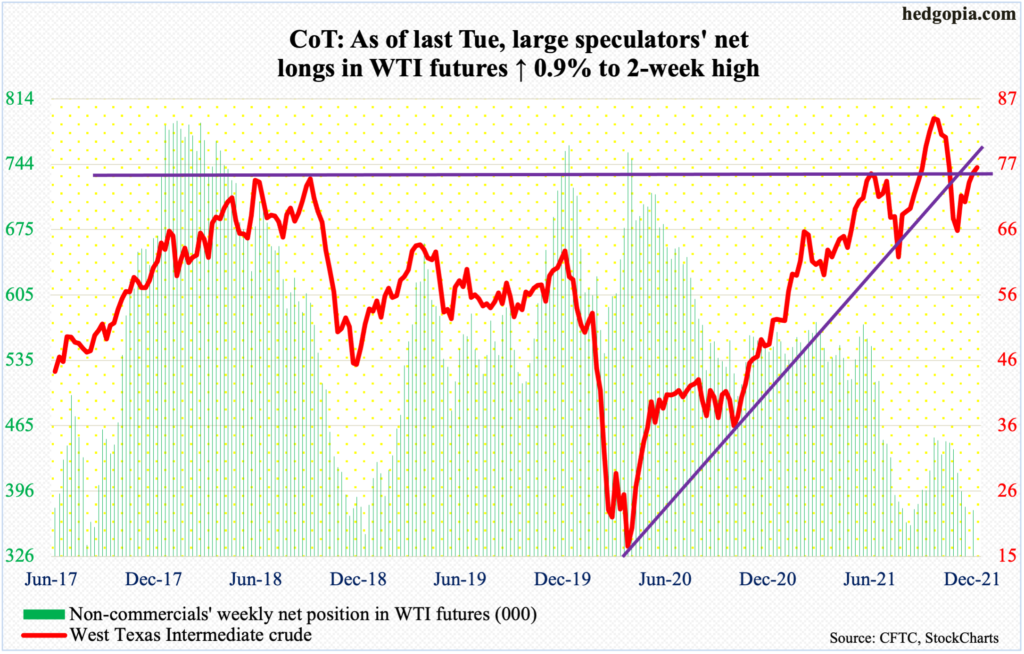
WTI tried to reclaim the 50-day moving average nearly all of last week but to no avail; Thursday’s high of $77.44 was also rejected at horizontal resistance at $76-$77, which goes back 15 years. Earlier on the 20th (last month), the crude bottomed at $66.12, before rallying for seven straight sessions.
The daily is overbought and could weaken here. Immediately ahead, there is support at $73-$74. Bulls are not giving up just yet, having rallied the crude ($76.08/barrel) 1.2 percent on Monday to close right on the 50-day.
E-mini S&P 500: Currently net long 103.3k, down 33.1k.

Last Monday, the S&P 500 broke out of an eight-week congestion. By Thursday, it ticked 4809, but bulls failed to hang on to all of the gains, with the week ending at 4766. Using a measured-move approach, the technically-oriented ones probably hope to hit 4900 in due course.
Bulls began 2022 with a 0.6-percent rally on Monday to close at 4797. For six sessions now, the large cap index has closed around 4800. As things stand, so long as breakout retest at 4740s holds, bulls deserve the benefit of the doubt.
Euro: Currently net short 6.6k, down 3.5k.
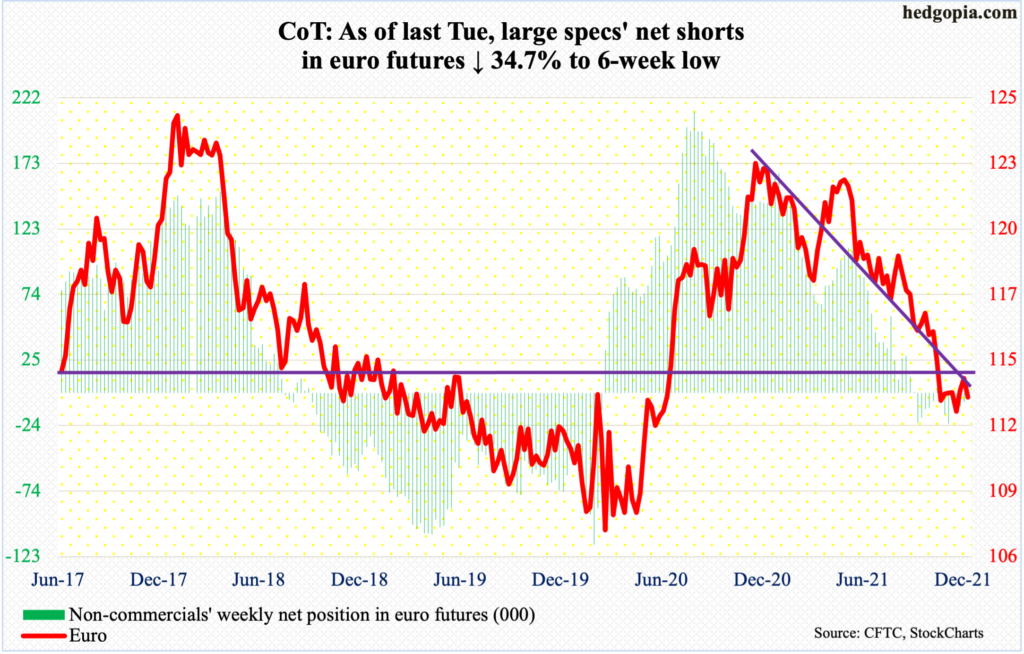
The euro ($1.1296) last Friday broke out of a five-week ascending triangle but was pushed right back into it yesterday. Earlier on November 24, it put in a low of $1.1186, having dropped from $1.2345 last January.
There is resistance at $1.14-$1.15, which goes back at least 18 years. Medium- to long-term, this hurdle is likely to give way. Near-term, the daily is overbought. The currency retreated after tagging $1.1377 last Friday.
Gold: Currently net long 213.2k, up 7.3k.
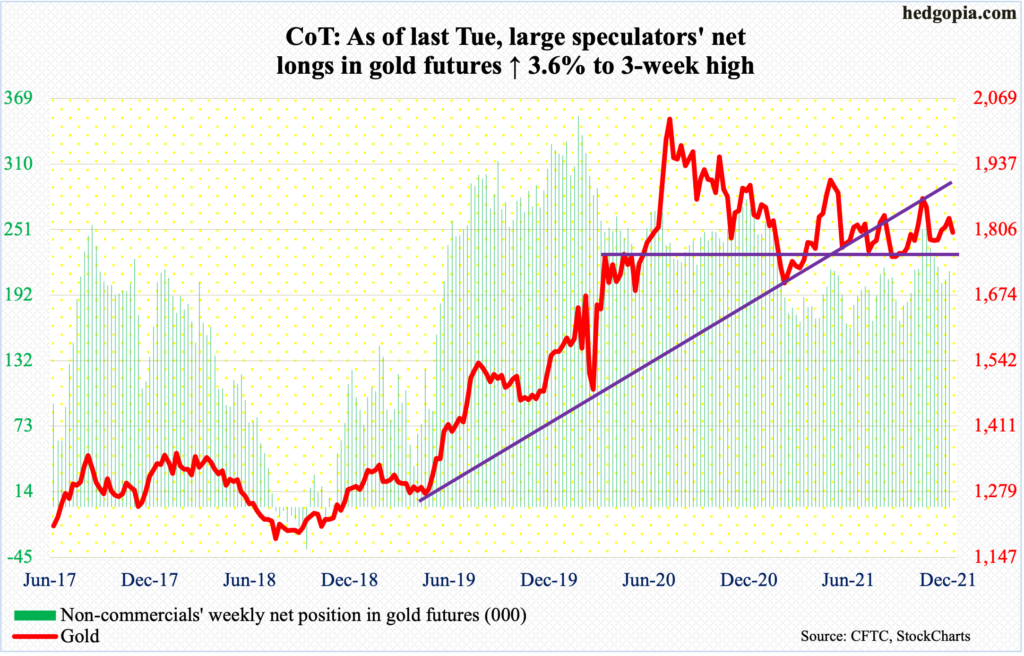
Last week, gold ($1,800/ounce) peeked its head out of a falling trend line from August 2020; back then, it peaked at record $2,089.
Last Friday’s high of $1,831 was the highest since November 22; this was surpassed by yesterday’s intraday high of $1,833 but gold bugs were unable to hold on to the gains, with the metal ending the session down 1.6 percent. Horizontal resistance at $1,830s goes back more than a year. This raises the odds of more downward pressure near term. There is crucial support at $1,760s-$1,770s.
Nasdaq 100 index (mini): Currently net long 14.1k, down 11.3k.

December produced a monthly dragonfly doji. This followed a monthly shooting star in November. Bulls and bears are really fighting it out.
This was also evident last week when at Tuesday’s high the Nasdaq 100 was merely 0.9 percent from its all-time high of 16765 from November 22 and was up 1.8 percent for the week, but when it was all said and done it only edged up 0.1 percent, for a shooting star week.
The consolation for tech bulls is that several times last month straight-line support at 15700s was defended. At 16502, the index remains well above this.
Russell 2000 mini-index: Currently net short 20.3k, up 8.1k.

Range resistance at 2280s was just about tested last Tuesday as the Russell 2000 touched 2275 intraday before weakening. Come Monday, small-cap bulls once again went after this roadblock, rallying the index as high as 2284, closing at 2273.
Since March last year, the small cap index has played ping pong between 2350s and 2080s, and between 2280s and 2150s within this. On Nov 3, it broke out but was quickly followed by a failed retest on the 19th.
A decisive break of 2280s raises the possibility of upward pressure toward 2350s.
US Dollar Index: Currently net long 36.8k, up 1.7k.
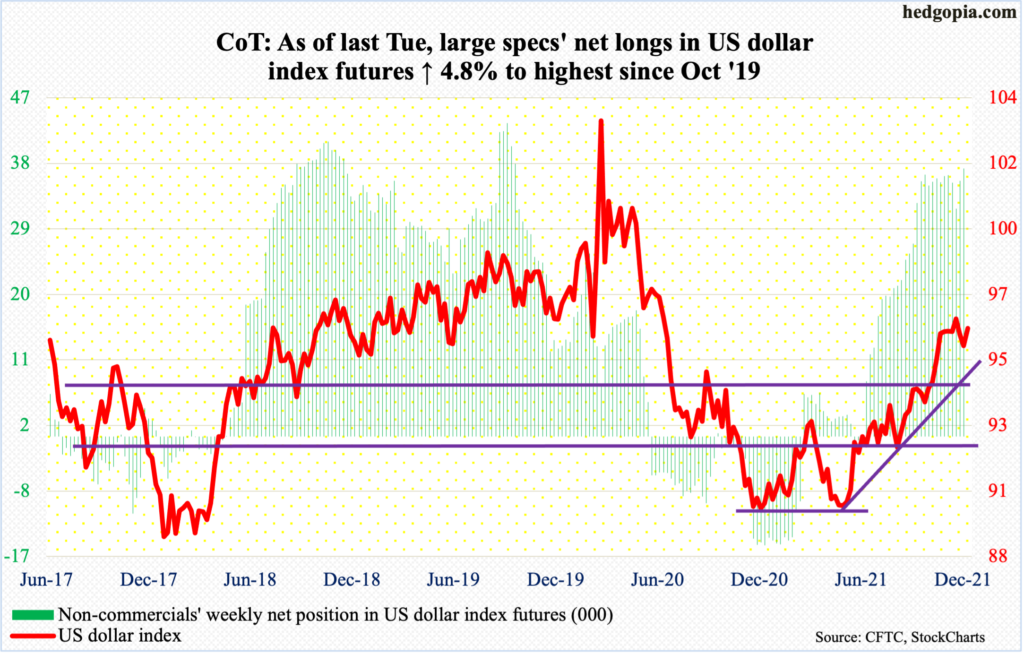
Straight-line support at 95.80s was breached last Friday but only for dollar bulls to regroup and reclaim the level yesterday. Before this, the US dollar index (96.21) closed around 96 in five of the prior six weeks.
Earlier, it rallied from last May’s 89.51 to 96.94 posted on November 24. Horizontal resistance around 97 goes back at least 18 years.
From November’s high, the index has posted lower highs. The 50-day lies at 95.51 and was not breached during the recent downward pressure. Decent support also rests at 94.50s, which is a combination of a multi-year straight line and a rising trend line from May.
VIX: Currently net short 47.2k, up 15.6k.

In a long-legged doji session last Thursday, VIX touched 16.62 intraday; this was a six-week low and was slightly breached yesterday as the volatility index ticked 16.56 before closing at 16.60.
VIX has breached a rising trend line from early November (last year), but trend-line support from November 2017 when it reached an all-time low of 8.56 is intact. This gets tested around 15. For volatility bulls, this is the risk near term, but at the same time the support is unlikely to yield.
Thanks for reading!
