
Following futures positions of non-commercials are as of January 11, 2022.
10-year note: Currently net short 343.8k, up 66.9k.
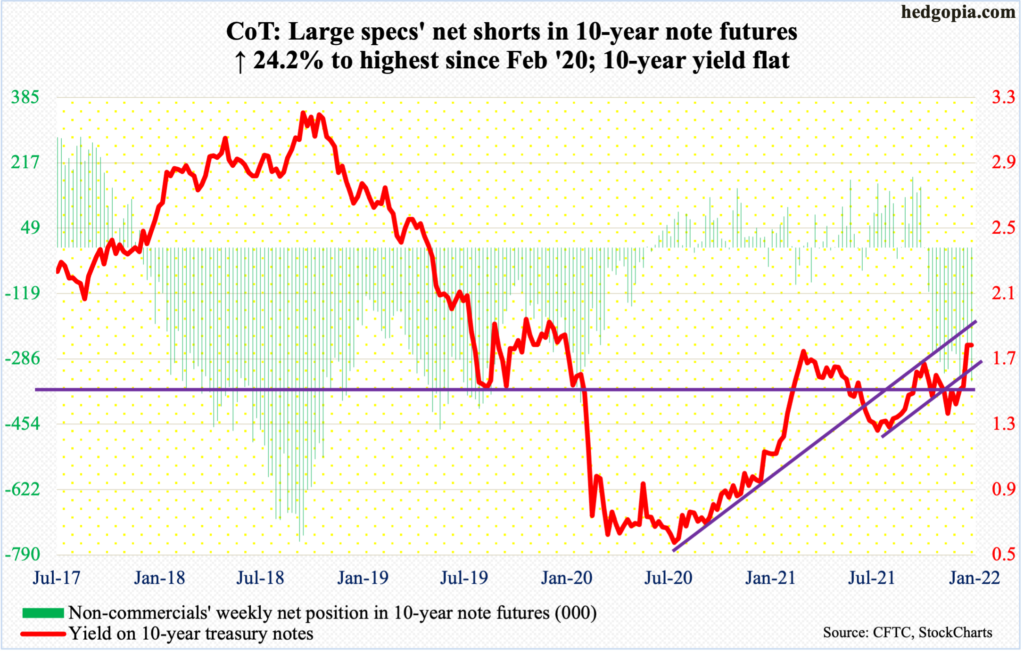
Last week, the 10-year treasury yield closed right at 1.77 percent, which was the high from last March. Since that peak, rates dropped all the way to 1.13 percent in July before trending higher. Thus, a decisive breakout at 1.77 percent has the potential to self-fulfill, potentially leading to a hurried rally toward two percent.
This week, the 10-year was unchanged at 1.77 percent but touched 1.81 percent intraday Monday before giving back the gains, leaving behind a candle with a long upper shadow. Intraday Friday, these notes were yielding 1.71 percent and that drew bond bears (on price).
At 1.69 percent lies decent straight-line support. Bond bulls’ morale will get a boost once this level gives away, which in due course could open the door toward major horizontal support at mid-1.40s; just underneath at 1.40 percent lies rising trend-line support from August 2020.
Right here and now, it is shorts’ ball to lose.
Amidst this, non-commercials’ net shorts in 10-year note futures are the highest since February 2020. They have been right directionally. But at some point this gets unwound – either from around the current level or even higher – and that is when rates will face stiff resistance.
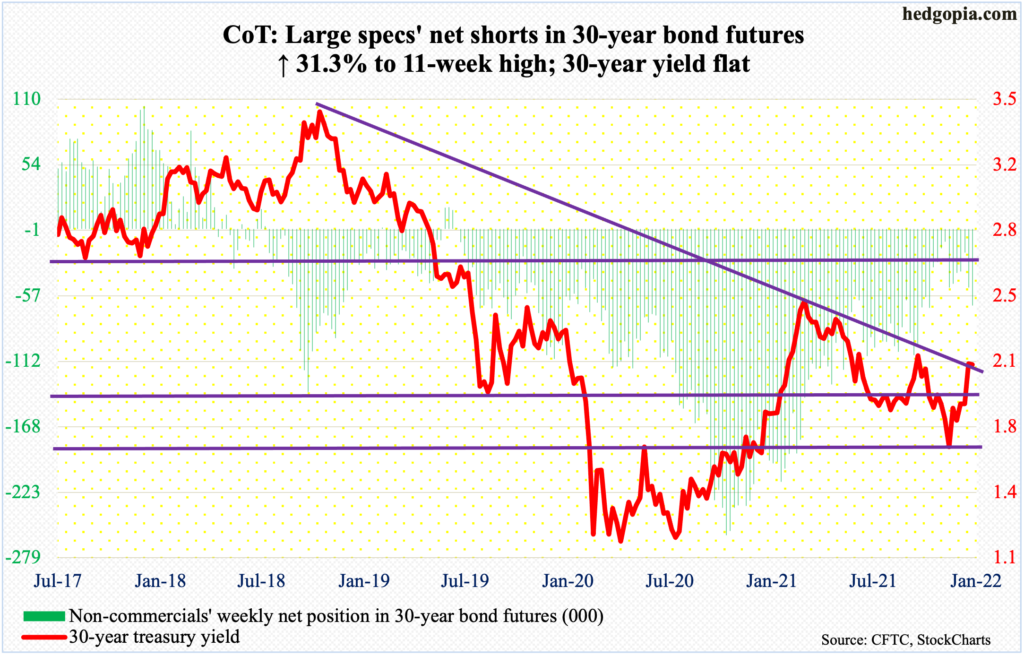
30-year bond: Currently net short 65k, up 15.5k.
Major economic releases for next week are as follows. Markets are closed Monday for observance of Martin Luther King, Jr. Day.
The NAHB housing market index (January) and Treasury International Capital (November) are due out on Tuesday.
Homebuilder optimism edged up a point month-over-month in December to 84. The metric peaked at 90 in November 2020, which was three times the post-pandemic low of 30 posted in April that year.
In the 12 months to October, foreigners purchased $149.6 billion in US stocks, which represents a substantial deceleration from the record pace of $405.5 billion registered last March.
Housing starts (December) will be published on Wednesday. Starts jumped 11.8 percent m/m in November to a seasonally adjusted annual rate of 1.68 million units – an eight-month high.
Thursday brings existing home sales (December). Sales increased 1.9 percent m/m to 6.46 million units (SAAR) – a 10-month high.
WTI crude oil: Currently net long 379.8k, up 12.8k.
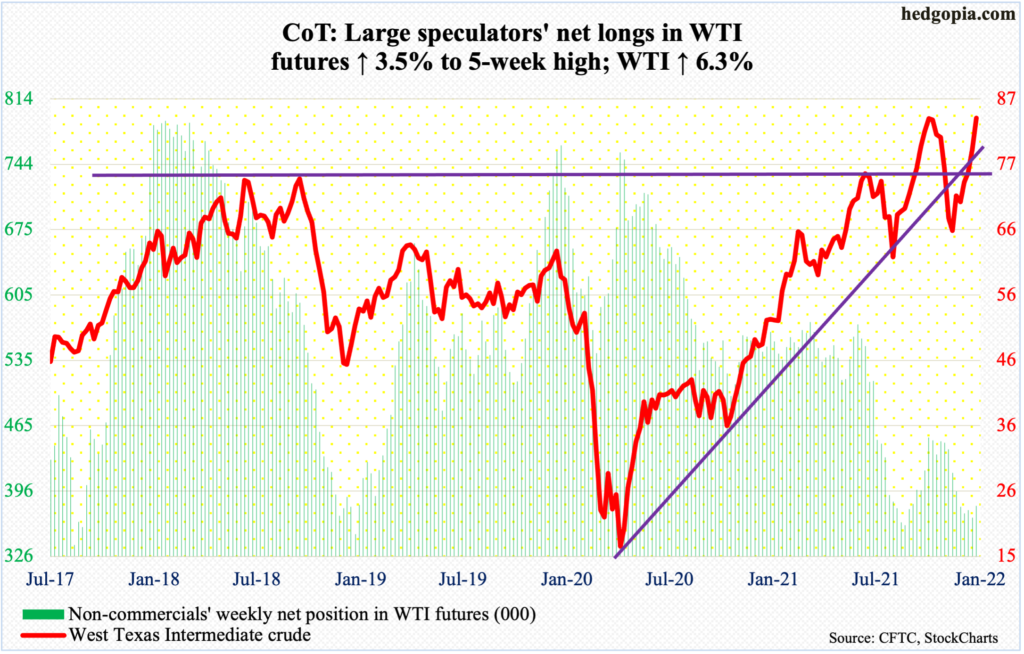
Between October 25 and December 2 last year, WTI ($83.82/barrel) declined from $85.41 to $62.43. A 78.6-percent Fibonacci retracement amounts to $80.49. On both Thursday and Friday last week, the crude hesitated around this level, but broke free this Tuesday, rallying as high as $84.45 on Friday.
There is resistance at $85, with the crude having ticked $85.41 on October 25, which was a seven-year high. As WTI sits just underneath this, the daily has been pushed into gross overbought territory, but momentum is yet to break.
In the meantime, as per the EIA, US crude production in the week to January 7 dropped 100,000 barrels per day week-over-week to 11.7 million b/d. Crude stocks fell as well, down 4.6 million barrels to 413.3 million barrels. Stocks of gasoline and distillates, however, rose – up eight million barrels and 2.5 million barrels to 240.7 million barrels and 129.4 million barrels, in that order. Crude imports increased as well, rising 185,000 b/d to 6.1 mb/d. Refinery utilization declined 1.4 percentage points to 88.4 percent.
E-mini S&P 500: Currently net long 77.4k, down 31.6k.
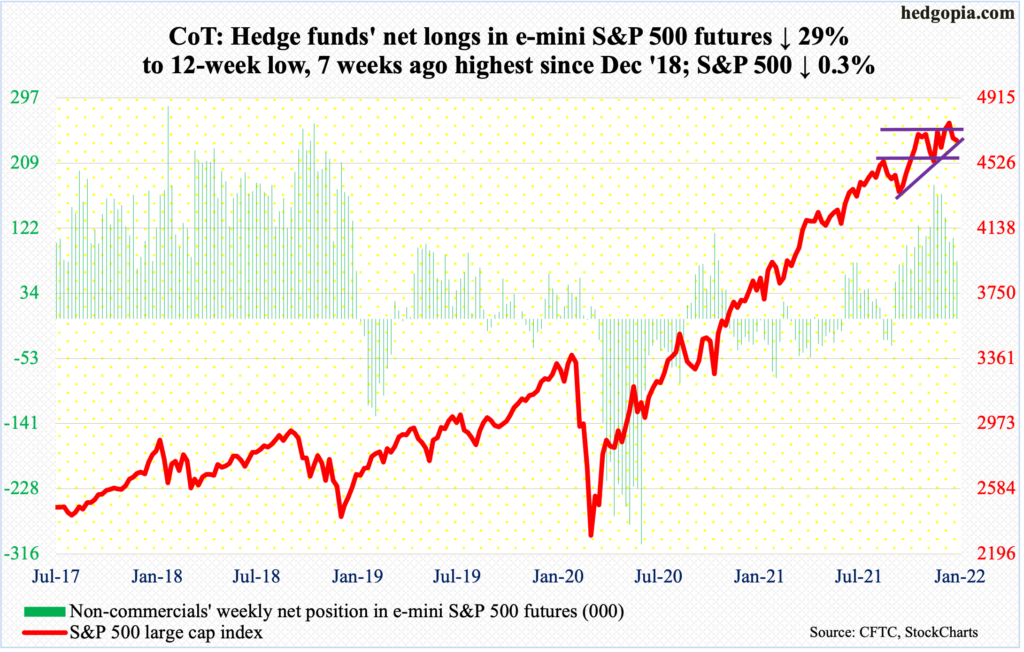
On December 27, the S&P 500 surpassed the prior high of 4740s from November 22. The breakout proved fleeting, as the large cap index ticked 4819 on January 4 before reversing lower. By the 10th, it was down 4.9 percent from the high. The rally that followed was quick but stopped right at 4740s on both Thursday and Friday (this week).
In the week to Wednesday, SPY (SPDR S&P 500 ETF), VOO (Vanguard S&P 500 ETF) and IVV (iShares Core S&P 500 ETF) lost $2.3 billon. This followed a six-week haul of $30.5 billion (courtesy of ETF.com). Elsewhere, money continued to move into US-based equity funds, drawing $9.9 billion in the week to Wednesday, for a four-week take of $56.2 billion (courtesy of Lipper). This is too good of a flow to continue at the current pace.
This is coming at a time when short interest on SPY (S&P 500 ETF) dropped to a 22 ½-month low at the end of December (chart here). Bulls got plenty of help from short squeeze, and that fuel is running dry.
The 4Q21 earnings season got underway this week. Ahead of this, non-commercials have been reducing their net longs, which were at a 12-week low. Concurrently, longs’ willingness to buy the dip was evident in three of the five sessions this week. Their nearest test lies at 4540s. The S&P 500 closed out the week at 4663.
Euro: Currently net long 6k, up 7.6k.
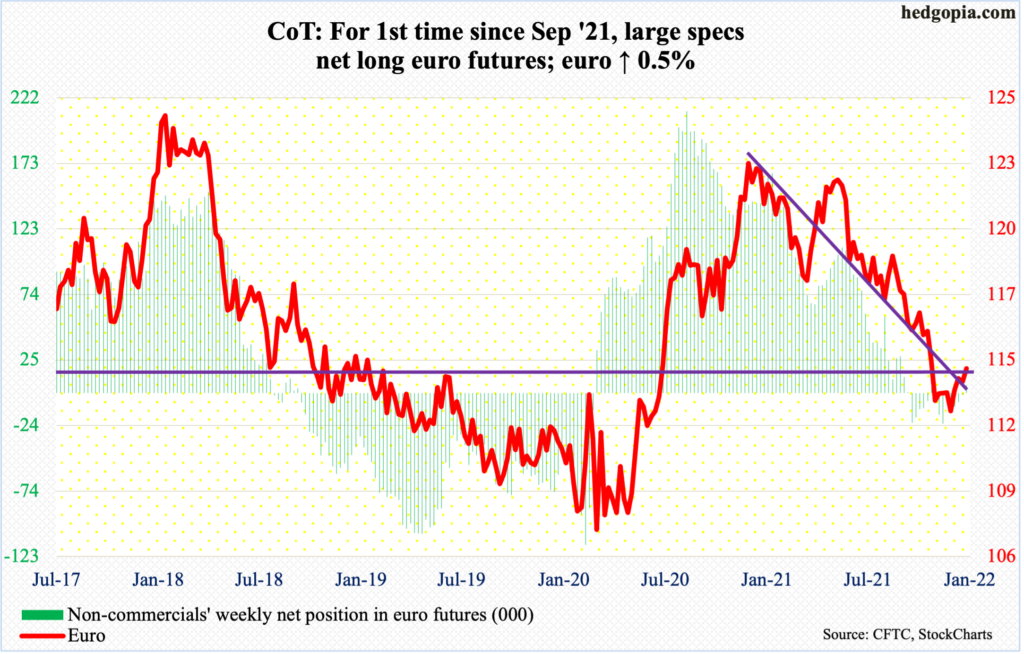
After trying for seven weeks, euro bulls finally reclaimed $1.14, which goes back at least 18 years. Tuesday’s reclaiming of the 50-day was followed by a 0.6-percent rally on Wednesday, which also helped pushed the euro ($1.1415) past a falling trend line from last May.
On the weekly, the MACD just completed a potentially bullish crossover. The next level of resistance lies just north of $1.15. On Thursday, the currency ticked $1.1482 before reversing lower.
The daily is overbought and likely comes under pressure near term. Worse, a rising trend line from November 24 gets tested at $1.13.
Non-commercials are getting ready for a rally. For the first time since last September, they went net long this week.
Gold: Currently net long 199.7k, down 11.6k.
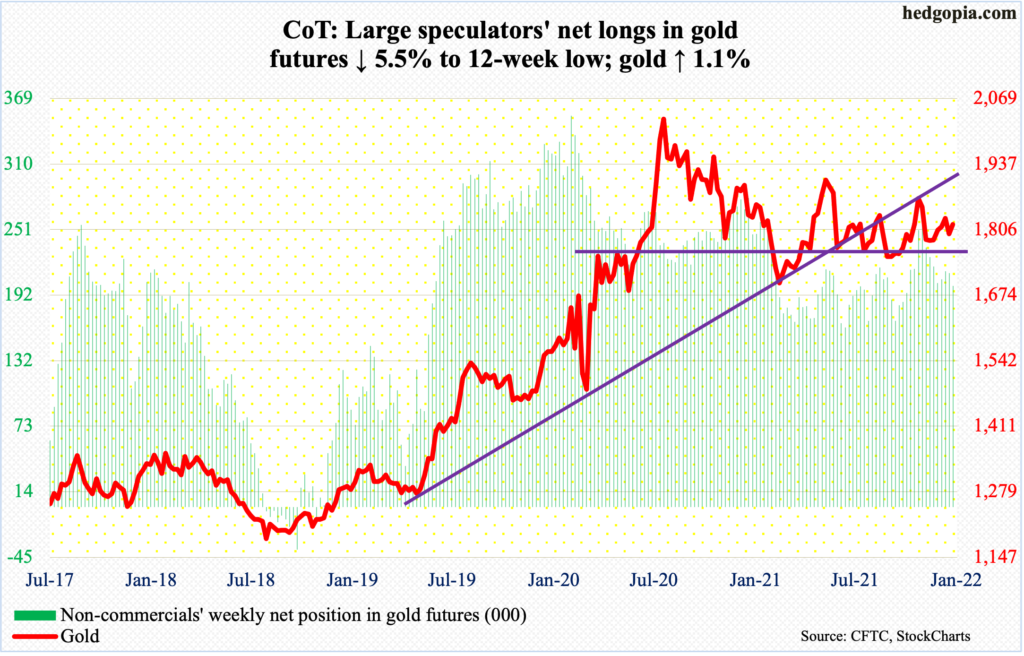
Horizontal resistance at $1,830s, which goes back more than a year, was just about tested on Wednesday through Friday, but no breakout resulted.
A takeout of this roadblock opens the door toward $1,870s, which, should it give way, will firmly establish a pattern of higher highs, higher lows. Both this week and last, a rising trend line from last August was defended.
But for momentum to continue, gold ($1,816/ounce) needs to retake $1,830s.
Nasdaq 100 index (mini): Currently net long 21.3k, down 454.
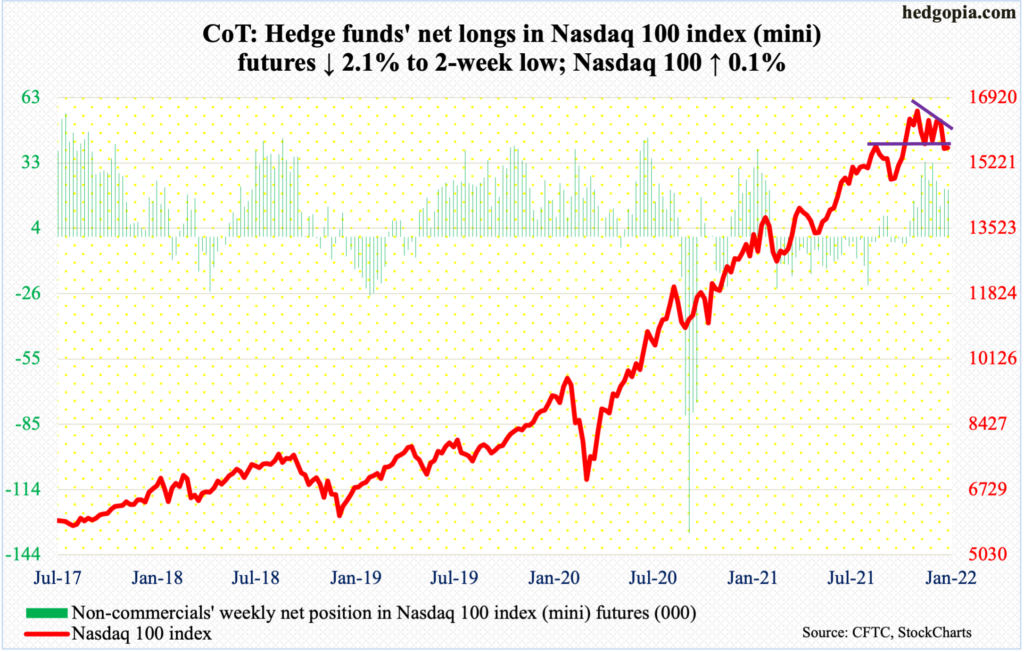
Bulls and bears actively fought over control of 15700s. After ending last week slightly under the horizontal support, bulls reclaimed it this Tuesday but only for bears to push it back down on Thursday.
Incidentally, on the Nasdaq Composite, bulls used Monday’s intraday drop below the 200-day as an opportunity to buy. On the Nasdaq 100, the average was not quite tested. Both indices remain under the 50-day, which is beginning to turn down.
Russell 2000 mini-index: Currently net short 5.4k, down 10.4k.
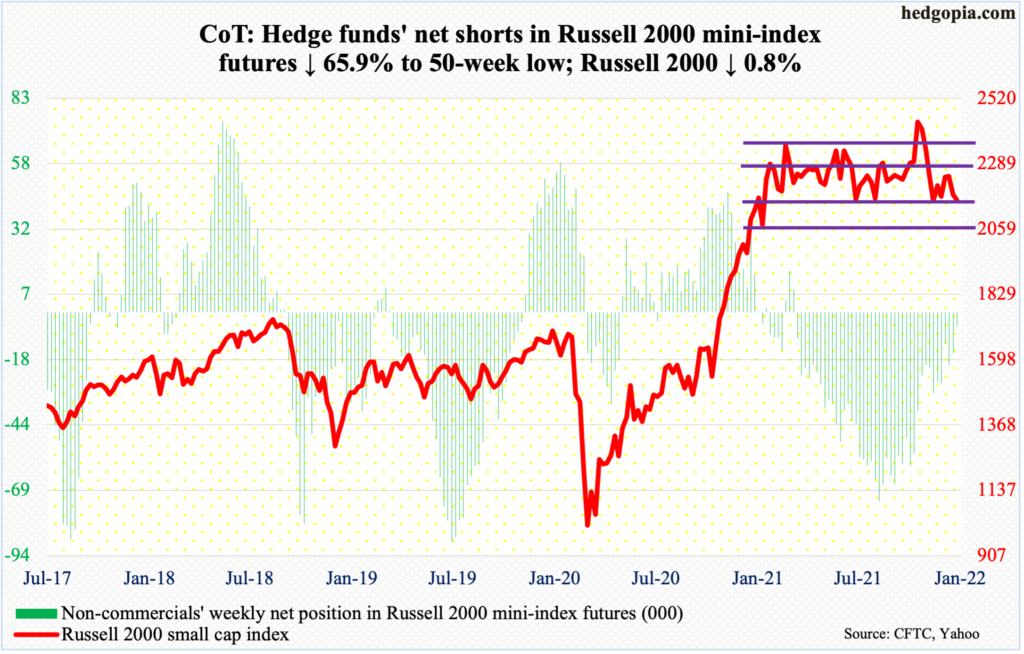
The week began with Monday’s 2.1-percent intraday selloff but the low of 2133 was bought, as was Friday’s low of 2126; the resulting hammer in both sessions showed up right at 2150s support.
Since March last year, the Russell 2000 has been rangebound between 2350s and 2080s, and between 2280s and 2150s within this rectangle. On Nov 3, it broke out but was quickly followed by a failed retest on the 19th.
Monday’s reversal was not followed by much of a follow-through. The small cap index rallied as high as 2210 on Tuesday, and that was it. The week closed lower 0.8 percent to 2162.
The way things are shaping up, odds favor a drop toward the lower range than a rally toward the upper.
US Dollar Index: Currently net long 37.9k, down 1.2k.
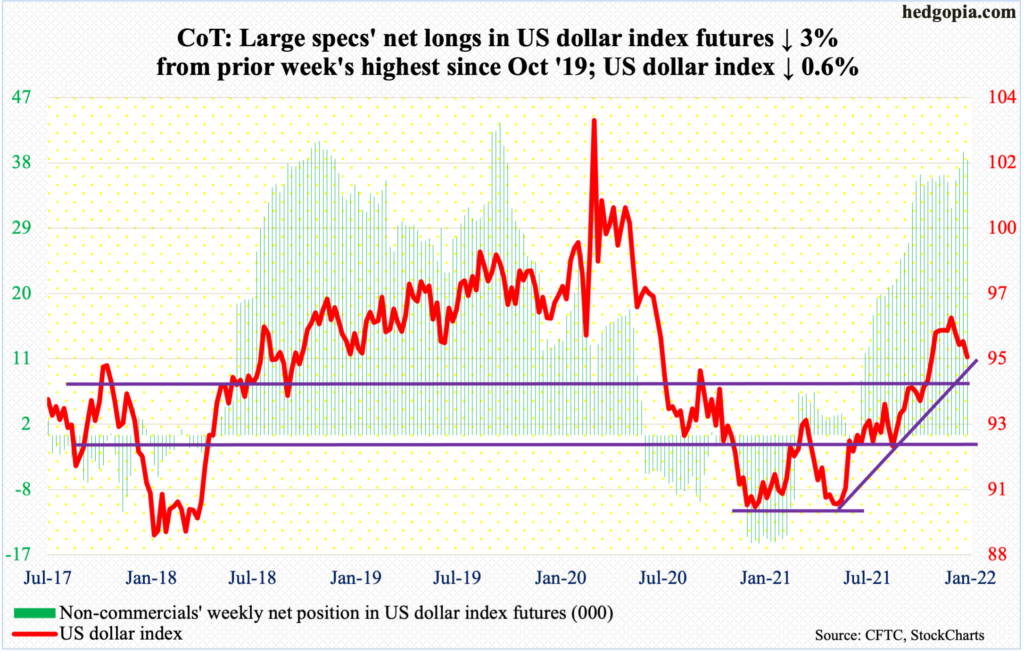
Last week, the US dollar index (95.16) closed a tad under 95.80s, which made up the straight-line support of a descending triangle. Frequently, such a pattern leads to a breakdown, which is how things evolved this week.
On Tuesday, the 50-day was compromised. Come Wednesday, the index shed 0.8 percent and 95.80s was left much further behind. If dollar bulls are looking for a solace, it is that support at 94.50s drew bids on both Thursday and Friday. Right here and now, it is a must-hold.
The daily is oversold and can rally near term.
Medium- to long-term, non-commercials remain heavily net long, unwinding of which can take a while to complete. This scenario is not music to the longs’ ears.
VIX: Currently net short 53.1k, down 7.3k.
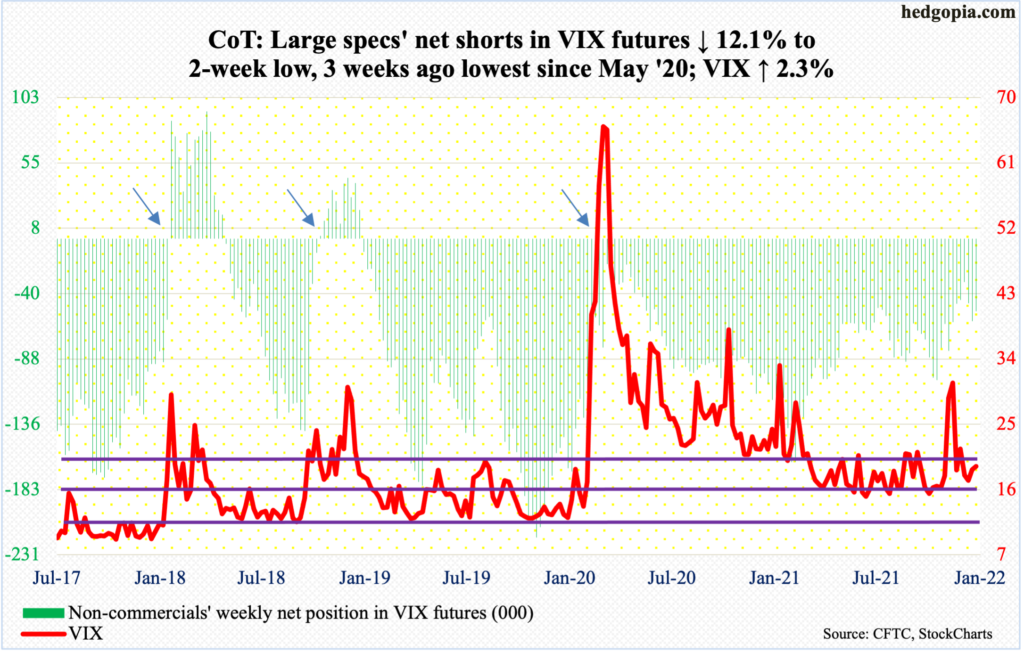
A rising trend line from November 2017 when VIX reached an all-time low of 8.56 is intact. This support gets tested around 15, with both December and January-to-date only managing a drop to the 16 handle.
On the daily, the MACD, which last week completed a bullish crossover, seems to want to continue higher. There is room for VIX (19.19) to rally on both the weekly and monthly.
Thanks for reading!
