
Following futures positions of non-commercials are as of April 5, 2022.
10-year note: Currently net short 362.9k, down 113.7k.
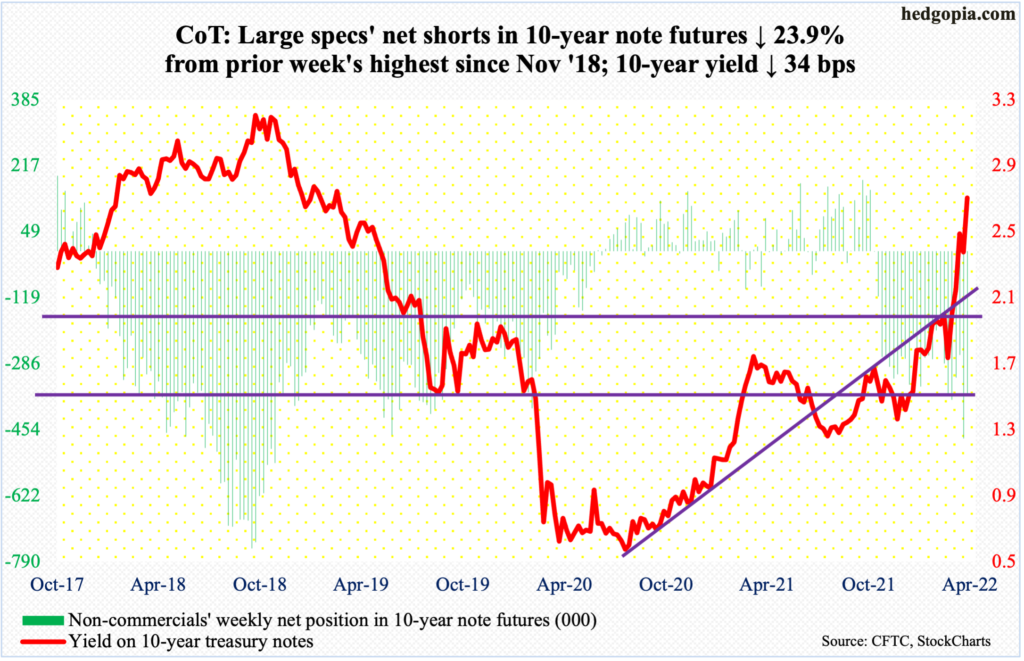
Minutes for the March 15-16 FOMC meeting, out Wednesday, revealed that the Federal Reserve plans to shrink its balance sheet by $95 billion a month, comprised of $60 billion in treasury securities and $35 billion in mortgage-backed securities (MBSs). This likely will begin in May; the next meeting is scheduled for 3-4 next month.
As of Wednesday, the Fed was sitting on $8.94 trillion in assets, just below the record high of $8.96 trillion two weeks ago. Of this, $4.93 trillion is in treasury notes and bonds, $2.71 trillion in MBSs and $326 billion in treasury bills. For perspective, in early March 2020, the balance sheet was $4.24 trillion strong, while there was $2.03 trillion in treasury notes and bonds, $1.37 trillion in MBSs and $303 billion in treasury bills.
Now that quantitative easing is giving way to quantitative tightening, it will be interesting to see how this will impact the long end of the treasury curve, which has firmed up quite a bit – probably in anticipation of this, among others. For instance, just since early December, the 10-year treasury yield has gone up from 1.34 percent to Friday’s intraday high of 2.73 percent.
Then, there is the fact that foreigners of late have been buying up treasury notes and bonds and that US deficit is narrowing, albeit from a very elevated level (more on this here). These dynamics will make it very tough to predict if long rates will rise or fall in the weeks and months ahead.
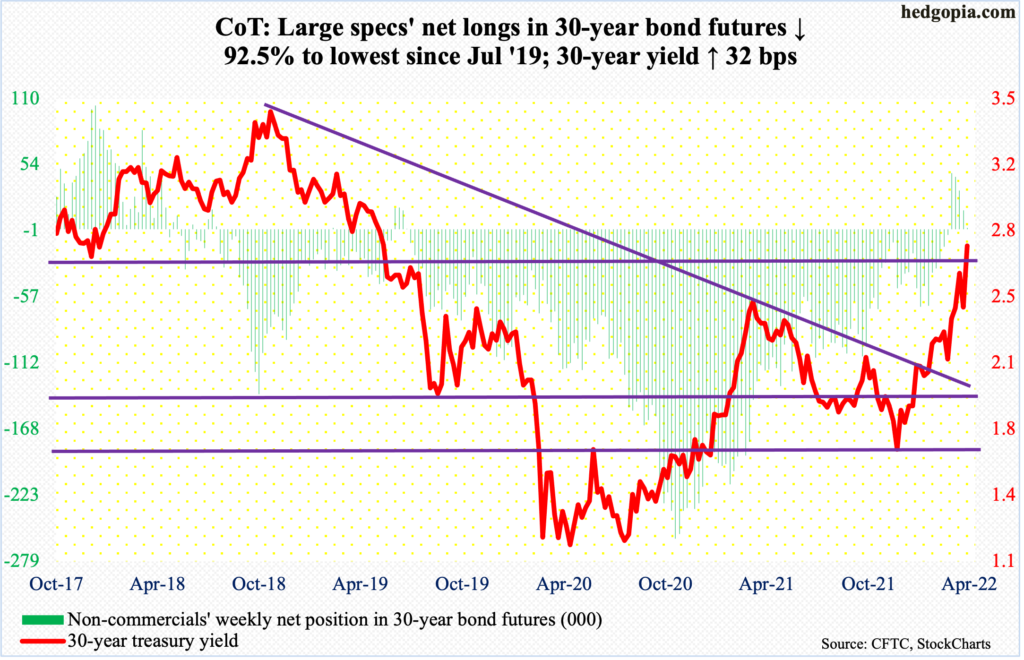
30-year bond: Currently net long 1.2k, down 14.8k.
Major economic releases for next week are as follows. Markets are closed Friday for observance of Good Friday.
Tuesday brings the NFIB optimism index (March) and the consumer price index (March).
In February, small-business job openings increased a point month-over-month to 48. The series peaked at 51 last September.
In February, headline and core CPI respectively rose 0.8 percent and 0.5 percent. In the 12 months to February, they jumped 7.9 percent and 6.4 percent, in that order.
The producer price index (March) is scheduled for Wednesday. Wholesale prices in February increased 0.8 percent m/m and 10 percent year-over-year.
Retail sales (March) and the University of Michigan’s consumer sentiment index (April, preliminary) are on tap for Thursday.
Retail sales grew 0.3 percent m/m in February to a seasonally adjusted annual rate of $658.1 billion – a record.
Consumer sentiment in March dropped 3.1 points m/m to 59.7, which represents the lowest reading since September 2011.
Industrial production (March) and Treasury International Capital data (February) will be out on Friday.
US capacity utilization increased 0.4 percent m/m in February to 77.6 percent – a 35-month high.
For the first time in 26 months, foreigners’ 12-month net purchases of US stocks went negative in January to minus $14.5 billion. In March last year, the 12-month total peaked at record $404.7 billion.
WTI crude oil: Currently net long 334.9k, down 1.4k.
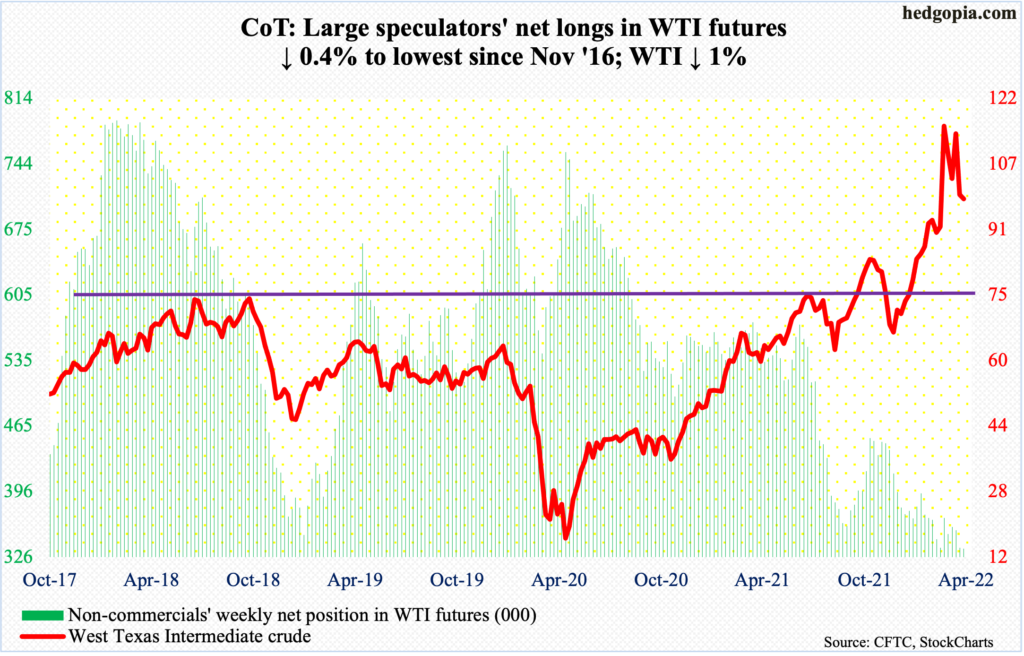
Attempts to rally failed at shorter-term averages on Tuesday and Wednesday, leading to the loss of the 50-day ($99.81) on Wednesday. This was the first time WTI closed below the average this year. By Thursday, the crude ($98.26/barrel) was testing horizontal support at $94-$95. This also makes up the lower support of a descending triangle WTI finds itself in.
WTI peaked at $130.50 on March 7 and made a series of lower highs after that. A decisive breach of the descending triangle can put the crude under continued pressure. There is straight-line support at $85, followed by the 200-day at $81.04.
Amidst all this, the daily is beginning to get oversold.
In the meantime, US crude production in the week to April 1 rose 100,000 barrels per day to 11.8 million b/d. Crude imports rose as well – up 41,000 b/d to 6.3 mb/d. As did stocks of crude and distillates, which were respectively up 2.4 million barrels and 771,000 barrels to 412.4 million barrels and 114.3 million barrels respectively. Gasoline stocks, however, fell – down two million barrels to 236.8 million barrels. Refinery utilization inched up 0.4 percentage point to 92.5 percent.
E-mini S&P 500: Currently net short 31.7k, down 19.2k.
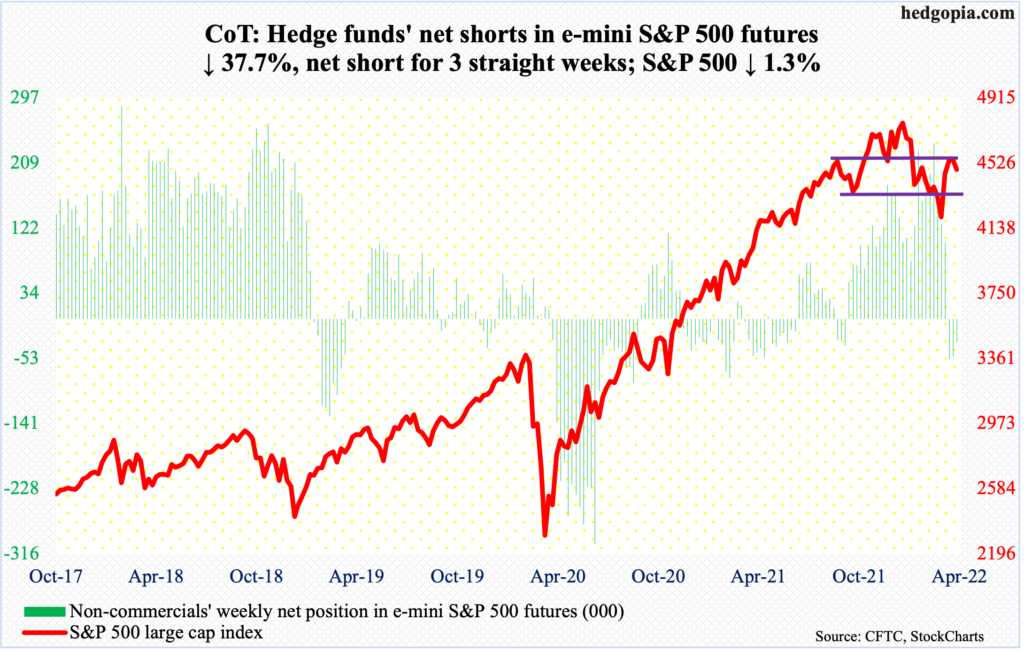
The S&P 500 (4488) began the week strong with a 0.8-percent rally on Monday but only to falter in the subsequent sessions. By Wednesday, the large cap index breached the 200-day, which then was reclaimed on Thursday and lost again on Friday. The average is slightly rising and is currently at 4493. Just above at 4550s lies dual resistance.
The index dropped from 4819 on January 4 to 4115 on February 24. A 61.8-percent Fibonacci retracement of this decline lies at 4550 (more on this here). This level also approximates horizontal resistance. It is natural that equity bulls and bears are fighting it out around here.
On both Wednesday and Thursday, bulls showed up at 4450. The 50-day, which is slightly curling up, is just underneath at 4427. Bears, on the other hand, are likely to show up at 4550-4600. As things stand, the bias is to the downside.
Euro: Currently net long 27.4k, up 6k.
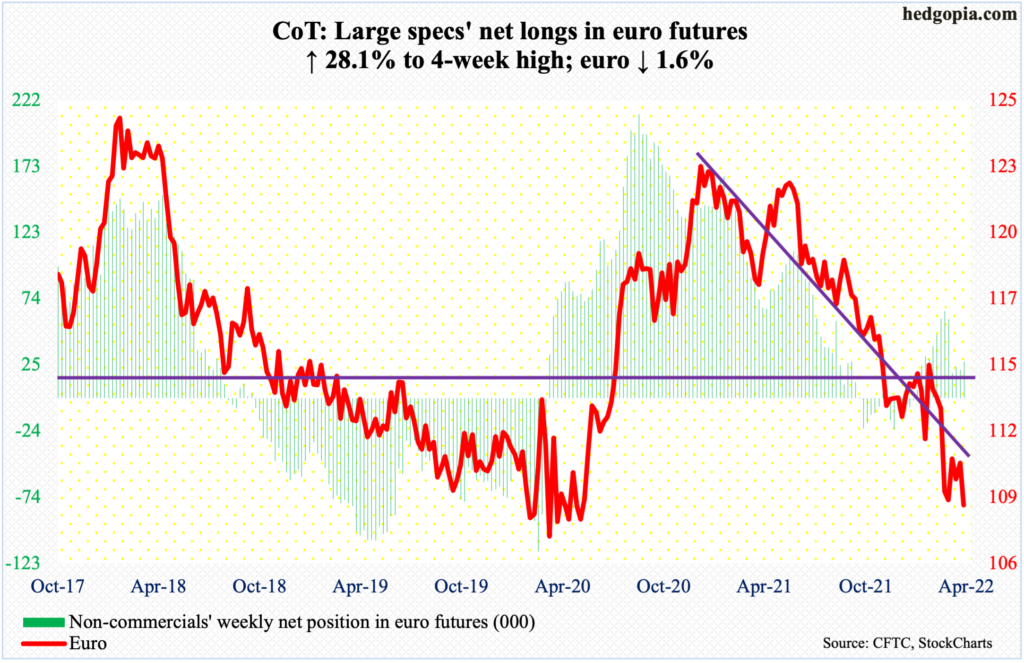
On March 7, the euro bottomed at $1.0845. It earlier peaked at $1.2345 in January last year. After the March bottom, the currency rallied as high as $1.1172 on March 30, before coming under sustained pressure. There is horizontal resistance at $1.12.
This week, the euro tested last month’s low. Intraday Thursday, it tagged $1.0867, followed by $1.0836 on Friday, closing the week at $1.0878. The way it is setting up, the euro in due course could very well breach this and eventually head toward crucial straight-line support at $1.05-$1.06.
Gold: Currently net long 245.5k, down 12.1k.
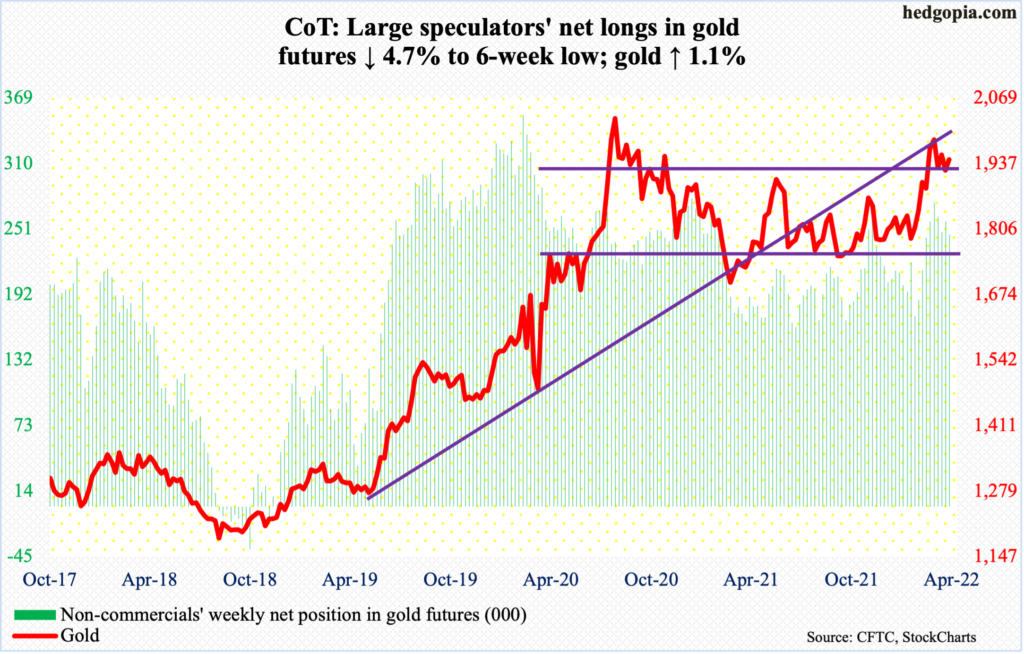
There is a fierce bull-bear battle going on around $1,920s. This week, the level was tested several times and gold bugs hung on to it. For the week, gold ($1,946/ounce) was up 1.1 percent.
In September 2011, the metal retreated after touching $1,924. Subsequently, it bottomed in December 2015 at $1,045. That high was not surpassed until July 2020, followed by a new all-time high of $2,089 a month later.
Early this March, bulls reclaimed $1,920s; by the 8th, they were less than $11 short of the August 2020 high, before offers overwhelmed bids. On condition that the price remains above this level, it is their ball to lose.
As things stand, there is resistance at $1,950s, which was hit intraday Friday.
Nasdaq 100 index (mini): Currently net short 8.6k, down 2.6k.
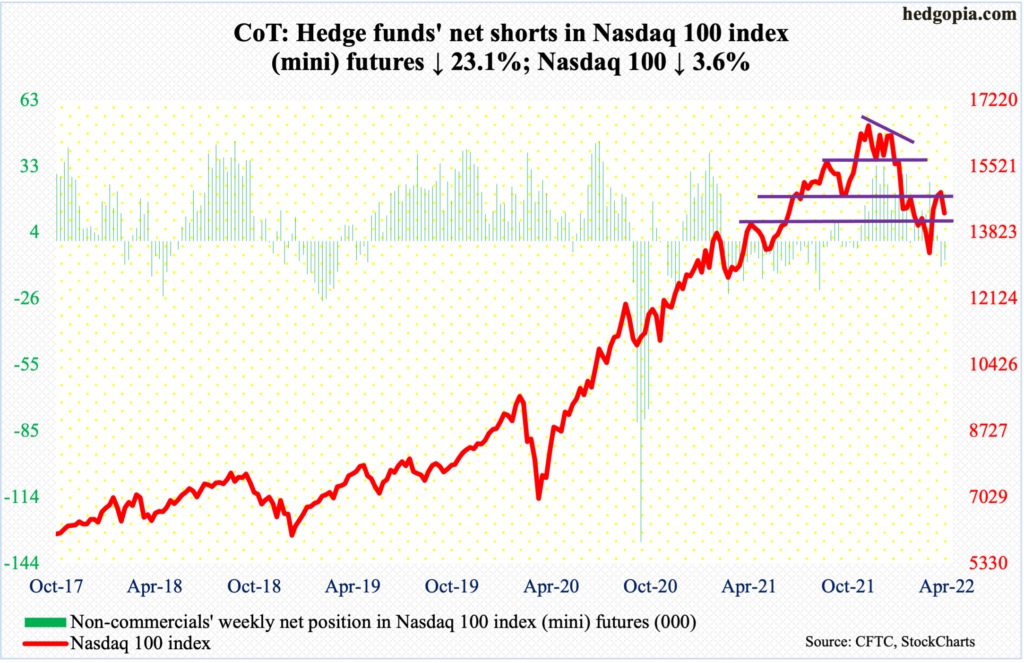
The Nasdaq 100 on Monday rallied two percent to close right on the 200-day (15156). Bulls were unable to take out the average. Rather, bears on Thursday forced a test of the 50-day (14344), which was successful. In other words, the 200-day attracted offers, while the 50-day attracted bids. The tech-heavy index is trapped between the averages. Either way it breaks, momentum is likely to follow. It ended the week at 14327 – just slightly under the 50-day.
Russell 2000 mini-index: Currently net short 58.3k, up 2.6k.
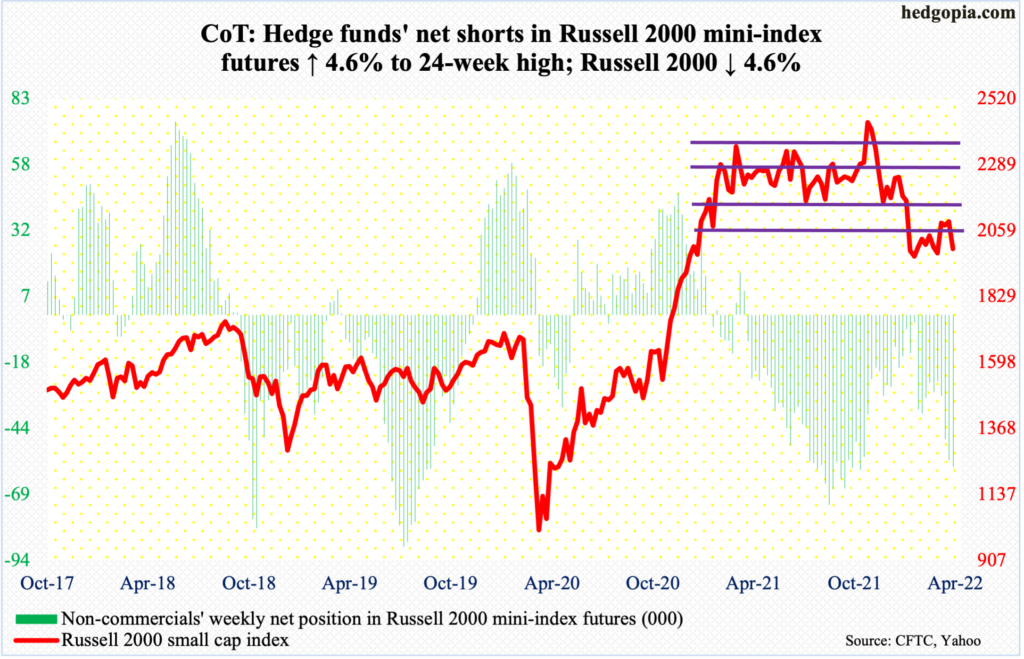
From March last year through January, the Russell 2000 was rangebound between 2350s and 2080s, and between 2280s and 2150s within this box. On Nov 3, it broke out but was quickly followed by a failed retest on the 19th (November). This was preceded by a range breakdown in January; the subsequent selling stopped near 1900, with a possible double bottom in late January and late February.
Last week, the small cap index closed at 2091, slightly above 2080s. This week, bulls tried to build on that and were unsuccessful. Intraday Thursday, the index tagged 1984, with a weekly close of 1995. A test of the lows of January and February may be a ways off, but the index is likely headed there in due course.
US Dollar Index: Currently net long 31.9k, up 911.
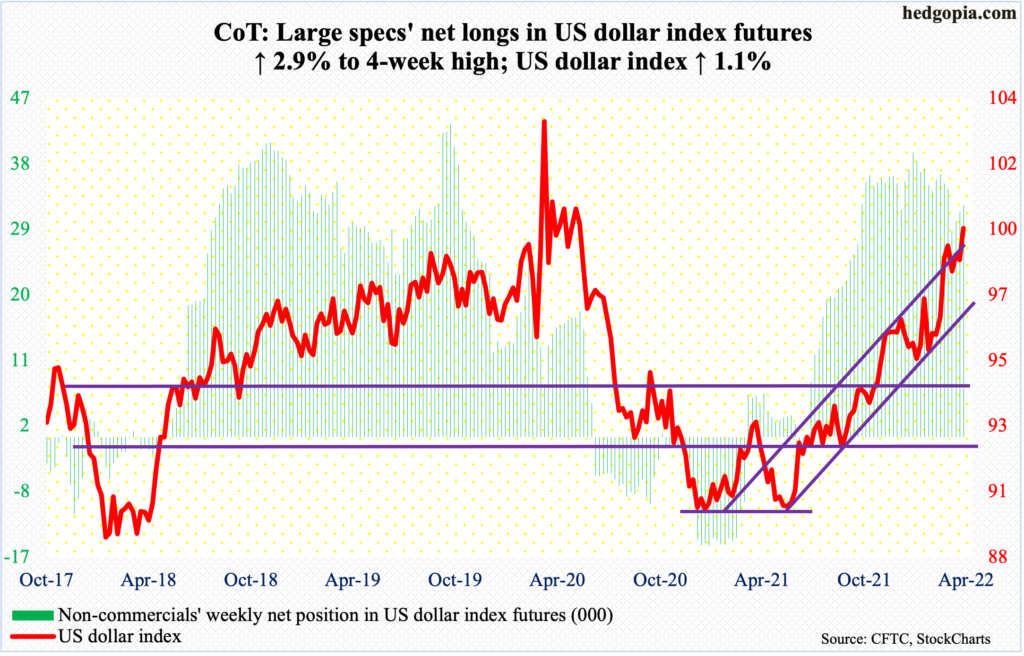
At long last, dollar bulls took out the March highs – 99.42 on the 7th and 99.36 on the 28th. Intraday Tuesday, the US dollar index ticked 99.50, followed by 99.80 on Wednesday and 99.85 on Thursday. Friday, it rallied as high as 100.20, but ended the session essentially flat at 99.75, for a shooting star session.
Resistance at 100 goes back years – particularly the past seven years. A decisive breakout will be a huge development. But fingers are crossed, considering Friday’s action.
VIX: Currently net short 83.6k, up 17.7k.
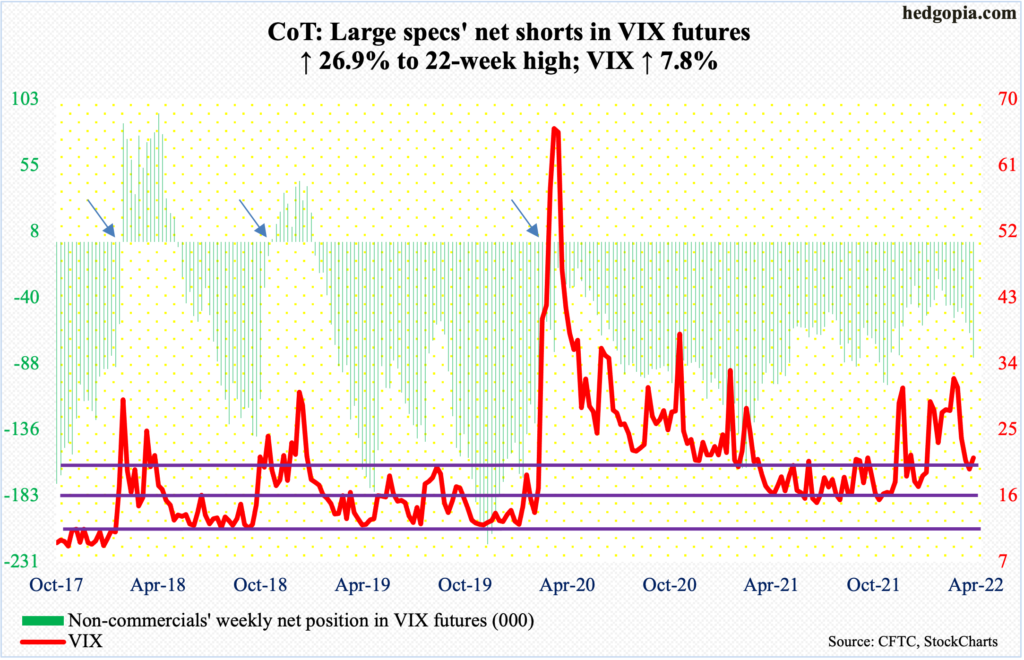
The daily MACD just completed a potentially bullish crossover. This week, VIX added 1.53 points to 21.16. There is room for continued run. The only thing is, the volatility index has approached the median in several daily indicators such as the RSI, and they can always turn back down from these levels, in which case volatility will subside.
Other than that, VIX rallied past the 200-day (20.82) on Tuesday. In the next session, it rallied as high as 24.78 but closed at 22.10; things evolved similarly on Thursday when VIX tagged 23.82 but only to close at 21.55. Both these sessions left behind long upper wicks. Come Friday, a spinning top showed up just above the 200-day.
The daily – still oversold – could be itching to rally. The next hurdle is mid-20s.
Thanks for reading!
