
Following futures positions of non-commercials are as of May 3, 2022.
10-year note: Currently net short 147.5k, up 29.7k.
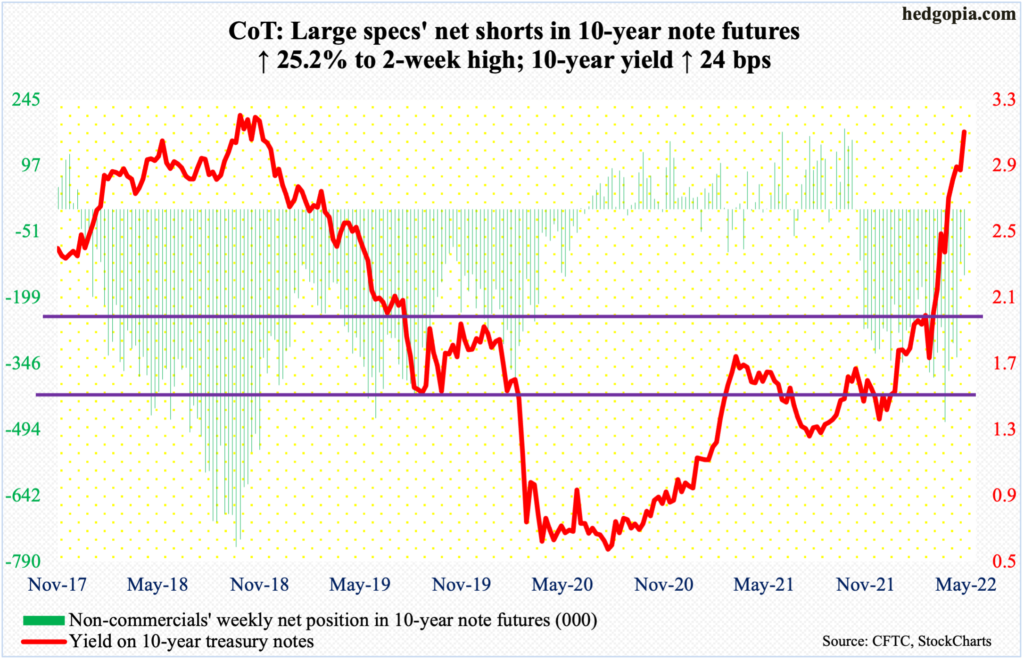
“Inflation is much too high and we understand the hardship it is causing, and we are moving expeditiously to bring it back down.”
Thus began Federal Reserve Chair Jerome Powell’s opening paragraph of the press conference statement post-conclusion of a two-day FOMC meeting on Wednesday. The fed funds rate was raised by 50 basis points to a range of 0.75 percent to one percent – the first increase of this magnitude in 22 years. This follows a 25-basis-point hike in March, which itself preceded a zero-bound monetary policy for two long years.
This week’s 50-basis-point raise was expected. In recent weeks, Powell’s hawkish meter had gone up several notches. Going into the meeting, futures traders had priced in the benchmark rates to hit 2.75 percent to three percent by December this year, including a 75-basis-point increase in June. Powell told the press they are not “actively considering” a 75 move, rather a couple of 50.
Futures traders are not buying it. They continue to expect a 75 in June, followed by a 50 in July, a 25 in September, a 50 in November and a 25 in December, ending 2022 at three percent to 3.25 percent. Powell tried to dial down his hawkishness, but the futures market is demanding that he remain a hawk.
Who will blink first? Traditionally, it is the Fed. Fingers crossed!
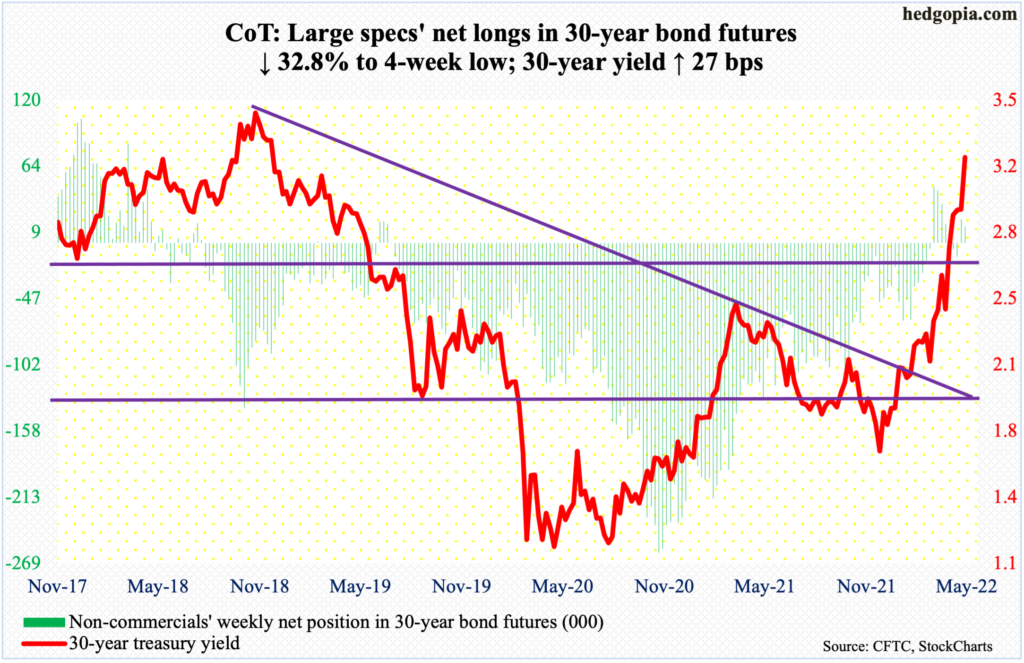
30-year bond: Currently net long 13.5k, down 6.6k.
Major economic releases for next week are as follows.
The NFIB optimism index (April) is due out on Tuesday. Small business optimism dropped 2.5 points month-over-month in March to 93.2 – a 23-month low.
Wednesday has on dock the consumer price index (April). In the 12 months to March, headline and core CPI jumped 8.5 percent and 6.5 percent respectively. This was the fastest pace of consumer inflation since December 1981 and August 1982, in that order.
The producer price index (April) is scheduled for Thursday. March producer prices rose 11.2 percent from a year ago and seven percent on a core basis.
The University of Michigan’s consumer sentiment index (May, preliminary) will be published on Friday. Sentiment increased 5.8 points m/m in April to 65.2 – a three-month high.
WTI crude oil: Currently net long 323.2k, up 330.
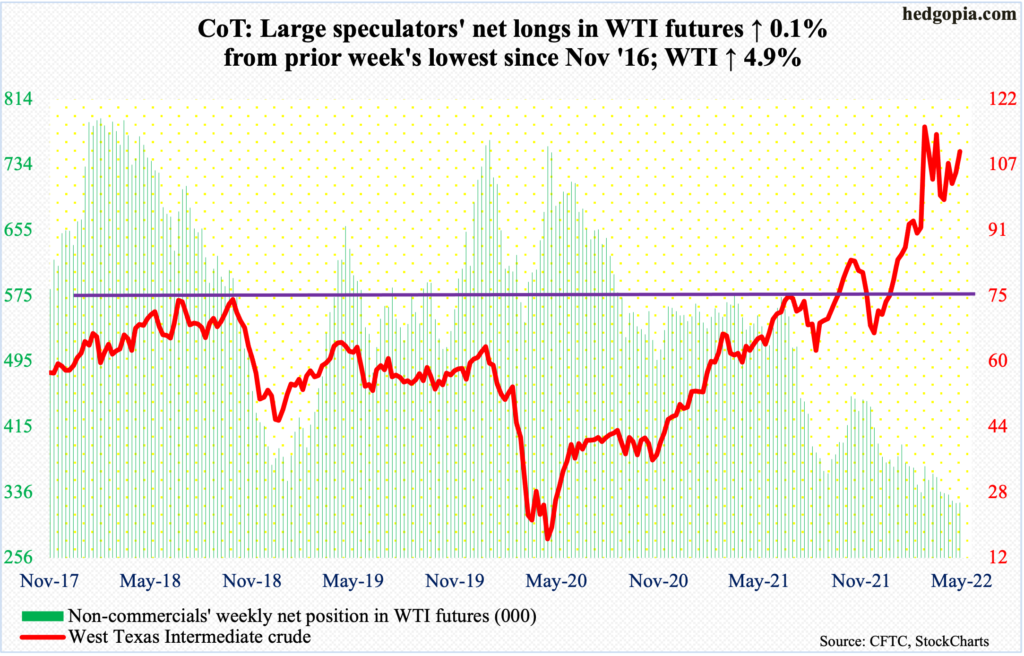
The 50-day continued to act as a magnet. WTI ($109.77/barrel) has traded around the average for the last five weeks. This week, the crude ended up 4.9 percent, 4.9 percent above the 50-day.
On Wednesday, the European Union proposed a package of sanctions to ban the use of Russian oil, raising supply concerns. This helped trader sentiment around both WTI and Brent.
Until Thursday’s intraday high of $111.37, WTI had posted lower highs since it peaked at $130.50 on March 7. This changed this week, with a pattern of higher highs and higher lows since early April. The crude has also consistently found support at $94-$95. Momentum likely swings the bears’ way once this level gives way.
In the meantime, US crude production in the week to April 29 remained unchanged at 11.9 million barrels per day. Crude imports rose 398,000 b/d to 6.3 mb/d. As did crude inventory, which increased 1.3 million barrels to 415.7 million barrels. Stocks of gasoline and distillates, however, dropped – respectively down 2.2 million barrels and 2.3 million barrels to 228.6 million barrels and 104.9 million barrels. Refinery utilization fell 1.9 percentage points to 88.4 percent.
E-mini S&P 500: Currently net long 52.2k, down 70.5k.
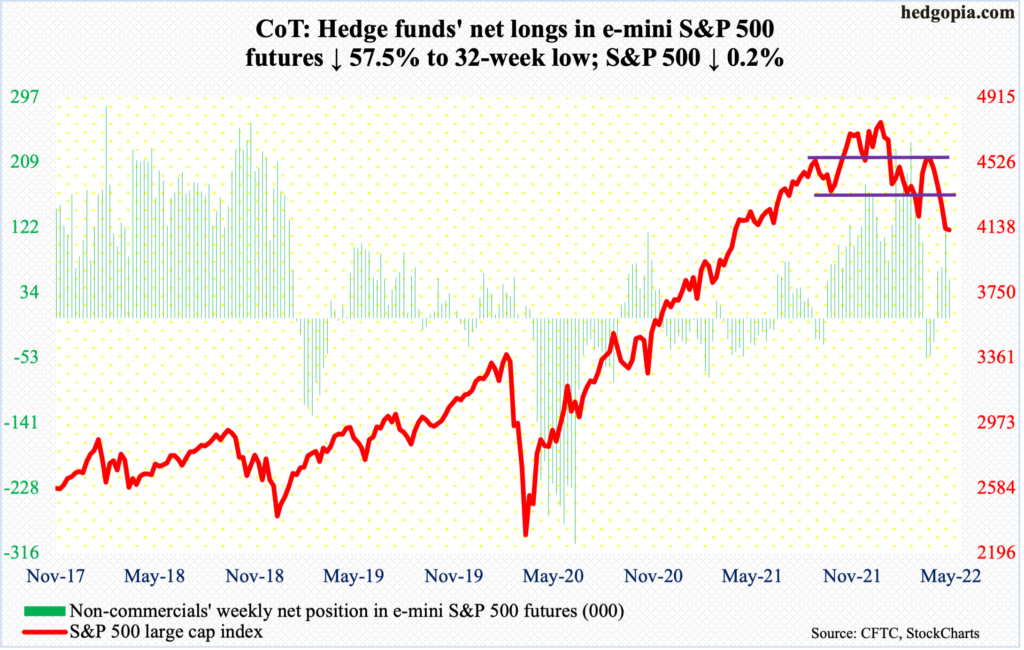
Quite a roller-coaster ride equity bulls and bears experienced this week. There were two sessions in which the S&P 500 moved three percent or higher – Wednesday was green and Thursday red. In the end, the large cap index, which was up 4.3 percent at Thursday’s intraday high of 4308, ended down 0.2 percent. At its worst at Monday’s low, it was down 1.7 percent.
When it was all said and done, the index ended the week closer to the weekly lows, not the highs, with a very long upper wick. If momentum remains with the bears next week, Monday’s low of 4063 holds immense importance; this was just about tested – successfully – on Friday as the session tagged 4068 before drawing bids, closing at 4123.
The S&P 500 peaked this January at 4819, before proceeding to make lower highs and lower lows, in effect going back and forth within a descending channel. Monday’s low was made just above the lower range, thus its importance.
Conditions are way oversold.
Euro: Currently net short 6.4k, up 28.6k.
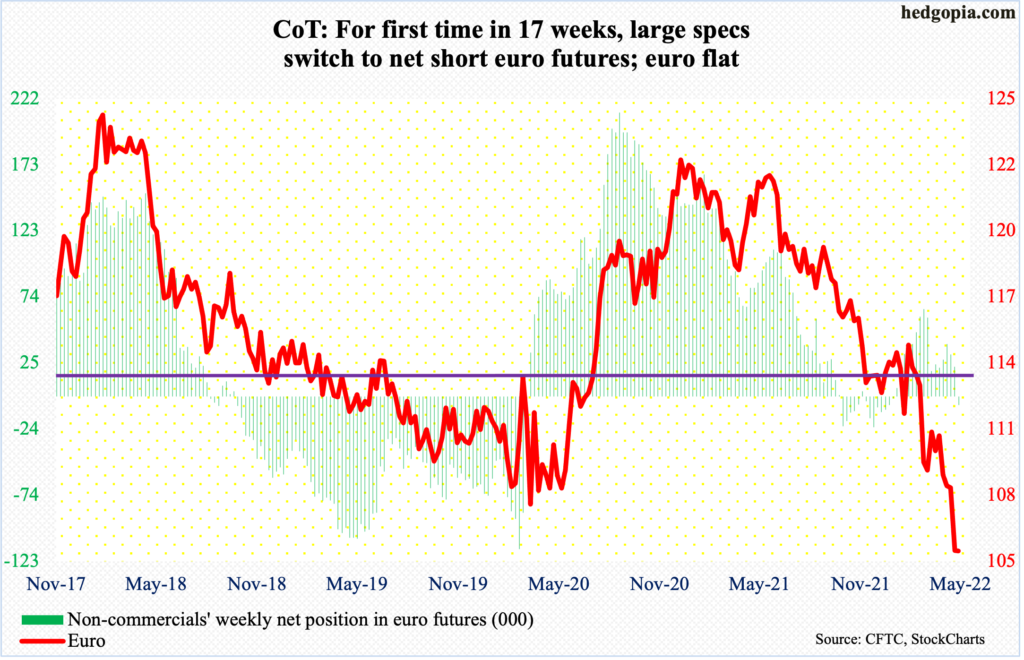
Wednesday’s one-percent rally stopped at the 10-day, which continues to fall. In the next session, the euro dropped 0.8 percent with a low of $1.0492, which was not too far away from the April 28 low of $1.0471. For the week, it closed flat.
Straight-line support at $1.05-$1.06 goes back seven years. Understandably, both bulls and bears are trying to stake a claim to this level. The downtrend the euro has been in since it peaked at $1.2345 in January last year is not over, but bulls have an opportunity here to put their foot down.
Should the currency ($1.0544) begin to rally near term – likely – there is decent resistance at $1.0750s.
Gold: Currently net long 199.2k, down 18.9k.
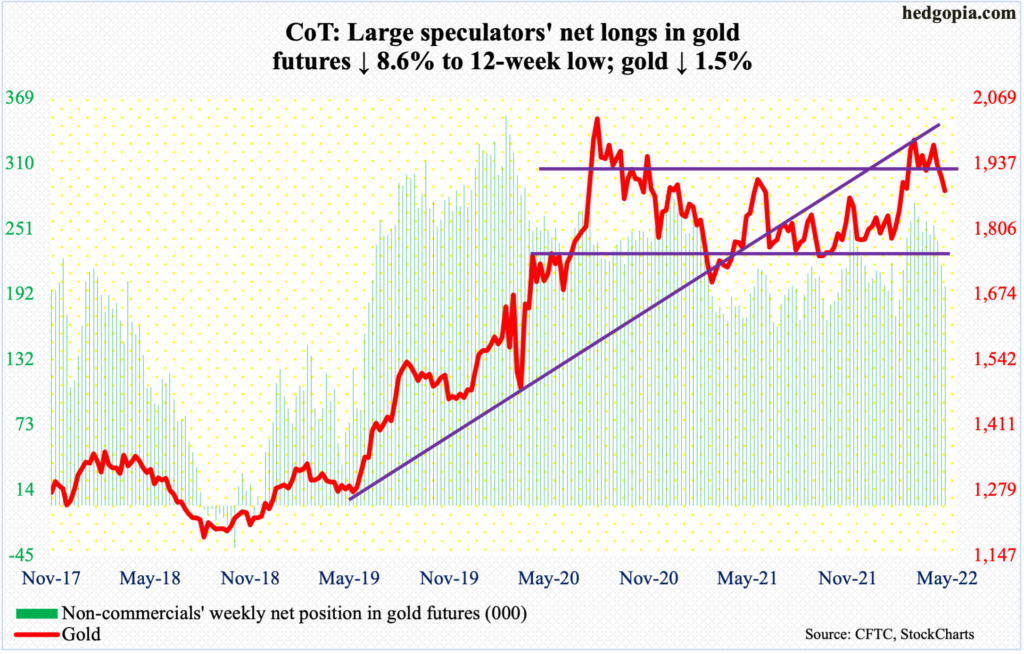
Gold continued lower, down 1.5 percent this week for a third straight down week.
The metal opened last week with a breach of crucial support at $1,920s and has come under pressure since. This week, it ticked $1,850 on Tuesday. Gold bugs’ consolation is that this was a test of horizontal support at $1,850s and it held.
On the daily, there is room for strength; at the same time, should the weekly prevail, the downward momentum of the last few weeks continues.
Therefore, $1,920s will continue to be a make-or-break. On Thursday, the yellow metal ($1,883/ounce) rallied to $1,911 before sellers showed up.
Nasdaq 100 index (mini): Currently net long 16.1k, up 259.
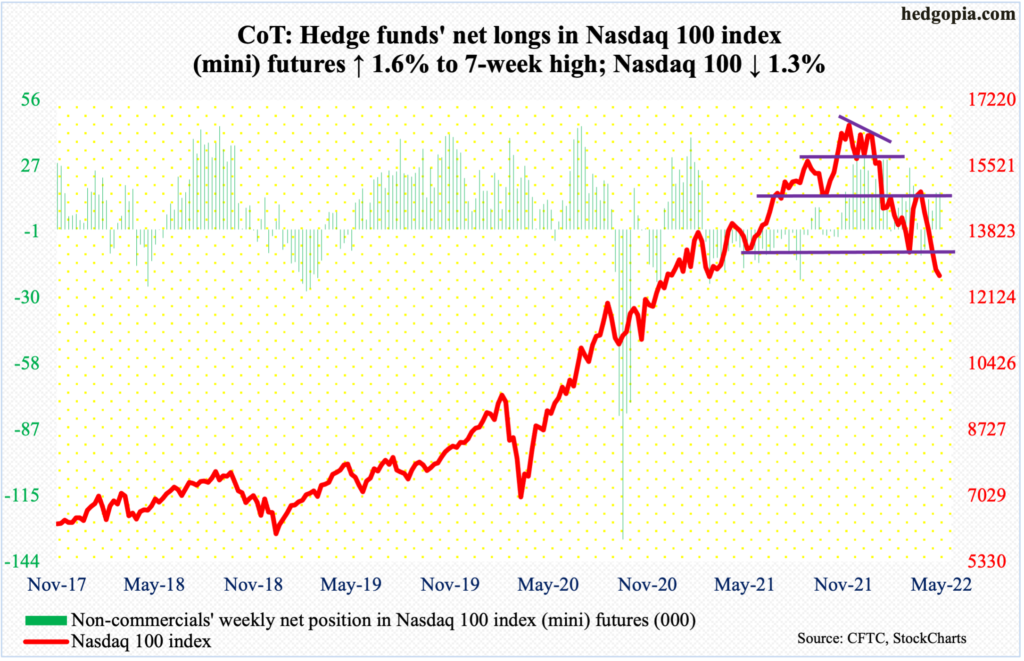
From the November 2021 high of 16765 through Friday’s low of 12523, the Nasdaq 100 tumbled 25.3 percent. The tech-heavy index is yet to show reliable signs of stability.
Bulls tried hard this week but in the end were no match for the bears. At Thursday’s high, the Nasdaq 100 was up 5.5 percent for the week but ended down 1.3 percent by the time Friday was over.
If downward momentum persists in the sessions ahead, there is straight-line support at 12200s. The index ended the week at 12694.
Russell 2000 mini-index: Currently net short 44.8k, up 538.
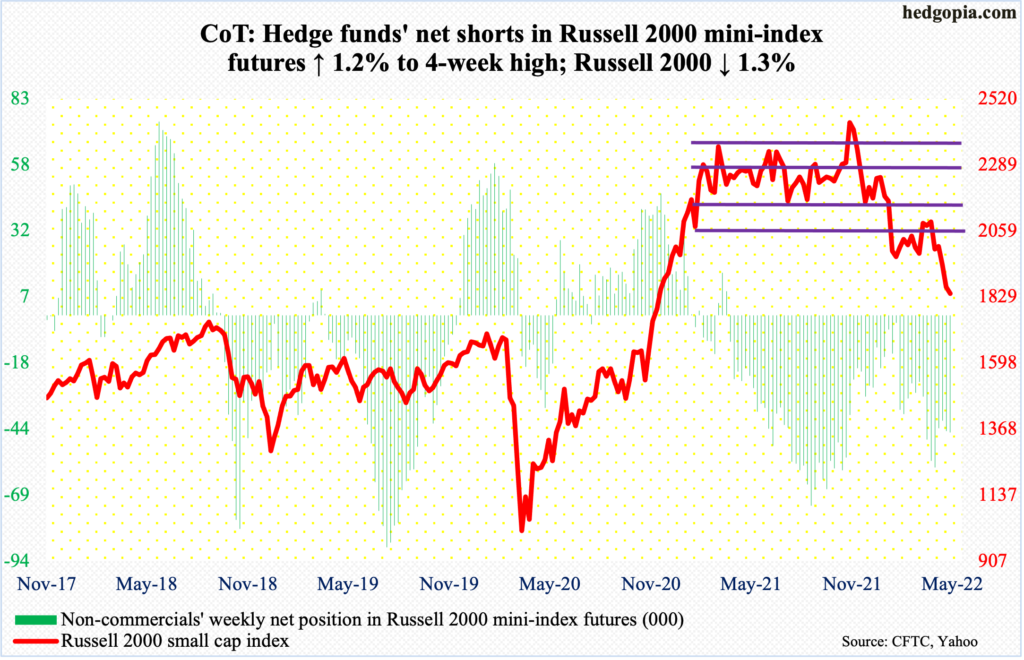
The Russell 2000 had quite a confused week – ranging from up 4.8 percent to down 2.3 percent to end the week down 1.3 percent. In four of the five sessions, the small cap index closed under 1900, which was breached last week. For a little over three months now, it has played ping pong between 2080s and 1900.
Before that, mid-January, the index suffered a rectangle breakdown. From March last year through January, the Russell 2000 went back and forth between 2350s and 2080s, and between 2280s and 2150s within this box. On Nov 3, it broke out but was quickly followed by a failed retest on the 19th that month. Then came the mid-January breakdown, followed by a breach of 1900 late last month.
Ideally, small-cap bulls would like to have another go at 2080s. But before that happens, they need to recapture 1900 first. The index closed at 1840.
US Dollar Index: Currently net long 33.1k, down 808.
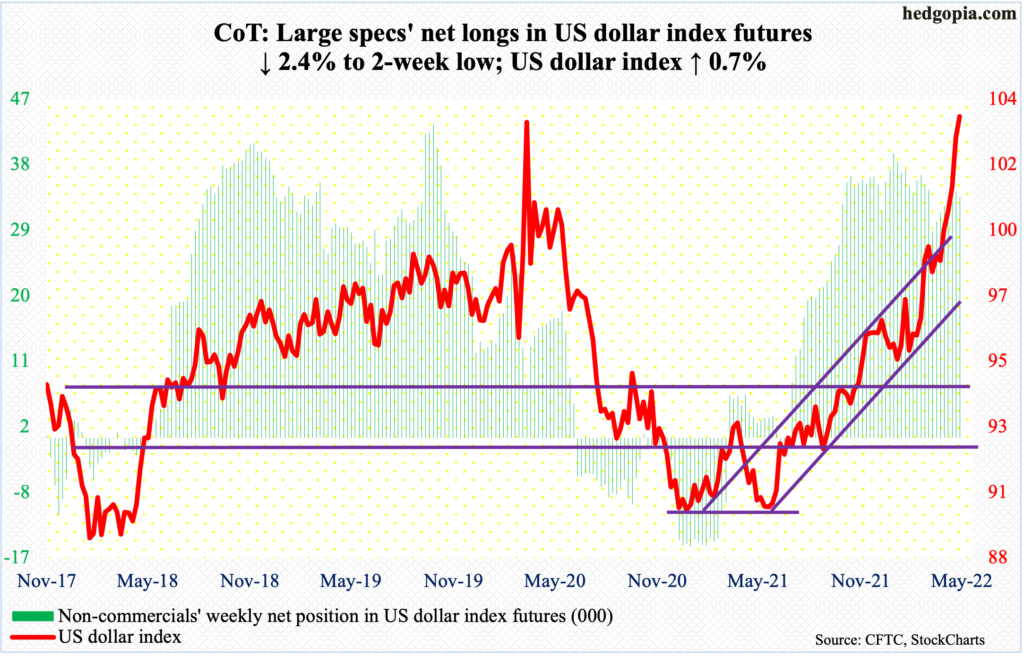
The US dollar index is stalling at March 2020 highs. Back then, it retreated sharply after tagging 103.96. Last week, it ticked 103.95, closing at 102.96. This week, it rallied 1.2 percent on Thursday to post a session high 103.97; come Friday, it tagged 104.11 but ended the spinning top session at 103.69.
The index is attempting to break out after having rallied 16 percent in a year. The upward momentum is intact, but at the same time conditions are way overbought. That said, a breakout – should one occur – will be a major development and reverberate through a whole host of assets, not to mention economies.
VIX: Currently net short 61.7k, down 10.5k.
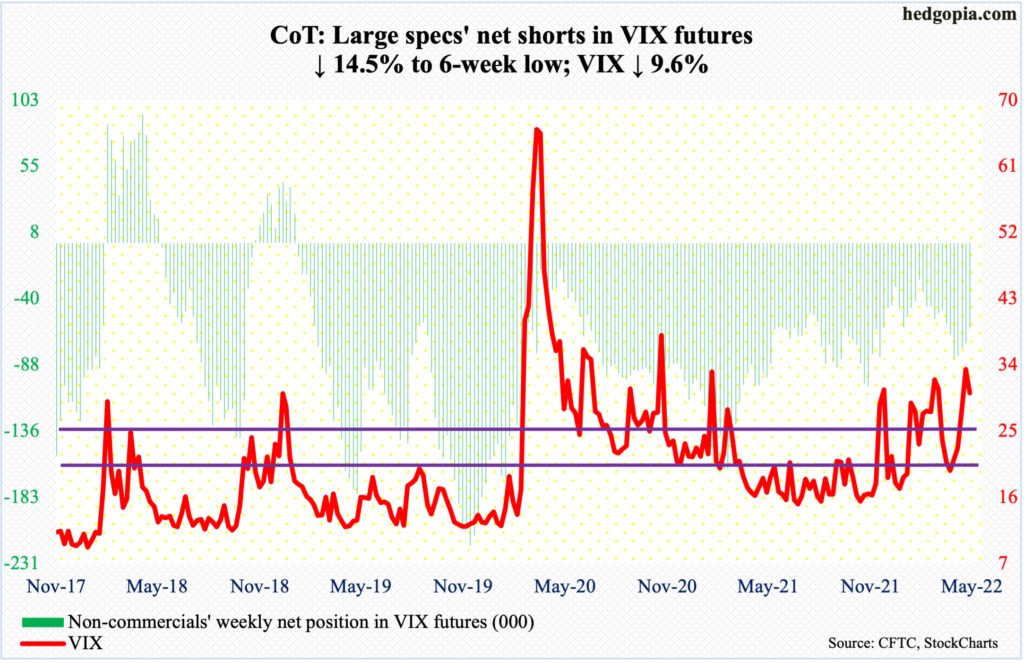
VIX rallied as high as 36.64 intraday Monday but only to reverse and close at 32.34. The volatility index came under more pressure in the next couple of sessions, touching 24.94 on Wednesday, which coincided with mid-20s horizontal support and it held.
On Friday, VIX once again failed to hang on to the gains, having rallied to 35.34 intraday but closed at 30.19.
It is too soon to declare VIX is in the process of charting out a spike reversal but it is possible.
Since January, it has had several tries at high-30s – all unsuccessfully. This week, it moved in tandem with the S&P 500, as both were down. This is rare.
Thanks for reading!
