
Following futures positions of non-commercials are as of May 24, 2022.
10-year note: Currently net short 225.1k, up 65k.
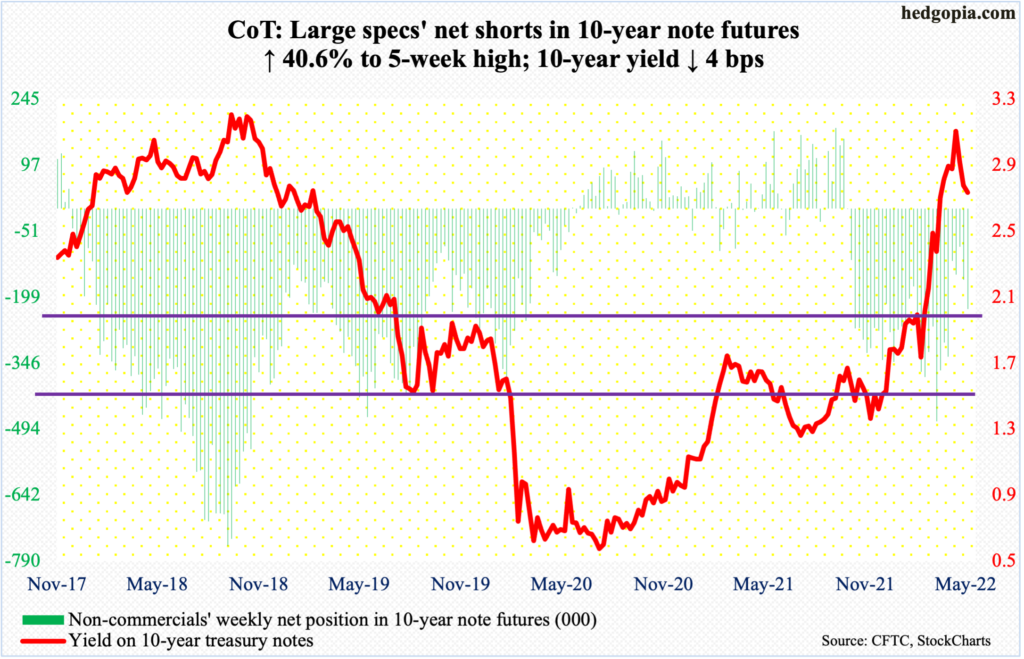
May has one session to go before the month is over. The 10-year treasury yield is on course for a potentially major reversal. Even if a monthly spinning top does not fully form, a candle with a long upper wick looks imminent.
The reversal is important in that rates tagged 3.17 percent on the 9th before turning down. This was a test of the highs back in October-November 2018 when the 10-year retreated hard after touching 3.24s.
This month’s reversal comes after a massive rally, as the 10-year yielded 1.13 percent only last August. It may be a while – we are talking months and quarters – before rates rally back above the three handle.
Yields remain grossly overbought on both the weekly and monthly. Bond vigilantes are beginning to price in a meaningful slowdown in the US economy, if not an outright contraction.
Bond bears (on price) have an opportunity here to put their foot down, as rates are trying to find support at the 50-day (2.73 percent). The 10-year closed out the week at 2.74 percent. A decisive breach of the average will add more weight to the potentially bearish monthly candle.
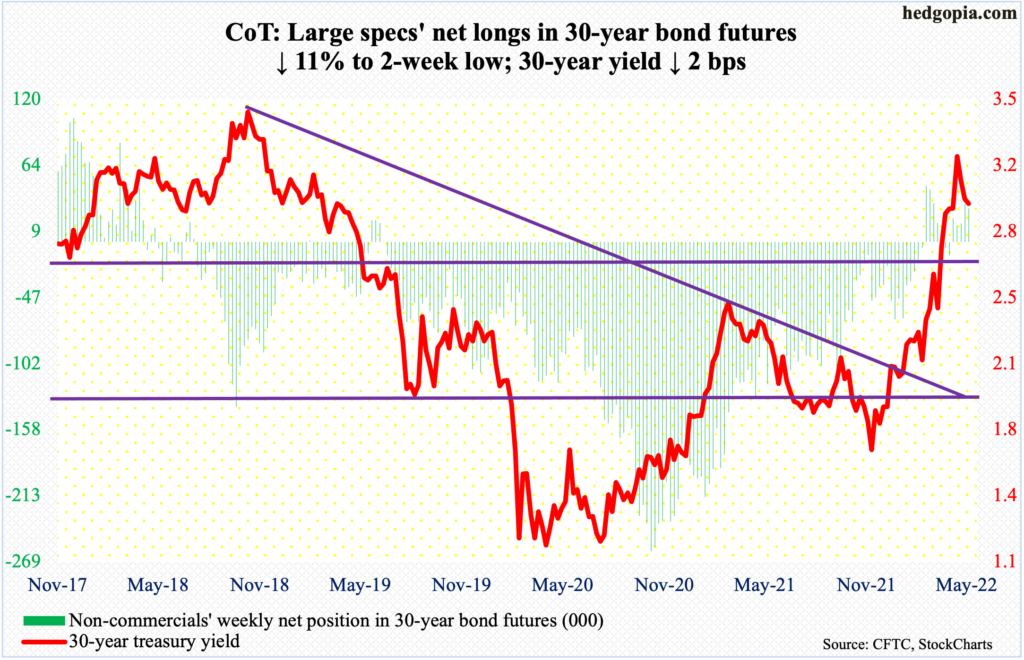
30-year bond: Currently net long 28.5k, down 3.5k.
Major economic releases for next week are as follows. Markets are closed Monday for observance of Memorial Day holiday.
The S&P Case-Shiller home price index (March) will be published on Tuesday. Nationally, US home prices jumped 19.8 percent year-over-year in February, which is within striking distance of last August’s record 20 percent.
Wednesday brings the ISM manufacturing index (May) and JOLTs job openings (April).
Manufacturing activity contracted 1.7 percentage points month-over-month in April to 55.4 percent.
Non-farm job openings increased 205,000 m/m in March to 11.5 million, setting a new record.
Labor productivity (1Q22, revised) and durable goods orders (April, revised) are on tap for Thursday.
Preliminarily, non-farm output per hour shrank 0.6 percent y/y in 1Q. This was the second decline in the last three quarters after rising 20 quarters in a row.
Preliminarily, orders for non-defense capital goods ex-aircraft – proxy for business capex plans – rose 0.3 percent y/y in April to a seasonally adjusted annual rate of $73.1 billion, which is a new record.
Payrolls (May) and the ISM services index (May) will be out on Friday.
In April, 428,000 non-farm jobs were added, for an average 519,000 in the first four months this year. Last year, the economy created a monthly average of 562,000 jobs.
Services activity in April dropped 1.2 percentage points m/m to 57.1 percent.
WTI crude oil: Currently net long 343.2k, down 5k.
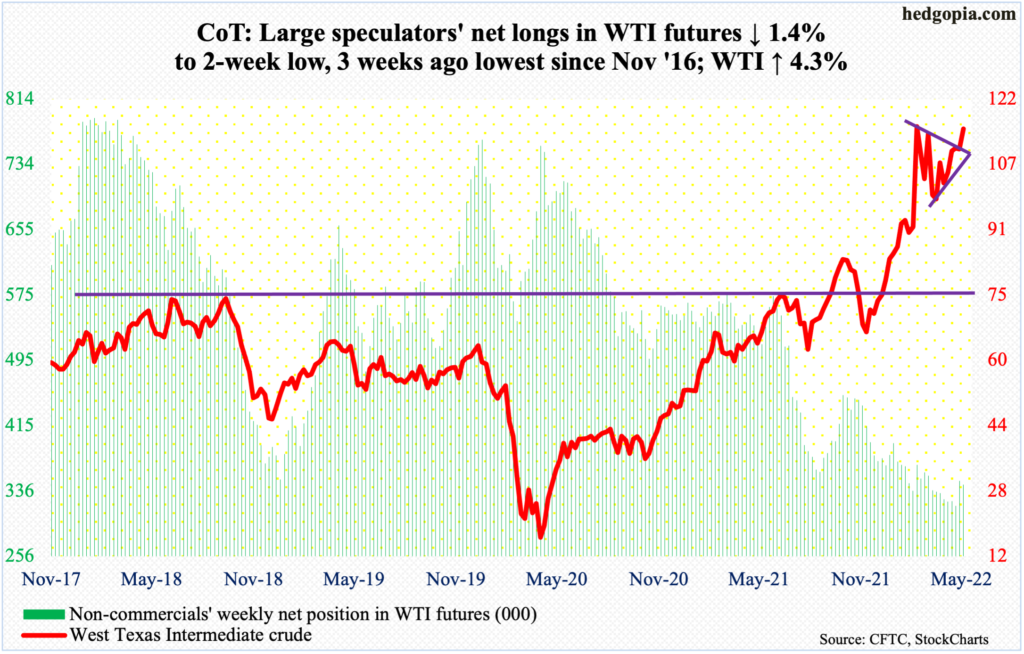
Since April 11 when WTI ($115.07/barrel) stopped going down at $92.93, there has been a pattern of higher highs/higher lows. Last week’s high of $115.56 was not quite taken out this week, but it came close, with Friday tagging $115.30.
Resistance at $115-$116 goes back to early March. A decisive breakout should open the door toward the March highs just north of $130.
In the meantime, US crude production in the week to May 20 was unchanged week-over-week at 11.9 million barrels per day. Crude imports declined 82,000 b/d to 6.5 mb/d. As did stocks of crude and gasoline, which respectively dropped one million barrels and 482,000 barrels to 419.8 million barrels and 219.7 million barrels. Stocks of distillates went the other way, up 1.7 million barrels to 106.9 million barrels. Refinery utilization rose 1.4 percentage points to 93.2 percent.
E-mini S&P 500: Currently net long 48.9k, down 17.8k.
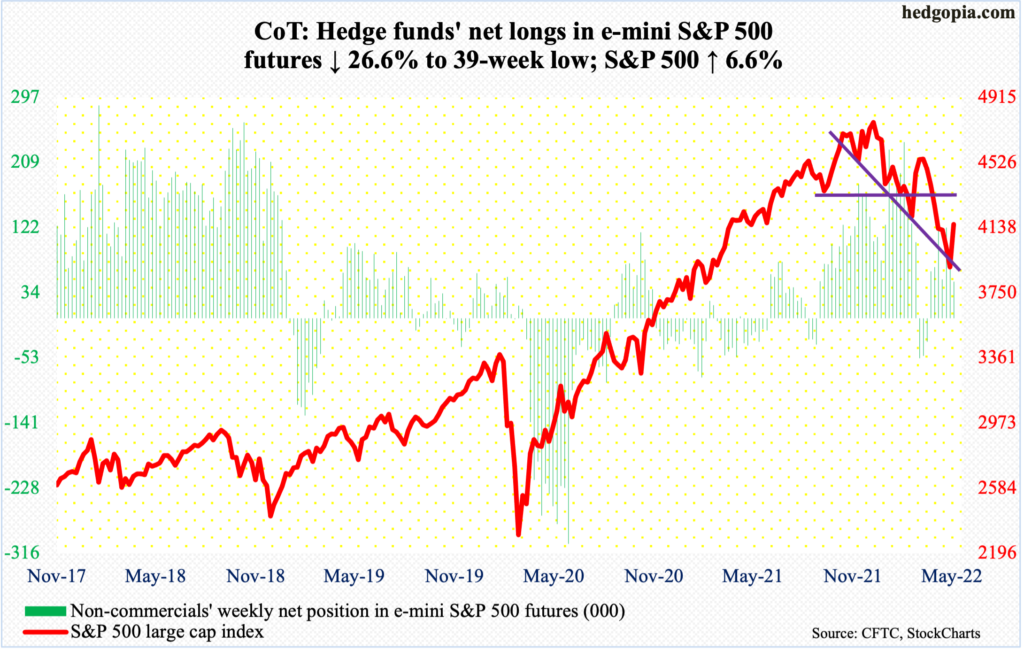
Bulls’ pain stopped at seven. That is the number of weeks the S&P 500 dropped in a row. This week, it shot up 6.6 percent, to 4158.
Last Friday, as the large cap index ticked 3810, through which it tumbled 20.9 percent from January’s record high 4819, it tested the lower end of a descending channel it has been in since early this year. At this week’s low of 3875, the support was once again tested – successfully.
Concurrently, shorter-term moving averages have curled up. The daily MACD developed a bullish crossover. There is room for the index to continue higher. The upper end of the channel mentioned above lies at 4450s, which is about where the 200-day (4457) lies. A takeout of 4150s, which is where the S&P 500 ended, will be the first step toward 4450s.
For a change, for the first time in eight weeks, flows into US-based equity funds turned positive, taking in $5.2 billion (courtesy of Lipper). In the same week, SPY (SPDR S&P 500 ETF), VOO (Vanguard S&P 500 ETF) and IVV (iShares Core S&P 500 ETF) took in $8.6 billion (courtesy of ETF.com).
Euro: Currently net long 38.9k, up 18.6k.
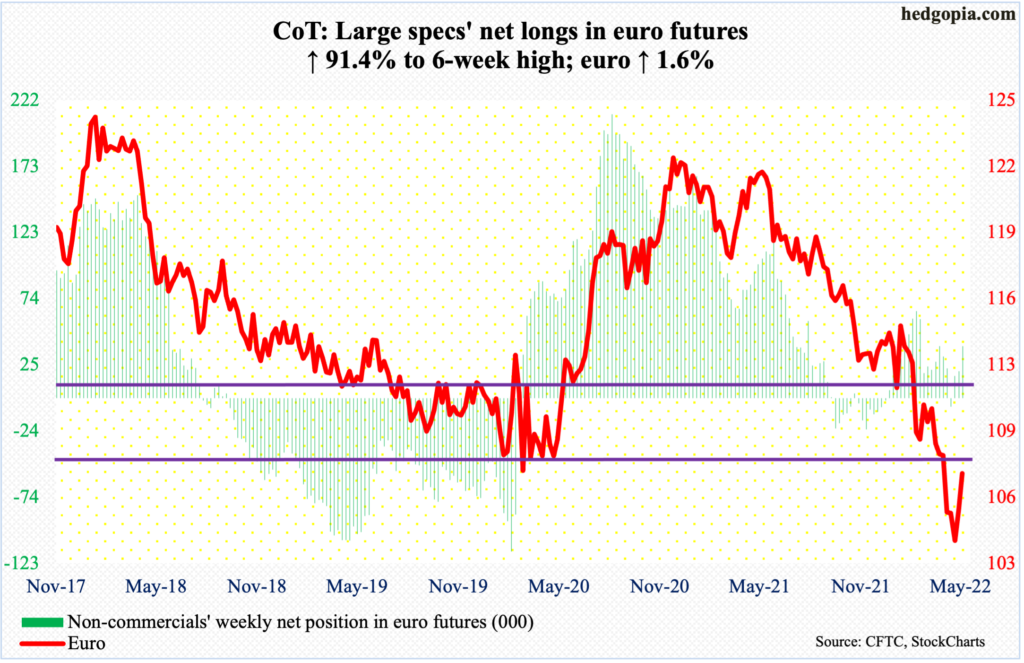
After last week’s bullish island reversal near the January 2017 low of $1.0341, the euro had a second positive week after six down in succession. On Friday, it tagged $1.0755 intraday, ending the session at $1.0733, up 1.6 percent for the week.
Monday’s gap-up took care of resistance at $1.05-$1.06, which goes back seven years. Friday’s high also matched the 50-day ($1.0755); plus, there is straight-line resistance.
Should the currency take a breather here, the resistance-turned-support $1.05-$1.06 is crucial.
Gold: Currently net long 183.8k, up 8.5k.
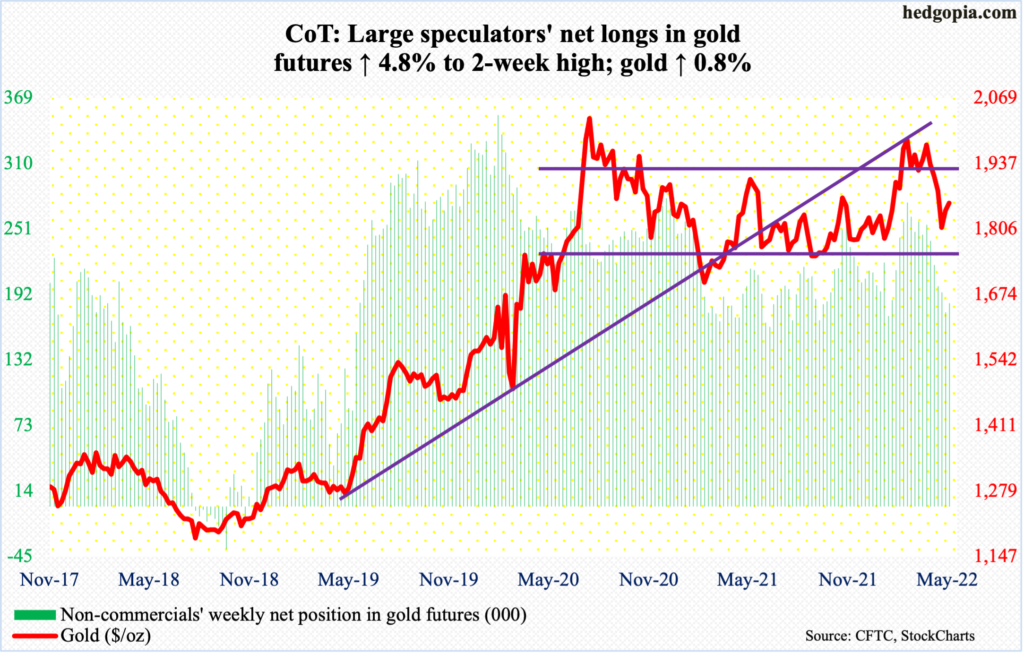
Last week, after four down weeks in a row, gold rallied 1.9 percent to close right under a broken rising trend line from last August. This week, it rallied as high as $1,869 on Wednesday, which, if held, would have reclaimed the trend line, but that would not be. By the end of the week, the metal closed up 0.8 percent to $1,857/ounce – right at that trend line.
Gold bugs need to reclaim $1,850s for further momentum. It is only then they can eye the make-or-break $1,920s.
Nasdaq 100 index (mini): Currently net long 13.7k, down 1.4k.
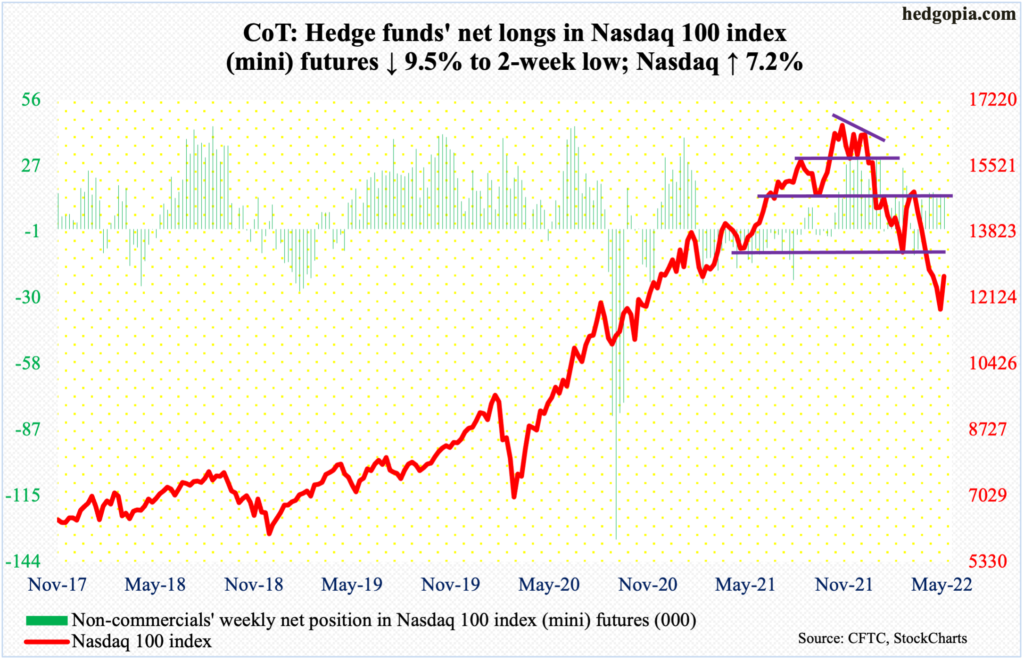
Last Friday’s hammer reversal at the lower end of a descending channel going back to late last year or early this year worked out well for tech bulls. This week, the Nasdaq 100 jumped 7.2 percent – the first up week in eight.
From last November’s record high 16765 through last Friday’s 11492, the tech-heavy index tumbled 31.5 percent, before bids showed up this week.
As the Nasdaq 100 was making new lows, several indicators such as new highs versus new lows, the advance-decline line and the percent of stocks above the 50-day were diverging (more on this here).
Nearest resistance rests at 13000. The index closed out the week at 12681.
Russell 2000 mini-index: Currently net short 74.6k, up 4.6k.
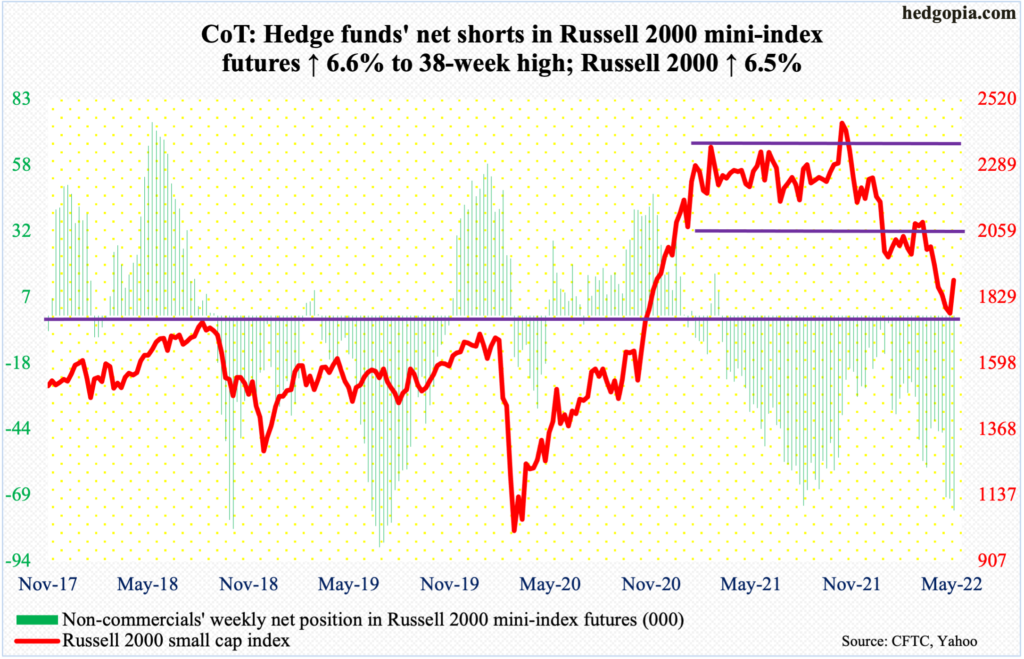
Small-caps traditionally outperform when investor mood gravitates toward risk-on.
Last week, the Russell 2000 fared relatively better versus the S&P 500 and the Nasdaq 100; they were respectively down 1.1 percent, 3.1 percent and 4.5 percent.
Before that, the small cap index ticked 1701 on the 12th, which was a successful defense of a breakout from November 2000. This week, the Russell 2000 rallied 6.5 percent. This preceded a 30.8-percent drop between last November’s record high and the low 12 sessions ago.
The index ended the week at 1888, just under 1900. It played ping pong between 2080s and 1900 for three months before breaching the support in late April. Before that in mid-January, a major range breakdown occurred, losing 2080s; for 10 months, the index went back and forth between 2080s and 2350s.
In the meantime, non-commercials’ net shorts have reached a 38-week high. In the right circumstances for small-cap bulls, this could end up acting as a tailwind, as these bearish positions get unwound.
US Dollar Index: Currently net long 38k, up 1.8k.
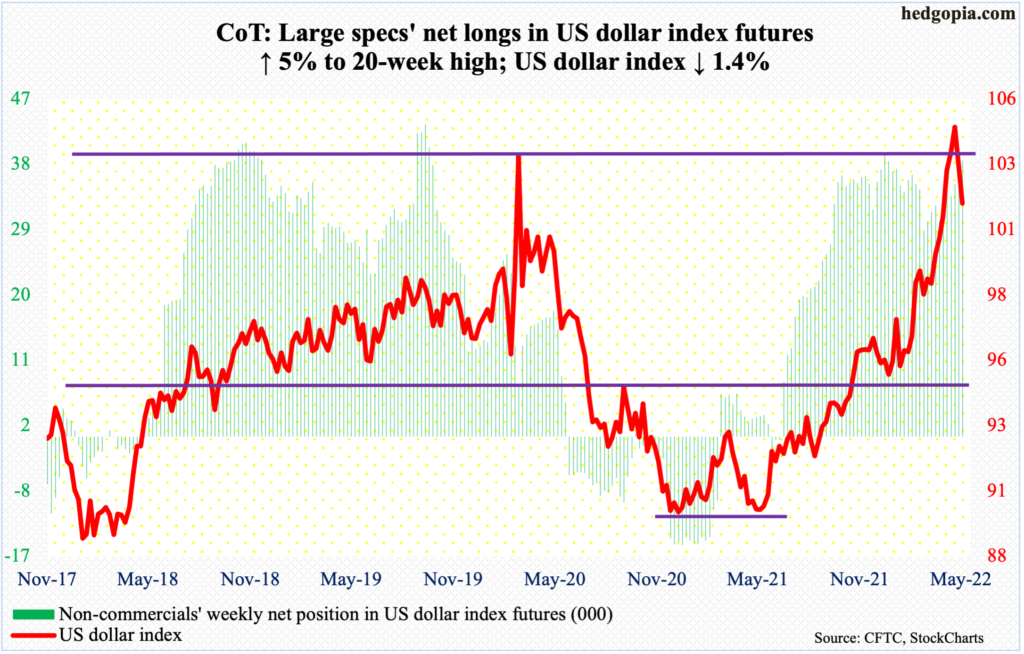
With one session of trading to go this month, what looked like a monthly long-legged doji until last week is morphing into a potential spinning top. This would have evolved after a 17.8-percent rally from the low of 89.17 posted in January last year. This week, the index gave back 1.4 percent, following last week’s similar loss.
On the 12th, the US dollar index broke out of just south of 104, which acted as a ceiling going back to January 2017. It then rallied as high as 105.06 before sellers showed up. Breakout retest failed on the 17th.
The index (101.70) remains massively overbought on both the weekly and monthly. Concurrently, it is beginning to get oversold on the daily. The 50-day lies at 101.30. Dollar bulls better hold on to the average if they wish for a breather.
VIX: Currently net short 43.6k, up 4k.
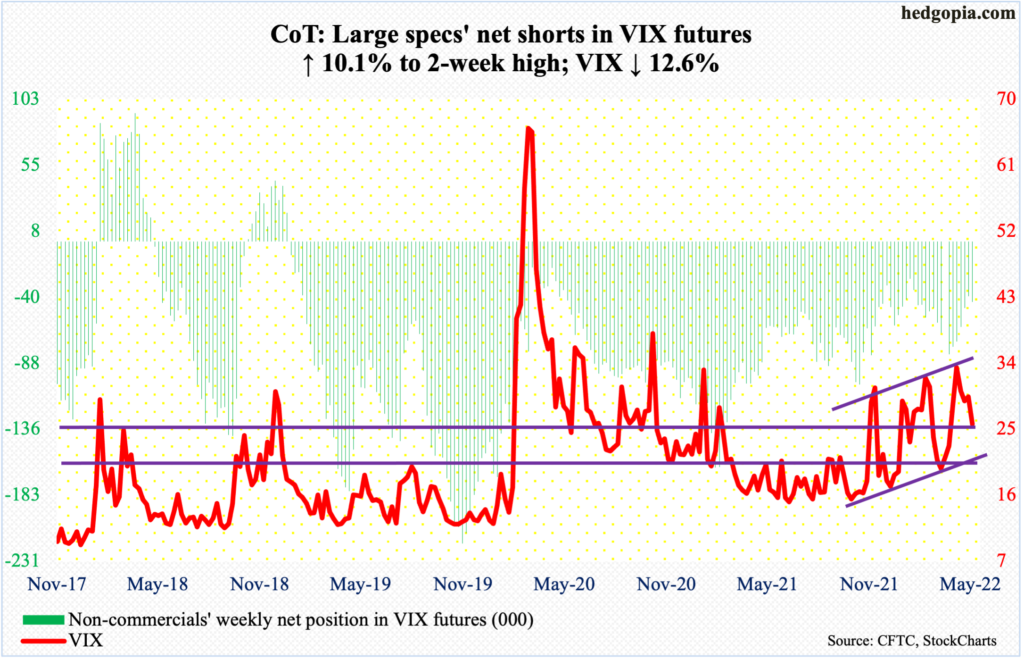
On the weekly, this week’s high of 31.07 is yet another lower high after tagging 36.64 four weeks ago. In fact, this pattern has held since January when VIX hit 38.94. (Although on a closing basis, there is a pattern of higher highs/higher lows.)
On Friday, the 50-day (25.89) was ever so slightly breached, with the volatility index closing at 25.72 – right at horizontal support at mid-20s. A probable breach in the sessions ahead raises the odds VIX careens toward the 200-day (22.67), which approximates with low-20s support.
Thanks for reading!
