
Following futures positions of non-commercials are as of June 14, 2022.
10-year note: Currently net short 205.5k, down 60.7k.
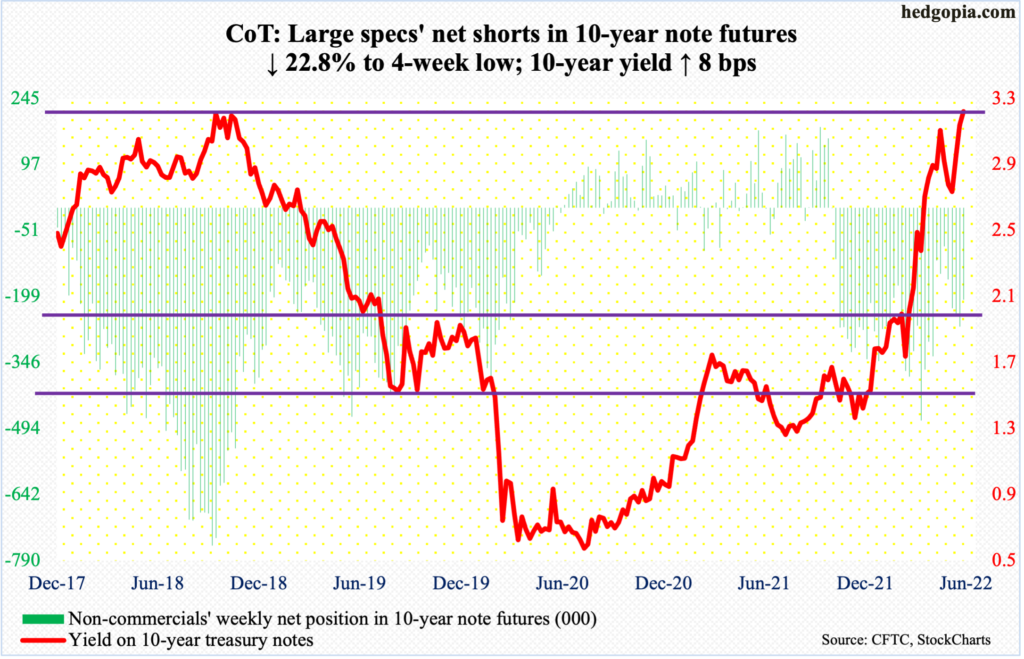
The Federal Reserve this week raised the fed funds rate by 75 basis points to a range of 1.5 percent to 1.75 percent. This was the year’s fourth scheduled meeting; four more remain. Leading up to this, the Fed raised twice – by 25 basis points in March and 50 basis points in May.
At the March meeting, Chair Jerome Powell knocked down markets’ expectations for a 75-basis-point hike but said a couple of 50 was possible. Futures traders quickly adjusted to this guidance. In the wake of last Friday’s red-hot CPI report for May, they again rejiggered their rates outlook, going back into demanding a tighter Fed. In the futures market, a 75-basis-point raise was priced in.
Powell and his team were compelled to appease these traders, who expect another 75 in July, a 50 each in September and November, and a 25 in December, ending the year between 3.5 percent and 3.75 percent.
It is one of those weird times when markets want more tightening than the central bank is prepared for. The former is clearly saying the Fed is behind the curve and that it would be next to impossible to engineer a soft-landing. Viewed this way, front-loading the tightening cycle makes sense, just so the Fed will have some arrows in its quiver when the next contraction hits.
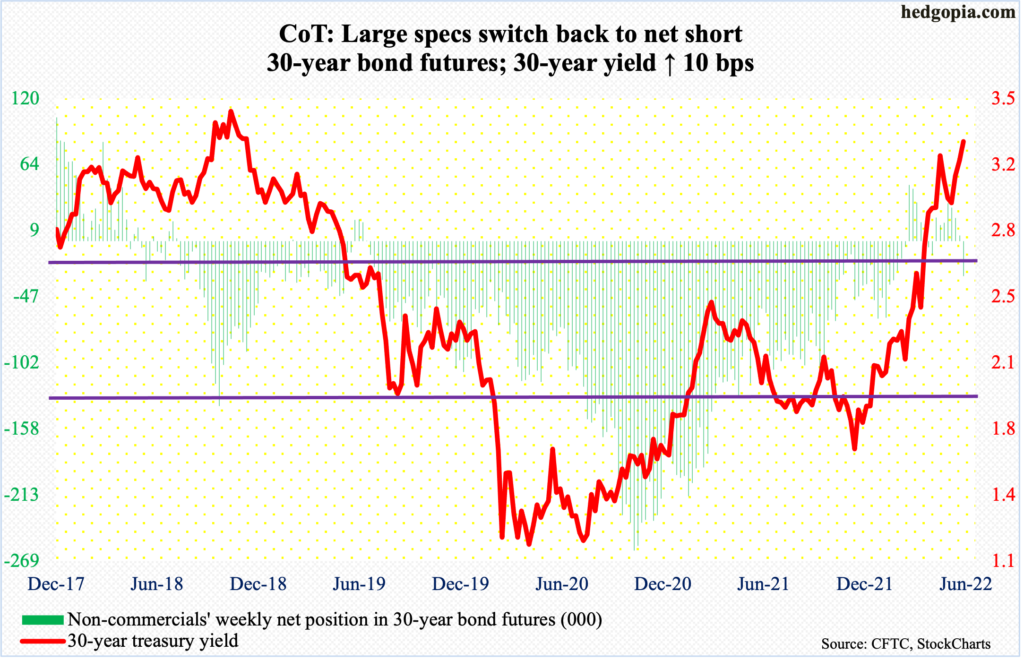
30-year bond: Currently net short 29.4k, up 34.4k.
Major economic releases for next week are as follows. Markets are closed Monday for observance of Juneteenth.
Existing home sales (May) are due out on Tuesday. April sales dropped 2.4 percent month-over-month to a seasonally adjusted annual rate of 5.61 million units – a 22-month low.
Friday has on dock new home sales (May) and the University of Michigan’s consumer sentiment index (June, final).
New home sales plunged 16.6 percent m/m in April to 591,000 units (SAAR), which is a two-year low.
June’s preliminary reading showed consumer sentiment tumbled 8.2 points m/m to 50.2 – the lowest ever going back to January 1978.
WTI crude oil: Currently net long 313.8k, down 31.5k.
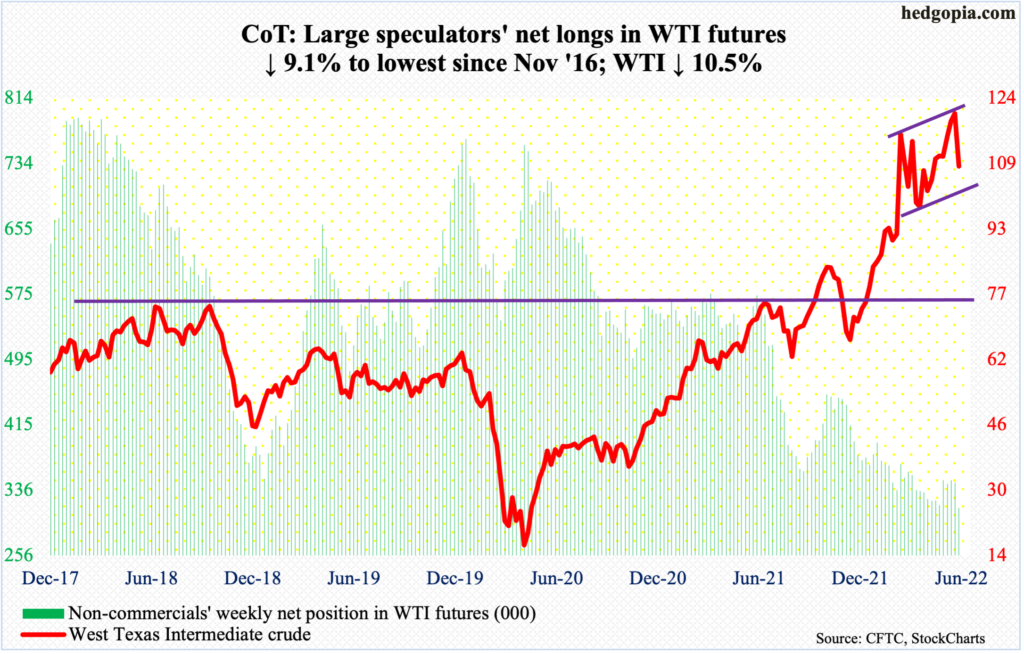
Tuesday’s intraday high of $123.68 surpassed last week’s high by $0.50 before offers overwhelmed bids. By the end of the week, WTI sliced through straight-line support just north of $117.
Earlier in March, the crude ticked $130.50, having rallied from $66.12 last December. A pattern of higher highs/higher lows in place since last April is still intact, but this week’s action following last week’s weekly long-legged doji is a warning shot across oil bulls’ bow. WTI plunged 10.5 percent this week.
The 50-day at $108.97 has been slightly breached. The average also approximates horizontal support going back to March. At $105 lies the lower end of the channel WTI ($107.99/barrel) is in.
In the meantime, US crude production in the week to June 10 increased 100,000 barrels per day to 12 million b/d, which is the highest since April 2020. Crude imports rose as well, up 831,000 b/d to seven mb/d. As did stocks of crude and distillates, which respectively grew two million barrels and 725,000 barrels to 418.7 million barrels and 109.7 million barrels. Gasoline inventory, on the other hand, declined 710,000 barrels to 217.5 million barrels. Refinery utilization decreased five-tenths of a percentage point to 93.7 percent.
E-mini S&P 500: Currently net long 34.3k, up 51.3k.
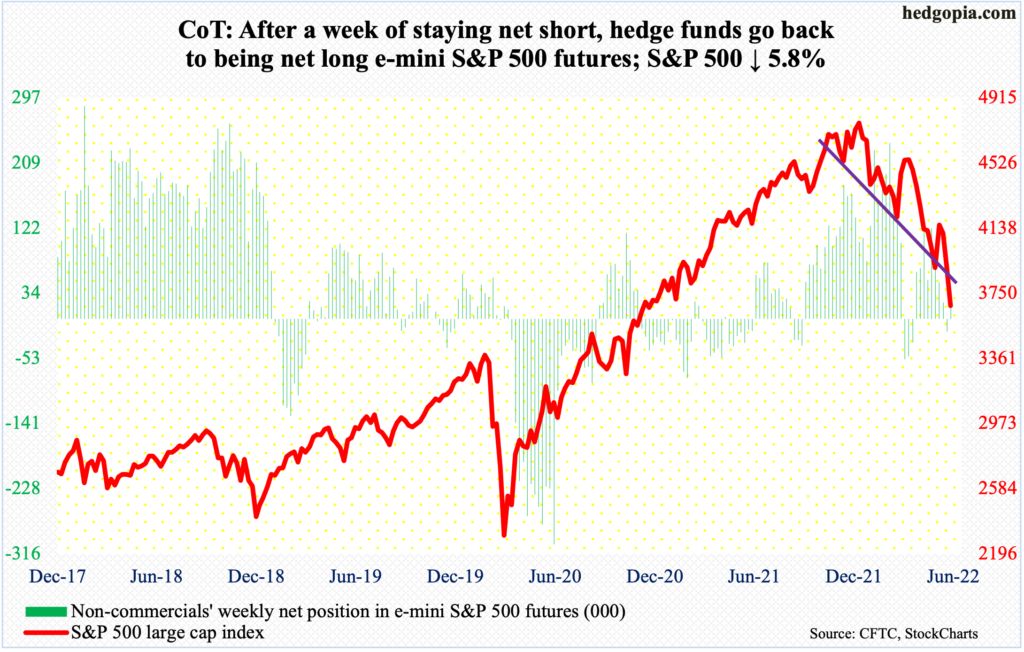
Bulls’ pain continued. The S&P 500 lost another 5.8 percent this week, following last week’s 5.1-percent tumble. This was the 10th down week in the last 11. From the January 4th high of 4819 through Friday’s low of 3637, the large cap index tumbled 24.5 percent.
Earlier on Wednesday, the index rallied on FOMC decision, but the session high of 3838 occurred right at Monday’s gap-down resistance; there was another gap-down in the preceding session.
The S&P 500 began to roll over on the 8th, a couple of sessions before last Friday’s red-hot inflation report for May. In only eight sessions through Friday, it tumbled 12.6 percent, slightly breaching the lower range of a descending channel in place since January (more on this here).
Not surprisingly, conditions are oversold. A relief rally can occur any time. In the event of one, gap-down resistance lies between 3830s and 4000. The index closed out the week at 3675, with a spinning top on Wednesday and Friday.
Euro: Currently net short 6k, up 56.6k.
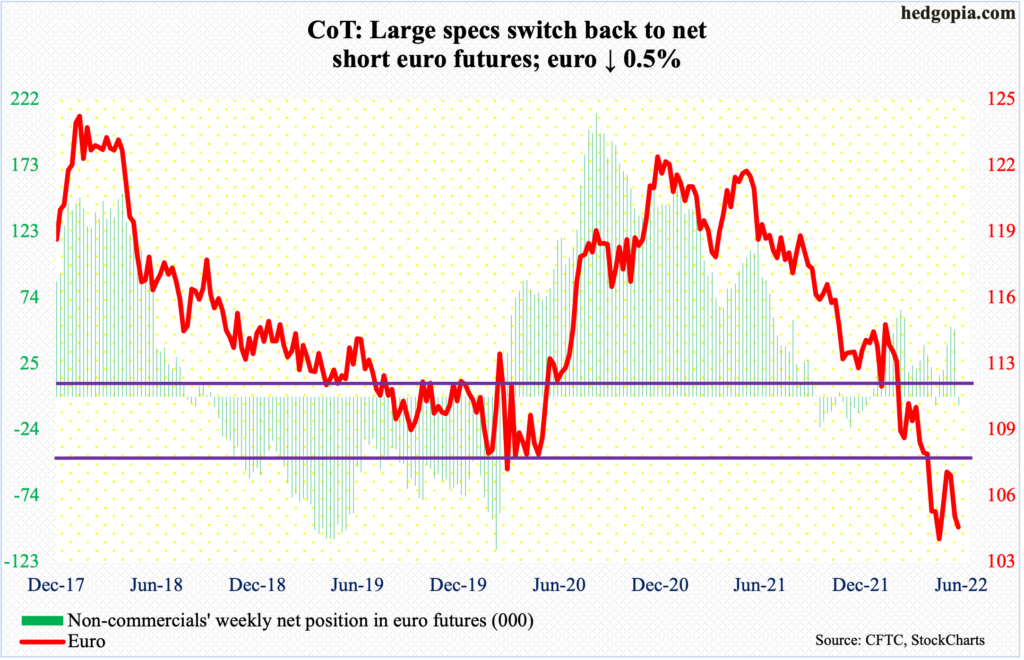
The European Central Bank held an emergency meeting on Wednesday, responding to rapidly appreciating bond yields; the spread between Italian and German yields widened to its highest since early 2020.
Markets want clarity on if the central bank would be willing to support highly indebted member countries. In the 19-member euro area, members share the euro but fiscally they are independent. This can create a situation in which one member country’s problem can spill over to others.
In this regard, the ECB said it would accelerate the completion of the design of a new anti-fragmentation instrument for consideration by the Governing Council. The euro ($1.0468) staged a hammer reversal on Wednesday, before rallying one percent on Thursday.
Wednesday’s low of $1.0358 matched the May 13 low of $1.0350, which was a successful retest of the January 2017 low of $1.0341.
Immediately ahead, there is straight-line resistance at $1.0570s, followed by $1.0750s.
Gold: Currently net long 154.6k, down 20.7k.
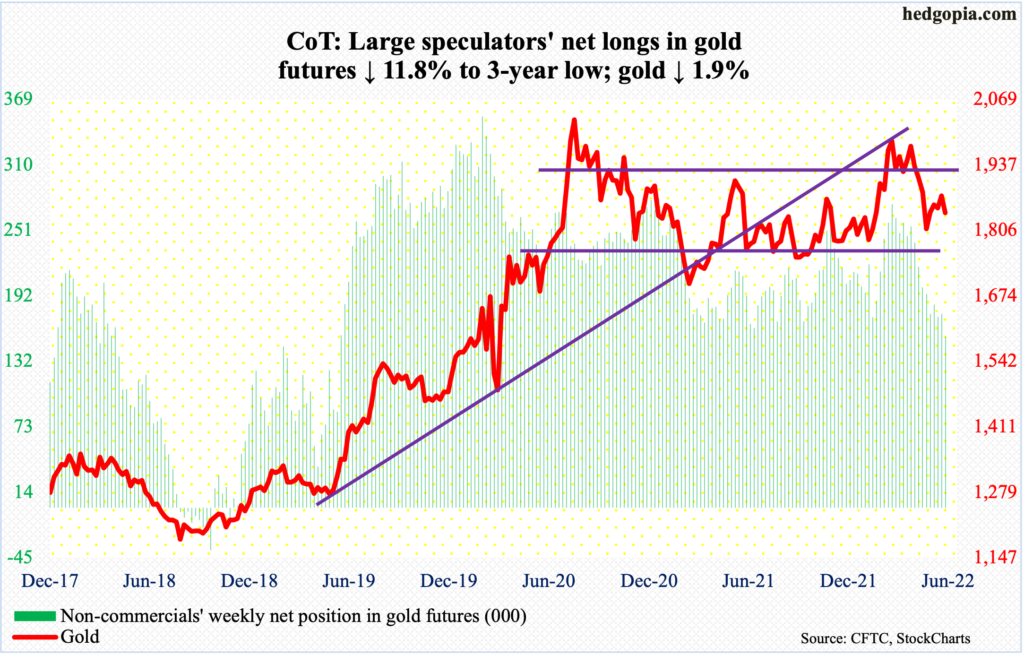
Last week, gold recaptured a broken rising trend line from last August – albeit slightly. This week, the metal ($1,841/ounce) got pushed back under it. That said, another rising trend line going back to March last year was defended, as Monday’s low of $1,806 landed right on that support, generating buying interest.
The yellow metal went on to lose 1.9 percent for the week anyway. As soon as the week began, gold bugs were denied at horizontal resistance at $1,870s, which also approximates the 50-day. The 200-day lies below at $1,843. In short, the metal finds itself sandwiched between layers of floor and ceiling.
Nasdaq 100 index (mini): Currently net long 28.4k, up 11.4k.
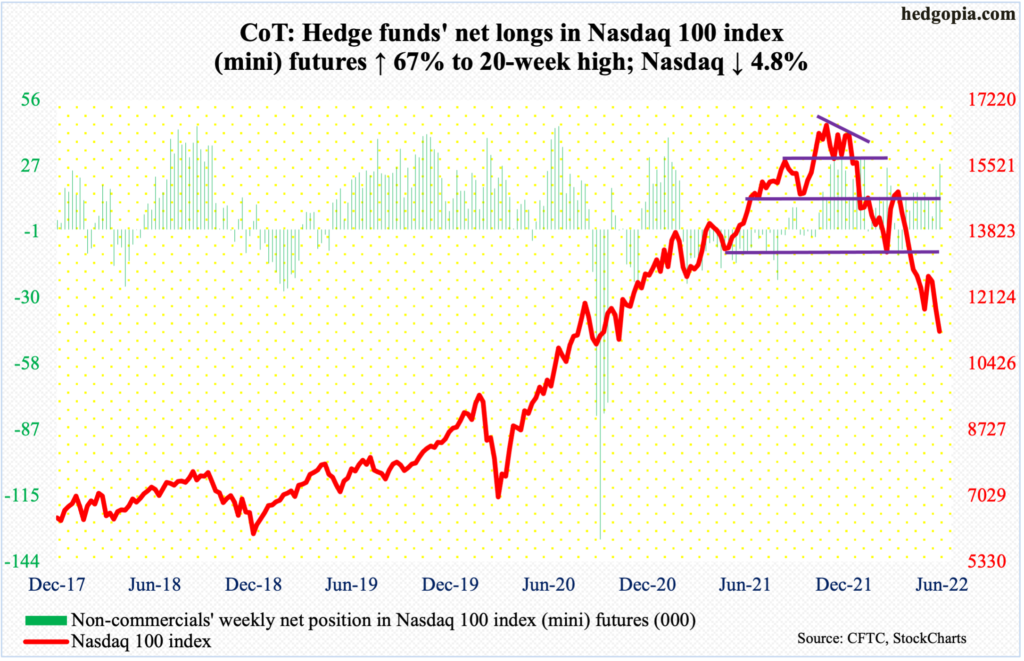
Post-FOMC rally attempt on Wednesday got stopped at Monday’s gap-down resistance as the Nasdaq 100 tagged 11751. This was followed by a four-percent plunge in the following session. From last November’s record high 16765 through Thursday’s low 11037, the tech-heavy index (11266) gave back 34.2 percent.
The consolation for bulls is that Thursday’s low kissed a falling trend line from late last year. This also coincides with horizontal support from last July. This is an opportunity for longs to at least try to stabilize things.
Russell 2000 mini-index: Currently net short 95.2k, up 21.7k.
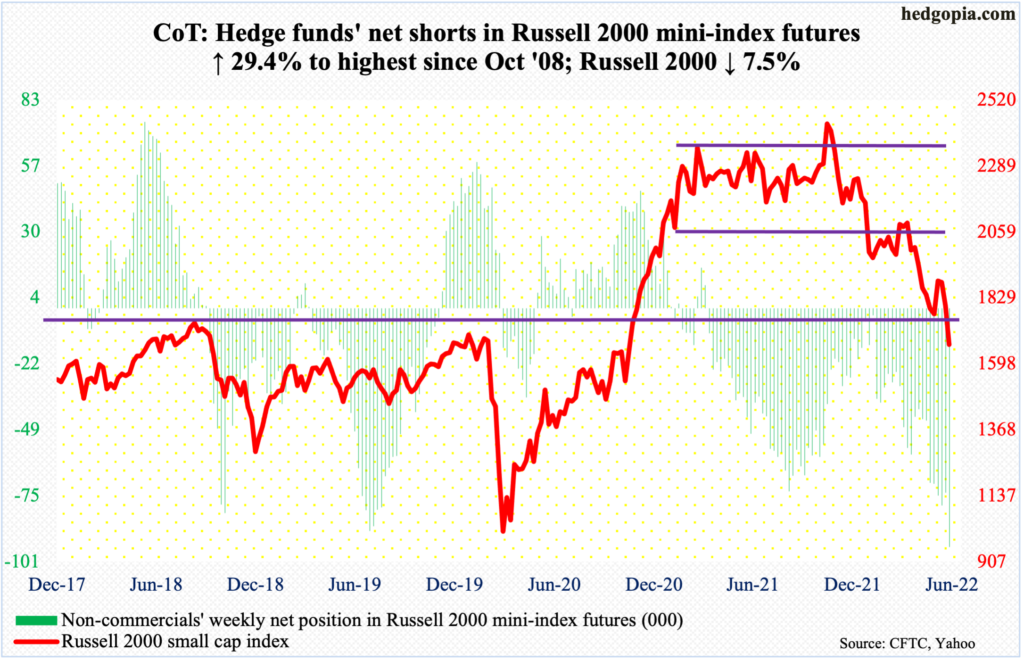
The Russell 2000 suffered yet another range breakdown this week.
Mid-January, a major breakdown occurred, losing 2080s; for 10 months, the small cap index went back and forth between 2080s and 2350s. Then for three months through late April, it played ping pong between 2080s and 1900 before breaching the support.
Two weeks ago, for the first time since suffering the late-April breach, 1900 was tested – unsuccessfully. Before that on May 12, a successful defense of a breakout from November 2000 occurred at 1701.
Last week, 1900 was lost. This week, 1700 was yielded. Through all this – from last November’s high 2459 through Thursday’s low 1641 – the Russell 2000 cratered 33.2 percent.
In the event of a reflex rally, which is looking likely, 1700 is where a bull-bear tug of war will unfold.
US Dollar Index: Currently net long 44.5k, up 6.5k.
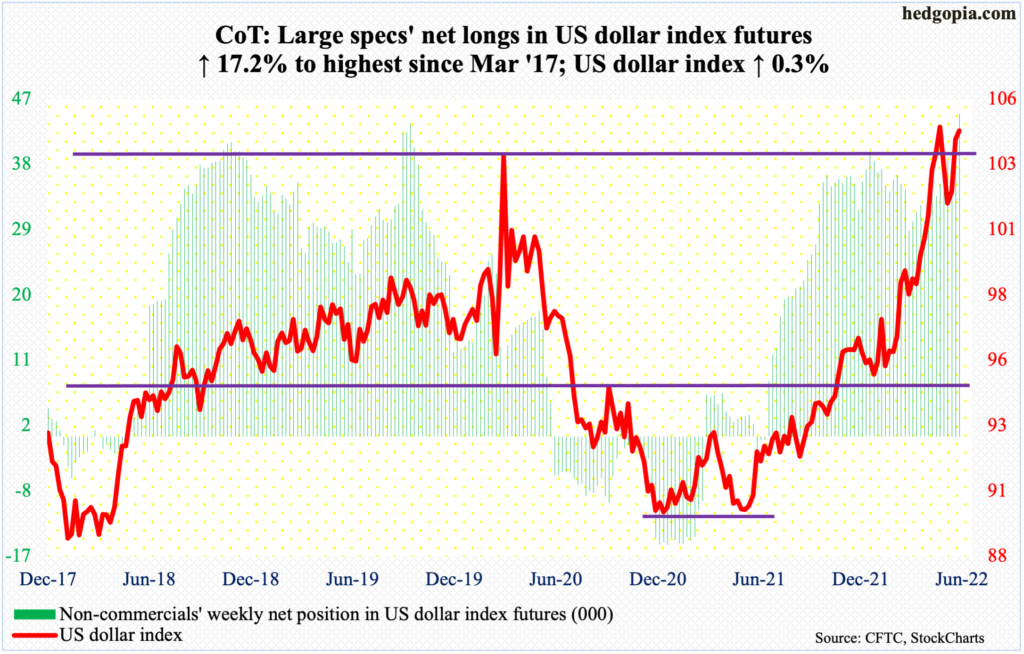
On Wednesday, the US dollar index reacted to FOMC decision by rallying initially but closing down with a daily spinning top; from 89.17 in January last year through the session high 105.56, it has had a big rally. A giveback is probably overdue.
On May 12, the US dollar index (104.49) broke out of just south of 104, which acted as a ceiling going back to January 2017. Bulls and bears are fighting for control of this level. As things stand, the latter probably hold an edge. On the weekly, a huge spinning top formed.
There is short-term horizontal support at 102.70s, which coincides with the 50-day at 102.58.
VIX: Currently net short 74.2k, up 16.9k.
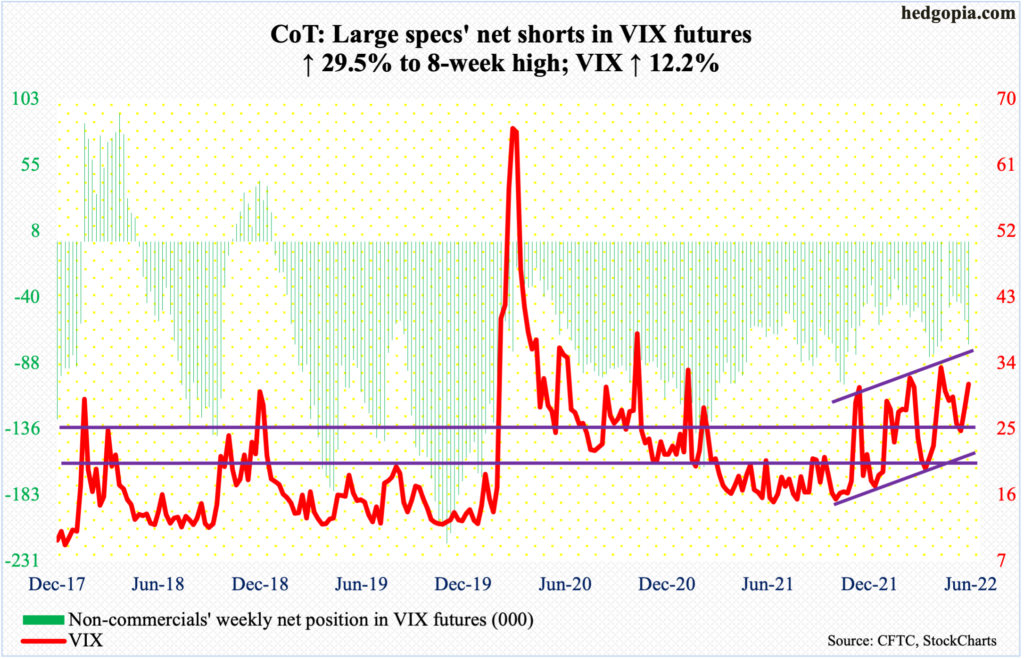
Through Thursday, the S&P 500 was down six percent, closing near its weekly low; VIX obviously went the other way, rallying 5.2 points, but at the same time was unable to hang on to all of its gains, having rallied to 35.05 intraday in the first four sessions but closing at 32.95. By the end of the week, it closed at 31.13.
Thursday’s was yet another lower high in a series of lower highs (on an intraday basis) since January this year when the volatility index tagged 38.94.
As things stand, the daily is itching to move lower. From volatility’s perspective, it was a volatile week, with a weekly spinning top.
Thanks for reading!
