Following futures positions of non-commercials are as of July 19, 2022.
10-year note: Currently net short 108.7k, up 333.
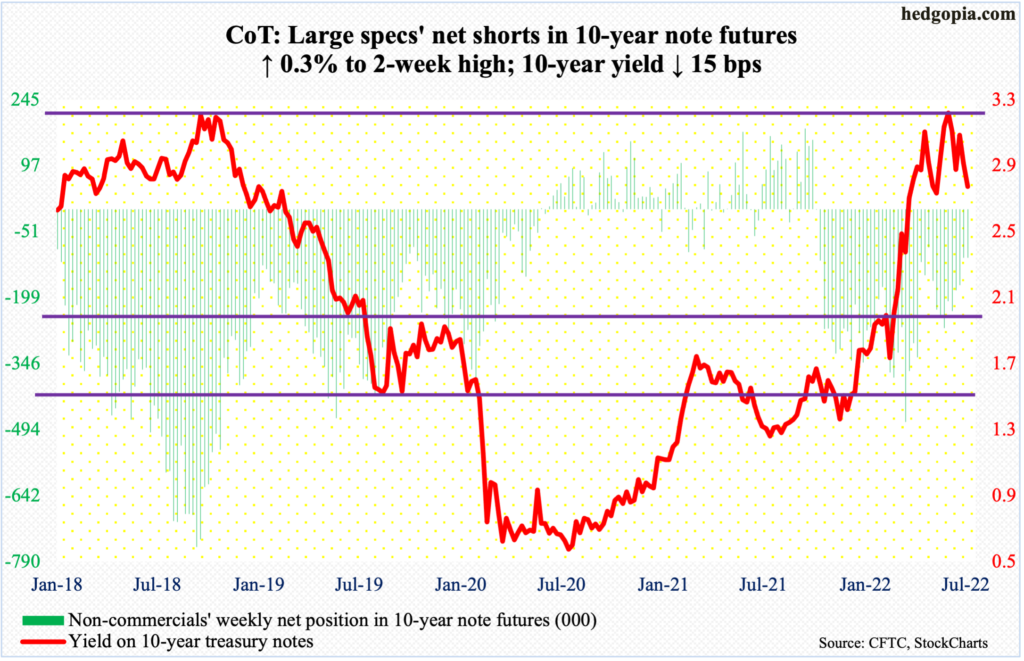
The FOMC meets next week. This will be the fifth of the eight scheduled meetings this year. The Federal Reserve will probably raise by 75 basis points.
Thus far in the current tightening cycle, it has raised three times – by 75 basis points in June, 50 in May and 25 in March – to a target range of 150 basis points to 175 basis points.
Immediately after June’s CPI report, published on the 13th, which showed headline inflation jumped 9.1 percent year-over-year, markets were quick in demanding a full percentage point increase in next week’s meeting. But after some jawboning from Federal Reserve officials, including Governor Christopher Waller, the consensus went back to pricing in a 75.
After the 26-27 meeting, markets are not sure what they want. For September, they are split right down the middle between 75 or 50, expecting to end the year between 325 basis points and 350 basis points. Until recently, they expected between 350 basis points and 375 basis points by the December meeting.
Inflation is red hot now but is showing signs of imminent moderation; core readings have softened, for instance. Futures traders are beginning to price this in – rightly so.
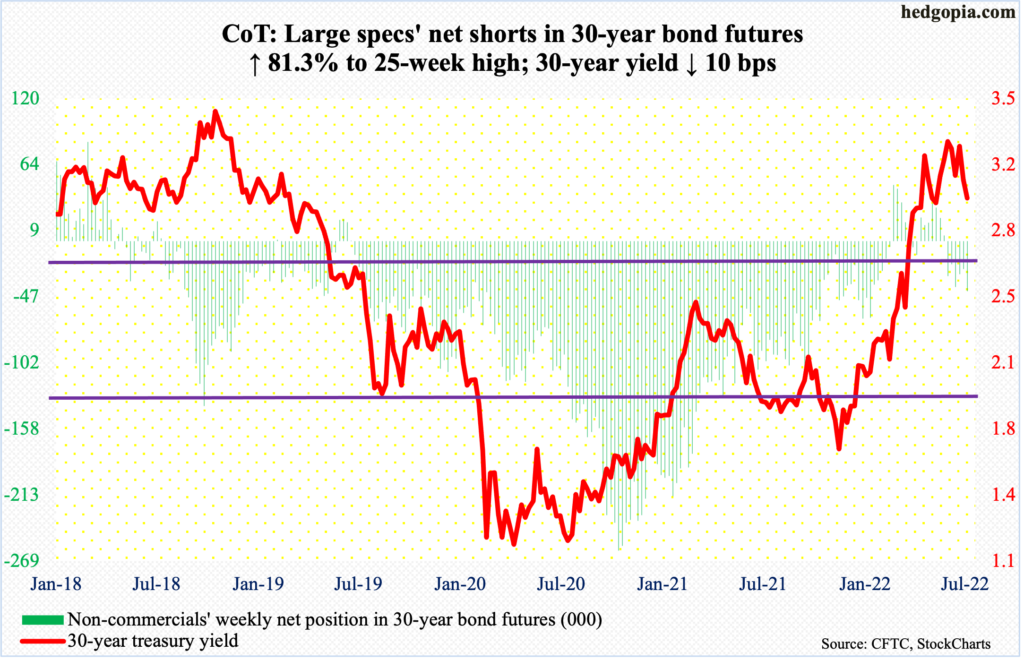
30-year bond: Currently net short 42.1k, up 18.9k.
Major economic releases for next week are as follows.
The S&P Case-Shiller home price index (May) and new home sales (June) are scheduled for Tuesday.
Nationally, US home prices surged 20.4 percent y/y in April, just shy of March’s record 20.6 percent.
Sales of new homes in May jumped 10.7 percent month-over-month to a seasonally adjusted annual rate of 696,000 units – a two-month high. Most recently, sales peaked at 839,000 last December; before that, they were 911,000 in January last year and 1.04 million in August 2000.
Durable goods orders (June) are on tap for Wednesday. Orders for non-defense capital goods ex-aircraft – proxy for business capex plans – increased 0.6 percent m/m in May to $73.5 billion, which was a new record.
GDP (2Q22, first estimate) will be published on Thursday. For the first time in seven quarters, real GDP contracted 1.6 percent in 1Q22. The Atlanta Fed’s GDPNow model is forecasting the economy to shrink by the same magnitude in 2Q.
Friday brings personal income/spending (June), the employment cost index (2Q22) and the University of Michigan’s consumer sentiment index (July, final).
In the 12 months to May, headline and core PCE (personal consumption expenditures) rose 6.3 percent and 4.7 percent respectively. They respectively peaked in March and February this year at 6.6 percent and 5.3 percent, which were the highest since January 1982 and April 1983, in that order.
In 1Q22, private-industry total compensation grew 4.8 percent from a year ago. This was the sharpest pace since 3Q90.
July’s preliminary reading showed consumer sentiment rose 1.1 points from June’s record low 50.
WTI crude oil: Currently net long 278.4k, up 12.1k.
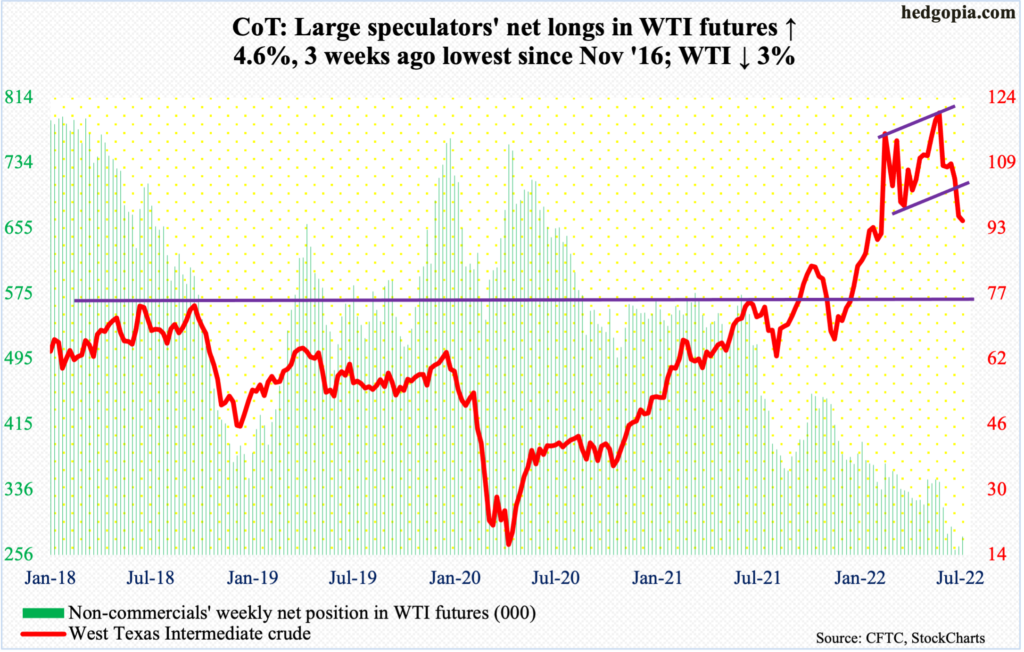
After last Thursday’s successful test of the 200-day, WTI ($94.70/barrel) tried to rally off of the average this week but managed to only hover just above it ($93.92).
The crude rallied as high as $100.99 on Tuesday and that was it. It ended the week lower three percent – its third consecutive down week and fifth in six.
On June 14, WTI rolled over after tagging $123.68 intraday, which was a lower high versus $130.50 posted on March 7. The subsequent selloff stopped just below horizontal support at $93-$94, which in all probability gets tested again, with breach risks rising.
In the meantime, per the EIA, US crude production in the week to July 15 declined 100,000 barrels per day to 11.9 million b/d. As did crude imports which decreased 156,000 b/d to 6.5 mb/d. Stocks of crude and distillates decreased as well – down 445,000 barrels and 1.3 million barrels respectively to 426.6 million barrels and 112.5 million barrels. Gasoline inventory, on the other hand, grew 3.5 million barrels to 228.4 million barrels. Refinery utilization dropped 1.2 percentage points to 93.7 percent.
E-mini S&P 500: Currently net short 208.1k, down 7.4k.
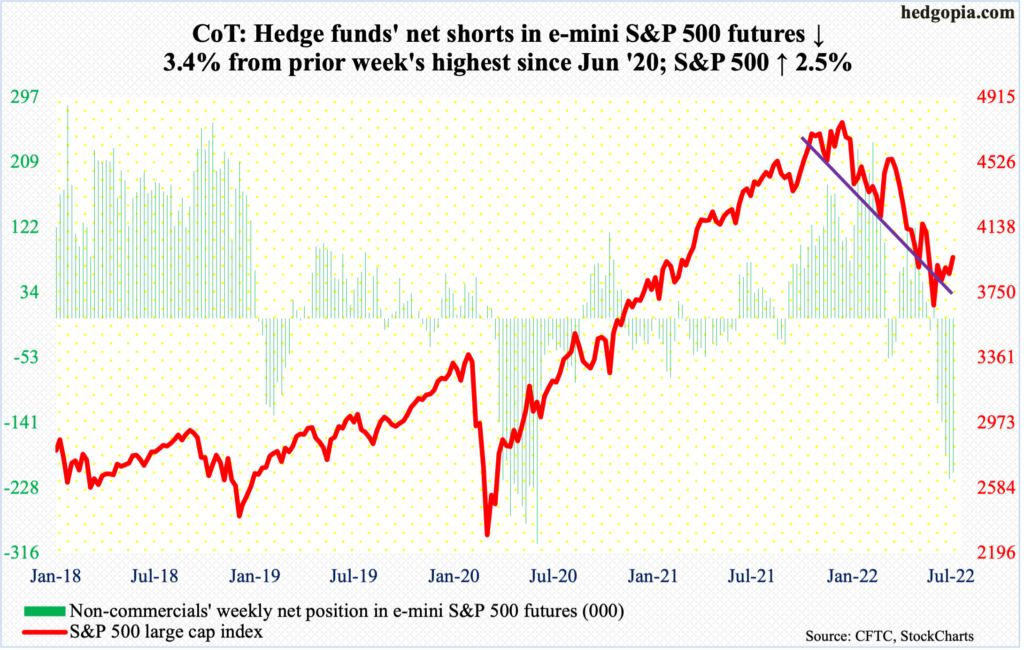
Equity bulls successfully built on the positive momentum seen in the latter sessions last week; on both Wednesday and Thursday, there was willingness to buy weakness (more on this here).
This week, the week started out weak, but by Tuesday, the 50-day was reclaimed, followed by defense of the average on both Wednesday and Thursday.
The daily is beginning to get extended but there is plenty of room to rally on the weekly. On Friday, selling orders intensified as soon as the gap from June 10 got filled. In the event this does not entice continued selling, the next decent resistance is not until 4160s. The S&P 500 closed out the week at 3962, up 2.5 percent for the week.
Euro: Currently net short 42.7k, up 17.5k.
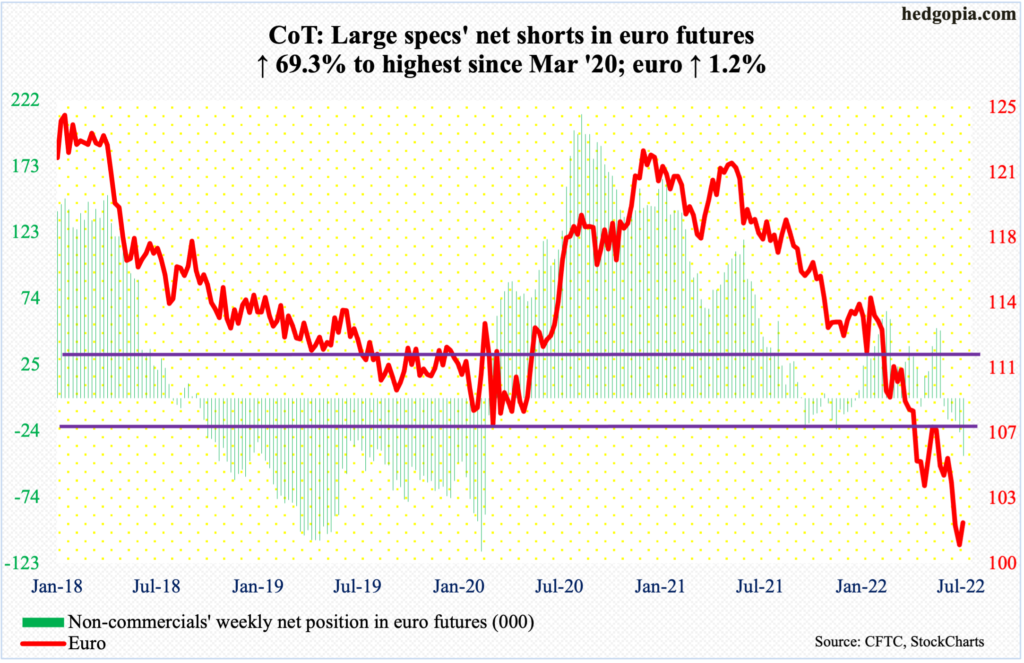
The European Central Bank Thursday raised the deposit rate – its key interest rate – by 50 basis points to zero percent. This was the first hike in 11 years.
It also introduced a policy tool called a Transmission Protection Instrument with an aim to limit the divergence in borrowing costs across the euro zone, which is made up of 19 member countries. Italy, where rates have spiked in recent months, is one of the countries the new tool is expected to help. Details are yet to come.
In reaction, the euro Thursday had a volatile session to end up 0.5 percent. For the week, it rose 1.2 percent – its first up week in four and second in eight. The euro has come under pressure since hitting $1.2345 in January last year. (Depreciation of the euro adds to upward inflationary pressure, among others.)
Leading up to this week’s meeting, the currency breached parity last week, touching $0.9998 and $0.9952 on Wednesday and Thursday, before reversing higher.
The euro ended the week at $1.0206. Just above lies important lateral resistance at $1.0350s; this would have also filled a July 5th gap. After this lies crucial $1.04-$1.05, which, once reclaimed, would mark a shift in trend.
Gold: Currently net long 95k, down 23.2k.
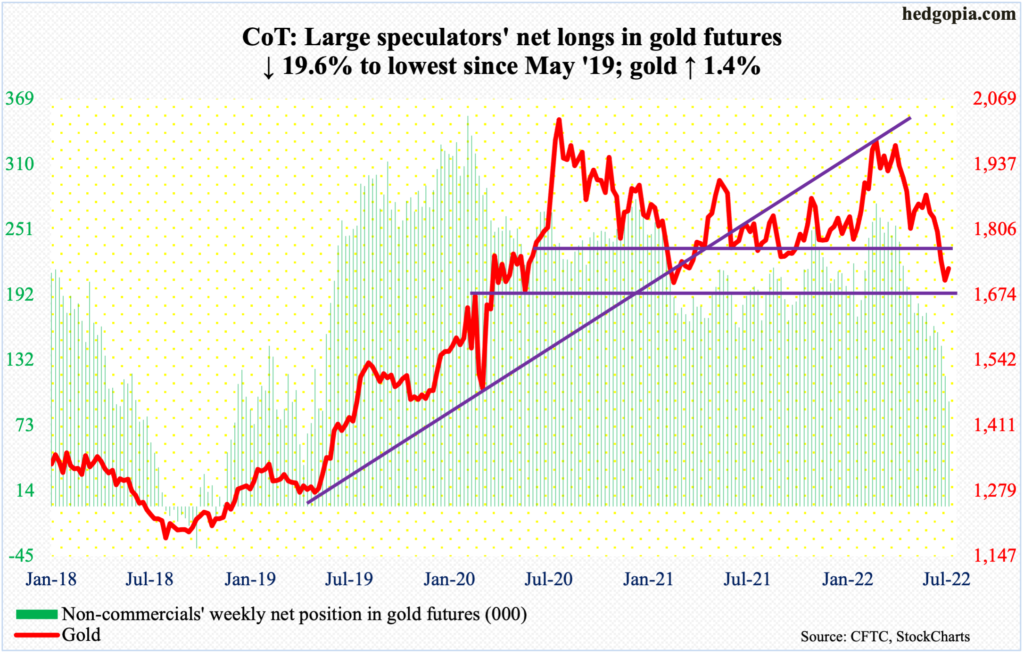
Thursday’s test of $1,670s has been successful; after tagging $1,678, gold closed the session at $1,713, ending the week at $1,727/ounce, up 1.4 percent – its first up week in six.
This preceded a loss two weeks ago of $1,760s-$1,770s, which acted as an important price point for both bulls and bears going back more than a decade.
Earlier in March (this year), the metal touched $2,079 – just shy of the record high $2,089 set in August 2020. Most recently, gold has been under pressure since June 13 when it was rejected at $1,882 just under the 50-day.
The path of least resistance is up. The next level to watch is $1,760s-$1,770s.
Nasdaq 100 index (mini): Currently net long 28.1k, up 8.7k.
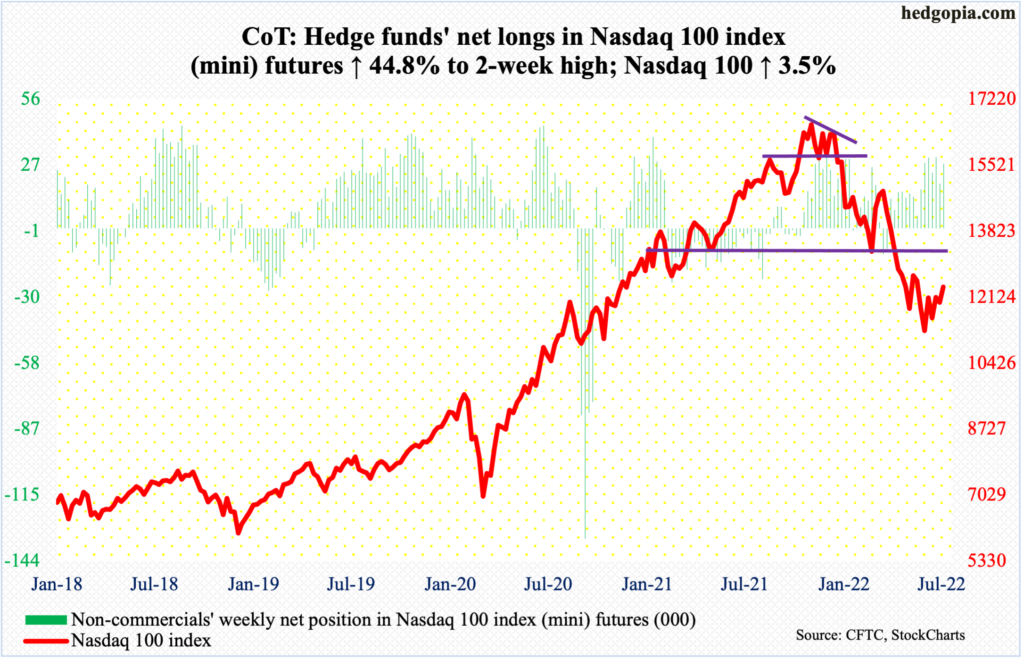
The Nasdaq 100 (12396) has made higher lows since it bottomed at 11037 on the 16th last month. Through that low, the tech-heavy index plunged 34.2 percent from last November’s high 16765. Last week, bulls defended that trend line.
This week, they took care of straight-line resistance at 12170s on Tuesday, followed by the filling of June 10th gap in the next session. The 50-day is no longer dropping – is flattish. Ahead, bulls will score a major victory once they recapture 13000.
Next week, tech heavy hitters will report their June quarter. Microsoft (MSFT) and Google owner Alphabet (GOOG) will report on Tuesday, Facebook owner Meta Platforms (META) on Wednesday, Apple (AAPL), Amazon (AMZN) and Intel (INTC) on Thursday. For market cap-weighted indices like the Nasdaq 100 and S&P 500, these results will matter a lot. Fingers crossed!
Russell 2000 mini-index: Currently net short 100.7k, down 17.1k.
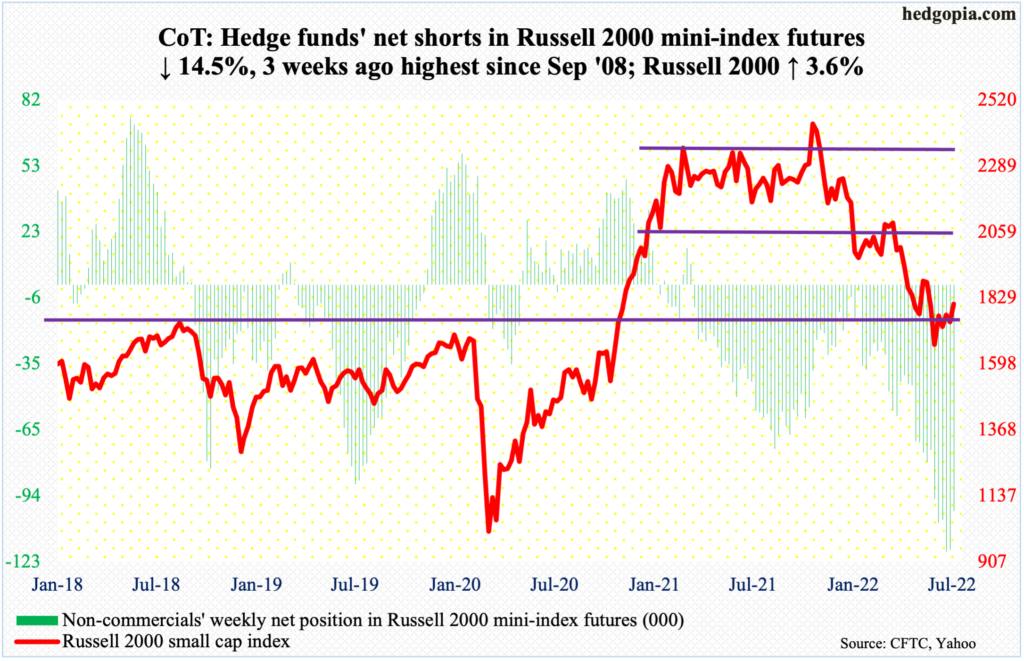
The Russell 2000 (1807) rallied 3.6 percent this week, tagging 1842 intraday Friday but only to get rejected at a falling trend line from last November when the small cap index peaked at 2459. A rally past this trend line opens the door toward 1900.
Before this week’s action, bulls successfully defended 1700, but not before suffering a 33.2-percent plunge between last November’s peak and last month’s trough at 1641; 1700 is where the Russell 2000 broke out of in November 2000.
Earlier, a major breakdown occurred mid-January, losing 2080s; for 10 months, the small cap index went back and forth between 2080s and 2350s. It then seesawed between 2080s and 1900, followed by a ping pong match between 1900 and 1700.
US Dollar Index: Currently net long 39.1k, up 715.
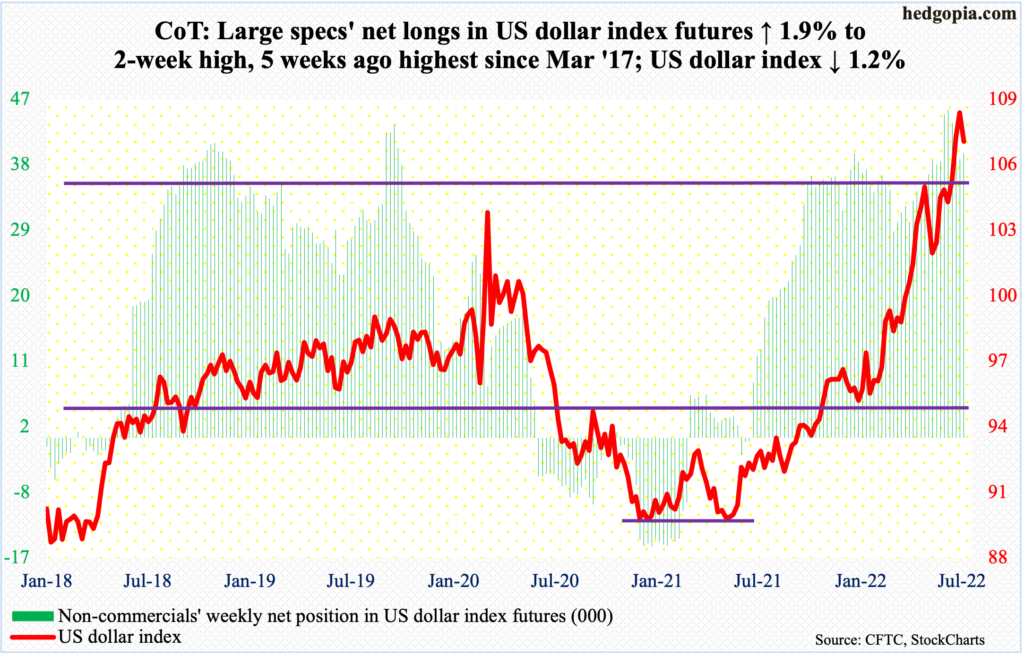
Last week, there were subtle signs of distribution, marked by a back-to-back spinning top on Tuesday and Wednesday and a shooting star on Thursday; Thursday’s intraday high of 109.14 was the highest print since June 2002. Earlier in January last year, the US dollar index (106.62) bottomed at 89.17.
A process to unwind the resulting overbought condition is likely underway. This week, the index gave back 1.2 percent.
A crucial breakout retest lies ahead. A couple of weeks ago, the index broke out of 105, and out of 104 before that last month, with the latter acting as a ceiling going back to January 2017. A loss of 104 will be a major negative development for dollar bulls.
VIX: Currently net short 69.9k, up 3.5k.
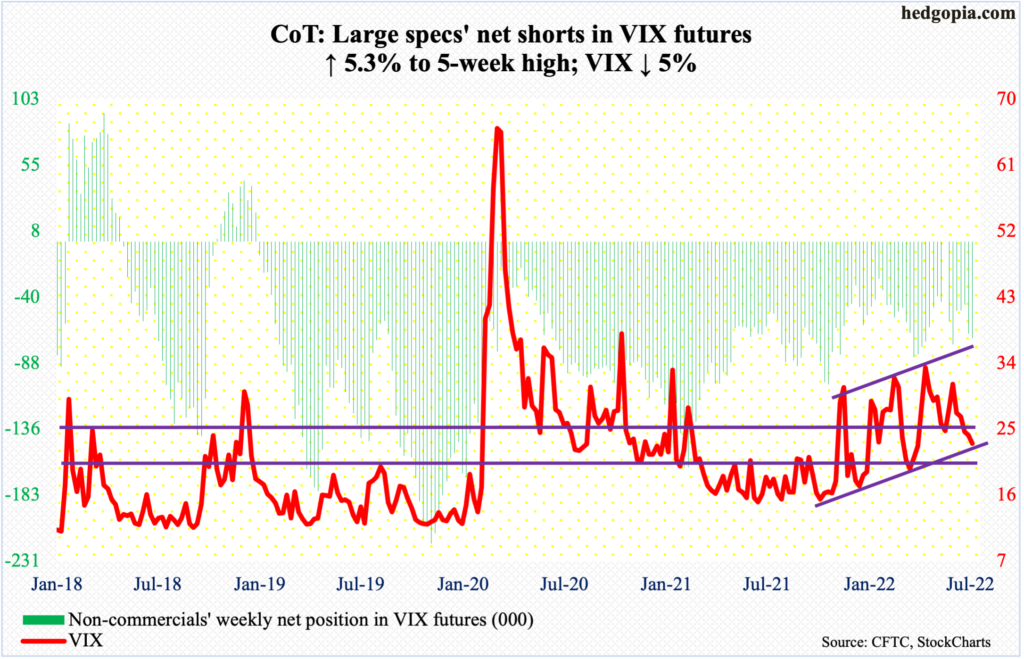
VIX lost the 200-day on Wednesday. This was the first time since April the volatility index went back below the average.
In November 2017, VIX made an all-time low of 8.56. It has consistently made higher lows since then, and this trend line does not get tested until 16.50. This is a worse-case scenario for volatility bulls.
Immediately ahead, there is horizontal support at low-20s, which also coincides with a rising trend line from last November when VIX (23.03) bottomed at 14.73. On Friday, it dropped to 22.41 intraday.
Thanks for reading!

