
Following futures positions of non-commercials are as of January 10, 2023.
10-year note: Currently net short 411.4k, up 27.8k.
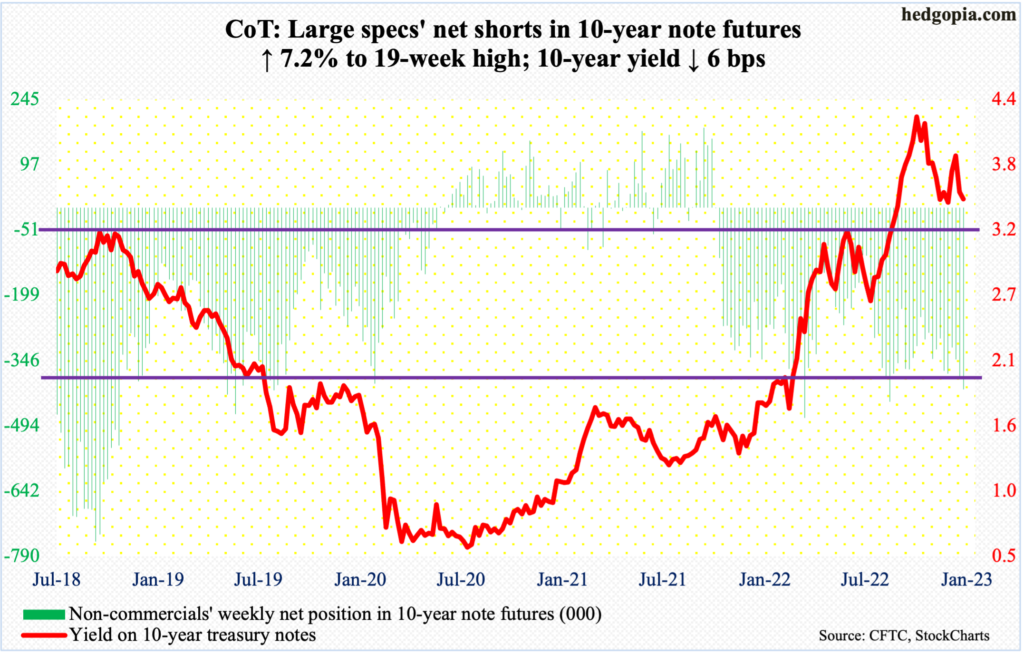
Federal Reserve Chair Jerome Powell has his hands full. He wants to slow down the US economy to bring inflation under control. Consumer inflation is decelerating but remains elevated.
In the 12 months to December, headline and core CPI (consumer price index) – out Thursday – respectively grew 6.4 percent and 5.7 percent. They peaked at 9.1 percent and 6.6 percent last June and September, in that order.
Powell has been consistent in his messaging that the Fed needs to deal with high inflation. The central bank has raised the fed funds rate from zero to 25 basis points last March to the current 425 basis points to 450 basis points. At the December 13-14 meeting, the dot plot projected rates would peak early this year at 5.1 percent.
Markets disagree. Futures traders continue to forecast the benchmark rates to peak south of five percent by March and for the Fed to begin to cut in December.
Besides, consumer sentiment is on the mend, with the University of Michigan’s consumer sentiment index rising 4.9 points this month (preliminary) from December’s 59.7. Stocks are rallying, and that is a big problem. Monetary policy works through financial markets. As things stand, both bonds and stocks are rallying, easing financial conditions, which runs counter to the Fed’s tightening campaign.
Historically, the Fed, when it is all said and done, has tended to listen to the markets. This time around, Powell may be an exception than a rule.
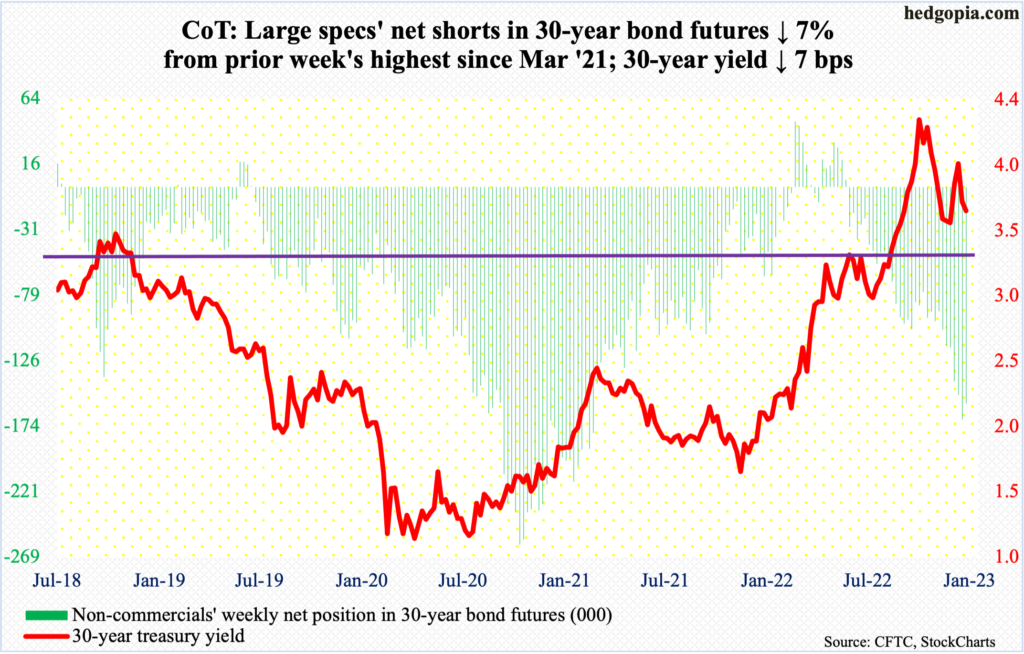
30-year bond: Currently net short 157.4k, down 11.9k.
Major economic releases for next week are as follows. Markets are closed Monday for observance of Martin Luther King Jr. Day!
Retail sales (December), industrial production (December), the NAHB housing market index (January) and Treasury International Capital data (November) are scheduled for Wednesday.
November retail sales dropped 0.6 percent from October’s record $693.5 billion (seasonally adjusted annual rate).
Capacity utilization dropped 0.3 percent month-over-month in November to 79.7 percent – a nine-month low. The cycle high 80.2 percent was hit last April.
Homebuilder confidence in December slid a couple of points m/m to 31, which was the lowest print since April 2020.
In the 12 months to October, foreigners sold $285.9 billion in US stocks – just slightly less than August’s record net sales of $293.5 billion.
Thursday brings housing starts (December). Starts inched down 0.5 percent m/m in November to 1.43 million (SAAR) – a four-month low.
Existing home sales (December) are on tap for Friday. November sales declined 7.7 percent m/m to 4.09 million units (SAAR); a year ago, sales were growing at an annualized clip of 6.33 million.
WTI crude oil: Currently net long 251.1k, down 19.9k.
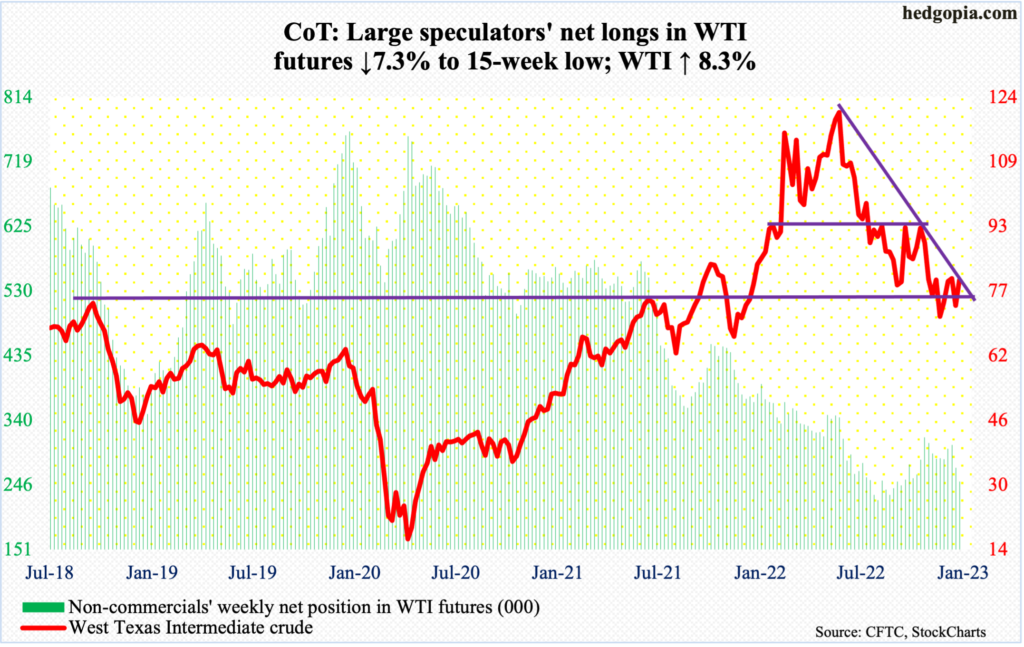
WTI rallied for seven consecutive sessions to end the week just above the 50-day at $79.48. This was the first time since November 15 last year that the crude ($79.86/barrel) closed above the average.
This week, WTI rallied 8.3 percent to also reclaim broken support at $75-$76. Next week is key, as the crude finished the week right at a falling trend line from last June when it peaked at $123.68, which was a lower high after hitting $130.50 in March.
There is room to rally. Should the trendline in question yield, the path toward $84-$85 becomes easy.
In the meantime, as per the EIA, US crude production in the week to January 6 increased 100,000 barrels per day to 12.2 million b/d. Crude imports grew 638,000 b/d to 6.3 mb/d. Stocks of crude and gasoline rose as well – by 19 million barrels and 4.1 million barrels respectively to 439.6 million barrels and 226.8 million barrels. Distillate inventory, however, decreased 1.1 million barrels to 117.7 million barrels. Refinery utilization jumped 4.5 percentage points to 84.1 percent.
E-mini S&P 500: Currently net short 213.2k, up 45.9k.
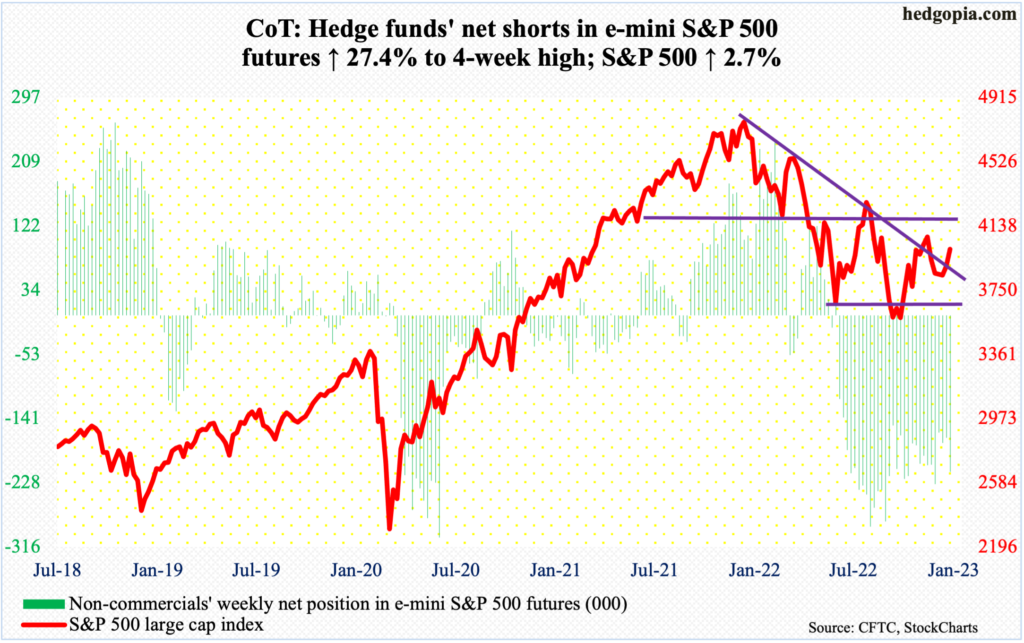
The S&P 500 rallied 2.7 percent this week to finish right on potentially crucial resistance. This came on the heels of last week’s hammer and a weekly dragonfly doji and a spinning top before that (more on this here).
The large cap index was coiled. This week’s rally placed it just under a falling trend line (on an intraday basis) from last January when it peaked at 4819. Subsequently, the index bottomed at 3492 last October. This week, it closed at 3999 – past both the 50- and 200-day (3914 and 3981 respectively).
In the best of circumstances, bulls have a shot at 4100. This will have further extended an already overbought condition on the daily. In the event of downward pressure – likely – they need to defend 3900; else, momentum once again will shift the bears’ way.
Euro: Currently net long 135k, up 5.1k.

Last Friday, the euro formed an outside day, which often signals a potential change in trend. This Monday, the currency gapped up to again attack lateral resistance at $1.07-$1.08. This level has proven to be important for bulls and bears alike going back several years, and it decisively gave way on Thursday, closing out the week at $1.0832.
Earlier, the euro bottomed at $0.9559 late September last year and has obviously come a long way. That said, momentum remains with the bulls as long as they hold $1.07-$1.08.
Gold: Currently net long 150.5k, up 8.9k.
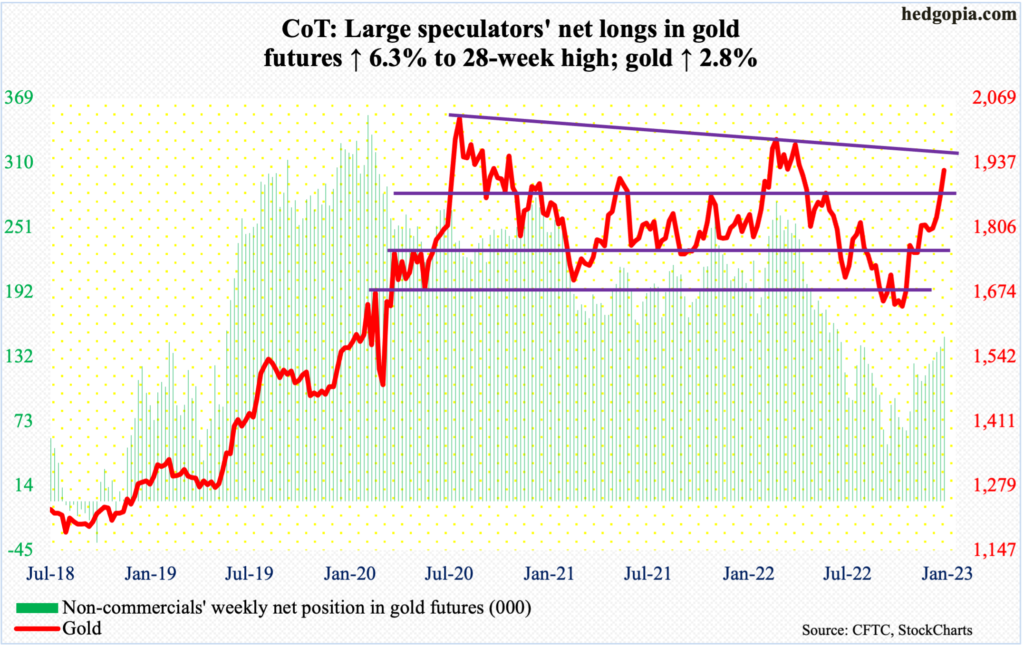
Gold bugs struggled at $1,820s for several weeks before recapturing it late last year/early this year. Since then, they have not looked back.
Gold rallied 2.8 percent this week – following last week’s 2.4 percent jump – to $1,922/ounce. Non-commercials have ridden this rally well as they have been adding for the last several weeks.
Trendline resistance (on an intraday basis) from August 2020 when gold peaked at $2,089 lies at $1,960. A breakout opens the door toward $2,080s, which was again hit in March last year.
Nasdaq 100 index (mini): Currently net short 8.2k, up 9.5k.
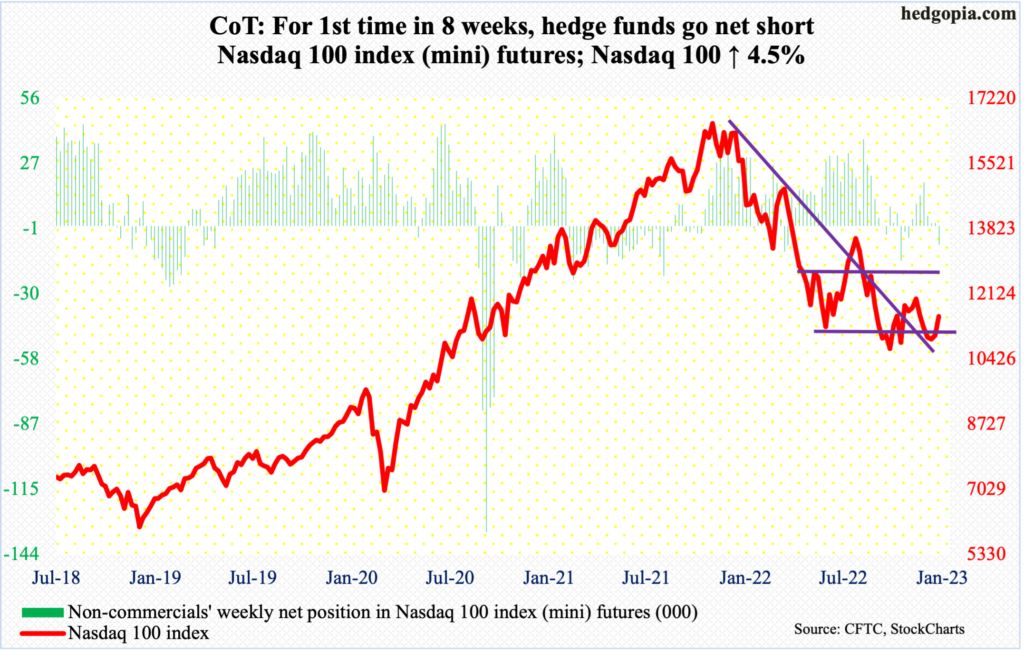
Last Friday, tech bulls defended straight-line support at 10670s; last October, the Nasdaq 100 bottomed at 10441. This week, it was up in all five sessions, rallying 4.5 percent for the week. The move follows a back-to-back dragonfly doji on the weekly.
In recent weeks, the Nasdaq 100 has underperformed other major US equity indices such as the S&P 500. This week’s relative outperformance speaks of investor willingness to own tech ahead of 4Q22 results from tech heavyweights the next couple of weeks.
Non-commercials, however, are not so sure. For the first time in eight weeks, they went net short Nasdaq 100 index (mini) futures.
Russell 2000 mini-index: Currently net short 58.1k, down 7.2k.
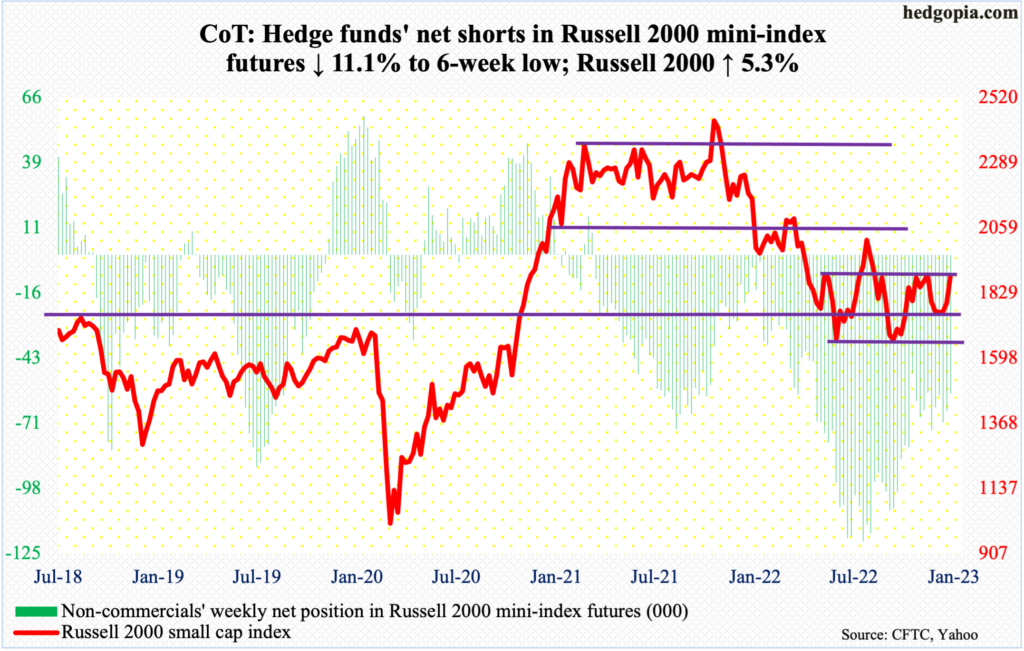
Once again, small-cap bulls are back at the top end of a 200-point range on the Russell 2000, closing out the week at 1887. For a year now, the small cap index has gone back and forth between 1700 and 1900.
In the middle of November and early December, there were several rejections at 1900. After that, bids showed up well before 1700 could be tested in earnest. The bears tried several times to reclaim 1700, but to no avail. The question is if they will double down now at range top.
Next week is a make-or-break.
US Dollar Index: Currently net long 16.5k, down 1.2k.
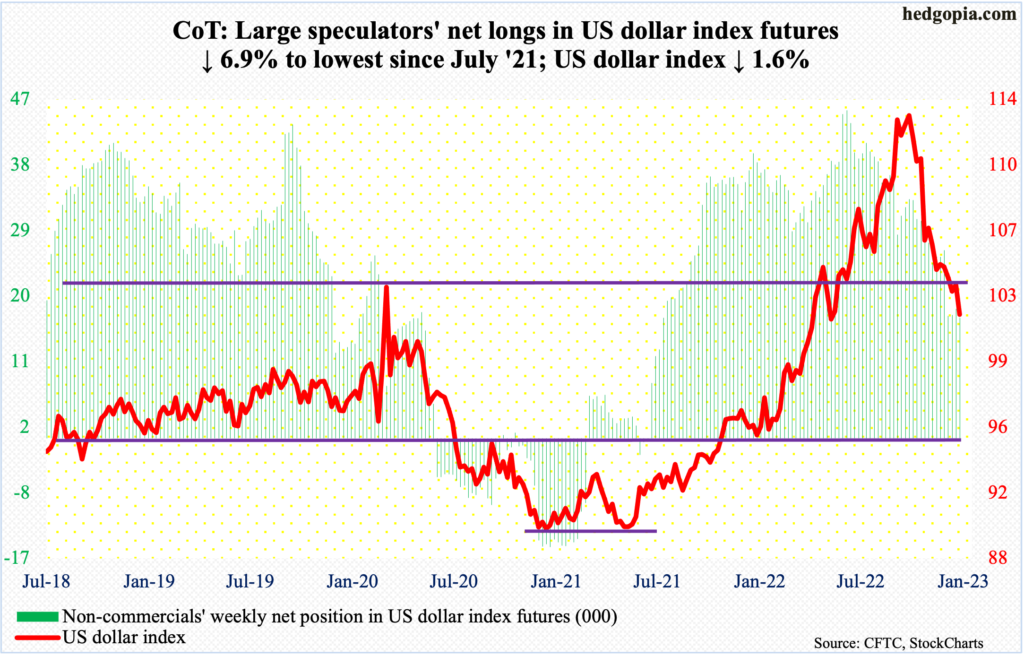
The US dollar index just lost a potentially crucial support.
Last week, dollar bulls were unable to hang on to Friday’s intraday high of 105.50, closing the session/week at 103.65, which was the second week in a row the index closed below 104, which goes back to at least 2017. But the breach was not decisive just yet.
This week, the index sliced through 104 as soon as the week began on Monday. By Friday, 101.72 was ticked intraday to end the week at 101.95.
With January halfway through, the US dollar index is down 1.3 percent. If this holds, this would be the fourth straight down month, having peaked at 114.75 last September.
With the loss of 104, odds favor the index is headed much lower in due course, although conditions are oversold on the daily and weekly. The next level to watch is 101. In the event of a rally, 104 is where selling can intensify.
VIX: Currently net short 72.8k, up 4.8k.
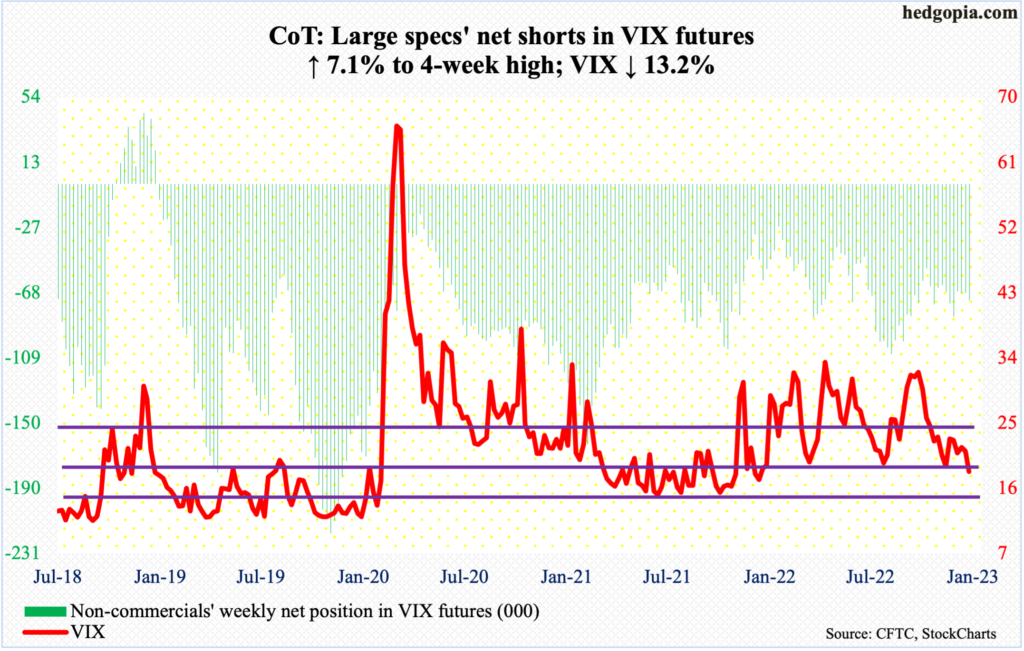
Volatility bulls could no longer hold 19, which, going back to last March/April had not been breached. This week, VIX gave back 2.78 points to close at 18.35. This followed several rejections at the falling 50-day (now 22.26) as soon as 2023 got underway.
If volatility bears had their way, they would like to go test the next layer of horizontal support at 15-16. Incidentally, a rising trend line from November 2017, when VIX reached an all-time low 8.56, gets tested around 16.50.
Fingers crossed!
Thanks for reading!
