
Following futures positions of non-commercials are as of March 21, 2023 (data is now current, with publication this week of two weeks’ worth of data).
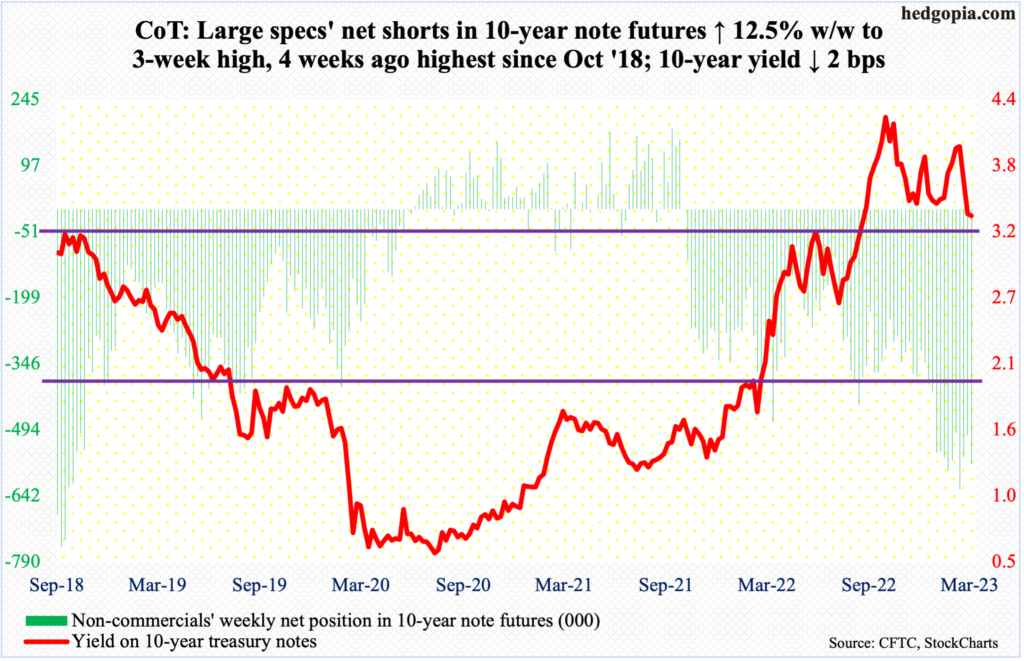
10-year note: Currently net short 571k, up 63.7k.
Federal Reserve Chair Jerome Powell stood his ground. In this week’s FOMC meeting, the fed funds rate was raised by 25 basis points to a range of 475 basis points to 500 basis points. This was in line with what the futures market had priced in. Where the two differed was how the tightening cycle was expected to evolve for the rest of the year.
Going into the meeting, futures traders expected the Fed to raise one more time in May – between 500 basis points and 525 basis points – and then begin to lower by June, ending the year at 425 basis points to 450 basis points. In the post-meeting press conference, Powell declared “Fed officials just don’t see rate cuts this year.” The dot plot continued to show a 5.1 percent median estimate for end-2023 – unchanged from the last update in December.
As things stand, the Fed just does not believe the Silicon Valley Bank (SVB) collapse is serious enough for it to change its currently dogged focus on inflation, which is trending lower but remains elevated. Futures traders, on the other hand, have now gone back to not expecting a hike in May – meaning the fed funds rate already peaked at 475 basis points to 500 basis points – pricing in at least three, maybe even four, 25-basis-point cuts by December. The chasm between what the market wants and what the Fed is ready to give is very wide.
Someone has to blink.
Thus far, Powell has managed to put the so-called ‘Fed put’ to rest. He is departing from how things were handled by his predecessors – from Alan Greenspan to Ben Bernanke to Janet Yellen – who immediately resorted/switched to accommodative policy anytime there were signs of problems. This only helped spoil the traders, who not surprisingly are wasting no time in demanding a much looser monetary policy using the SVB collapse as a pretext. Powell, who is essentially saying either the issues at SVB or Credit Suisse will not spread into the wider banking sector or that sooner or later the Fed put needed to be put away, deserves kudos for saying enough is enough. So far so good.
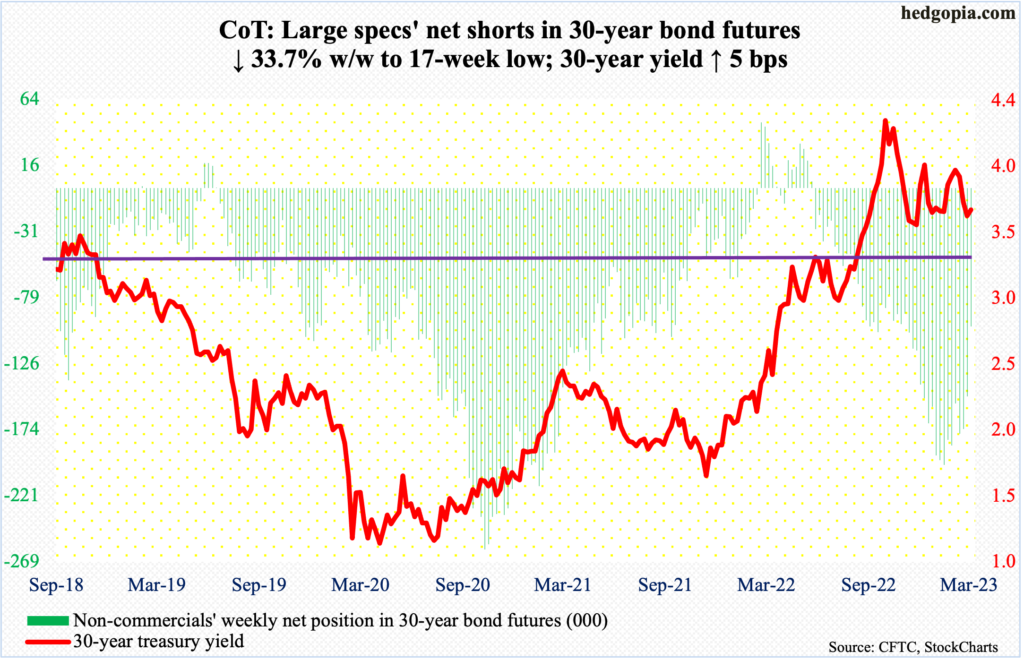
30-year bond: Currently net short 99.4k, down 50.6k.
Major economic releases for next week are as follows.
The S&P Case-Shiller home price index (January) is scheduled for Tuesday. Nationally, US home prices in December increased 5.8 percent from a year ago. This was the ninth monthly growth deceleration in a row since registering record growth of 20.8 percent last March.
Thursday brings GDP (4Q22, 3rd estimate) and corporate profits (4Q22).
The second print showed real GDP grew 2.7 percent in 4Q22. This followed growth of 3.2 percent in 3Q and contractions of 0.6 percent in 2Q and 1.6 percent in 1Q.
In 3Q22, corporate profits with inventory valuation and capital consumption adjustments rose 5.5 percent year-over-year to a seasonally adjusted annual rate of $3 trillion – essentially unchanged from the record set in 2Q22.
On Friday, personal income/spending (February) and the University of Michigan’s consumer sentiment index (March, final) are on dock.
In the 12 months to January, headline and core PCE (personal consumption expenditures) increased 5.4 percent and 4.7 percent respectively. They peaked last year at seven percent in June and 5.4 percent in February, in that order.
March’s preliminary reading showed consumer sentiment dropped 3.6 points month-over-month to 63.4 – a three-month low.
WTI crude oil: Currently net long 185.5k, down 29.6k.
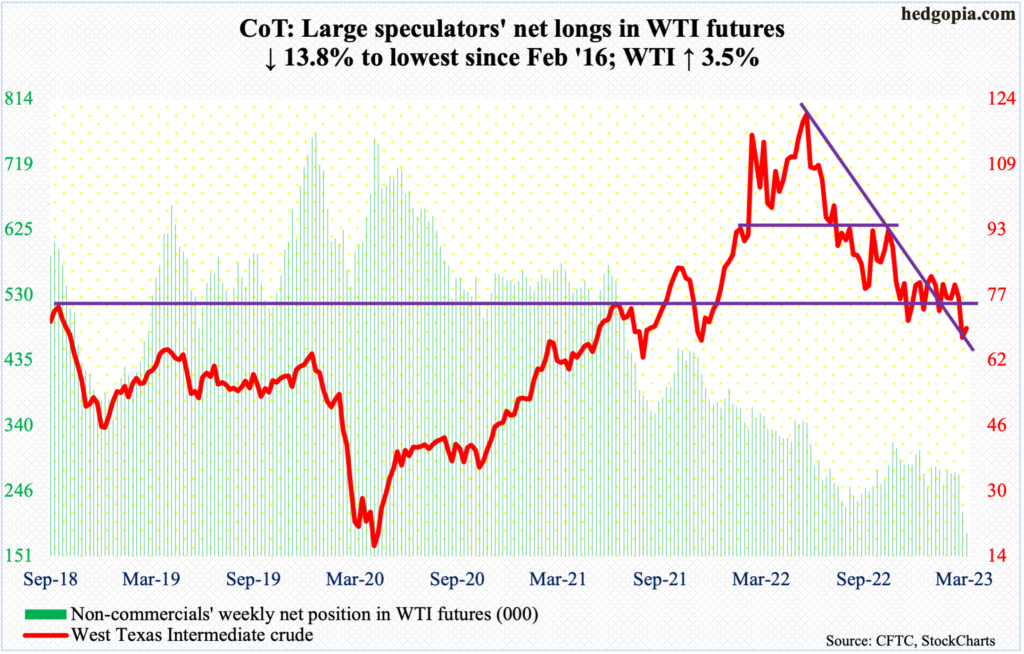
There is one more week before March is over, and WTI ($69.26/barrel) is down 10.1 percent for the month. Assuming the month ends in the red, this will be the fifth consecutive down month – and 9th in 10.
Last March, the crude peaked at $130.50, with a lower high of $123.68 in June. Last week, it fell out of a nearly four-month range between $71-$72 and $81-$82. The broken support repelled rally attempts later this week.
Concurrently, signs are appearing that oil bulls are putting their foot down around $65-$66, with a low of $64.36 on the 20th. Continued defense of this support opens the door for a reflex rally, and for that to morph into something lasting $71-$72 needs to go.
In the meantime, as per the EIA, US crude production in the week to March 17 grew 100,000 barrels per day week-over-week to 12.3 million b/d. Crude imports fell 44,000 b/d to 6.2 mb/d. Stocks of gasoline and distillates dropped as well – by 6.4 million barrels and 3.3 million barrels respectively to 229.6 million barrels and 116.4 million barrels. Crude inventory, however, increased 1.1 million barrels to 481.2 million barrels. Refinery utilization increased four-tenths of a percentage point to 88.6 percent.
E-mini S&P 500: Currently net short 202.5k, up 82.7k.
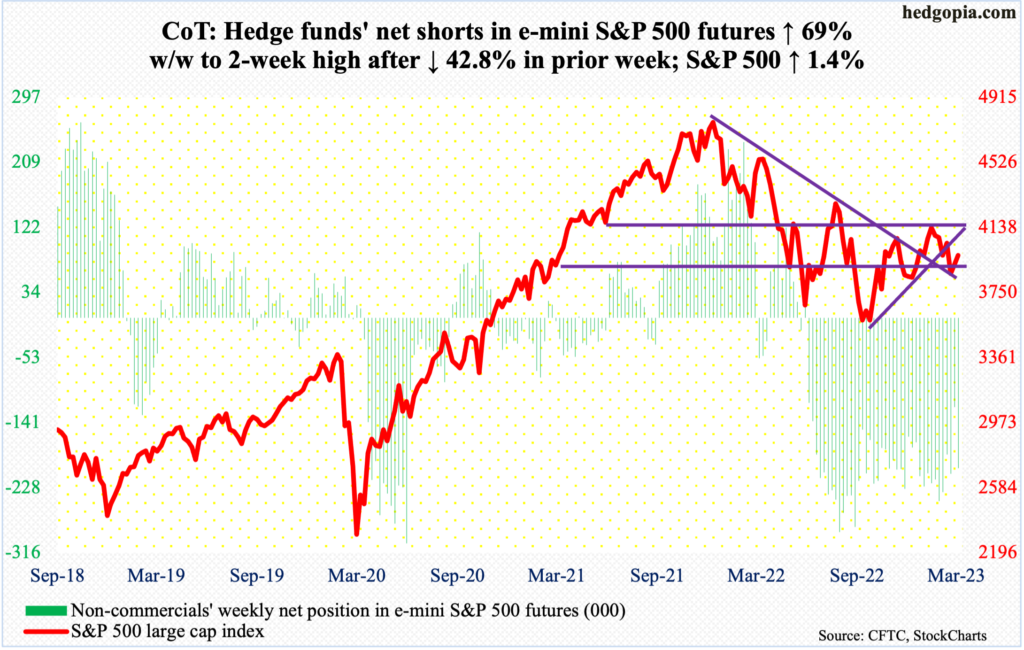
In the week to Wednesday, US-based equity funds took in $11.9 billion. This came on the heels of five-week outflows totaling $39.3 billion (courtesy of Lipper). Concurrently, SPY (SPDR S&P 500 ETF), VOO (Vanguard S&P 500 ETF) and IVV (iShares Core S&P 500 ETF) attracted $14.8 billion in the week to Wednesday.
From equity bulls’ perspective, this is a welcome change given how volatile March has been. With one week to go, the S&P 500 is unchanged for the month, forming a long-legged doji. The index (3971) reached as high as 4078 on the 6th and as low as 3809 on the 13th.
The large cap index closed Friday right between the 50- and 200-day moving averages (4014 and 3932 respectively). Wednesday’s high of 4039 got repelled right at a falling trendline from January when it tagged 4195. This resistance (4030s) is the one to watch for now. Failure to break out raises the odds the lower daily Bollinger band at 3850s gets tested.
Euro: Currently net long 144.8k, up 4.9k.
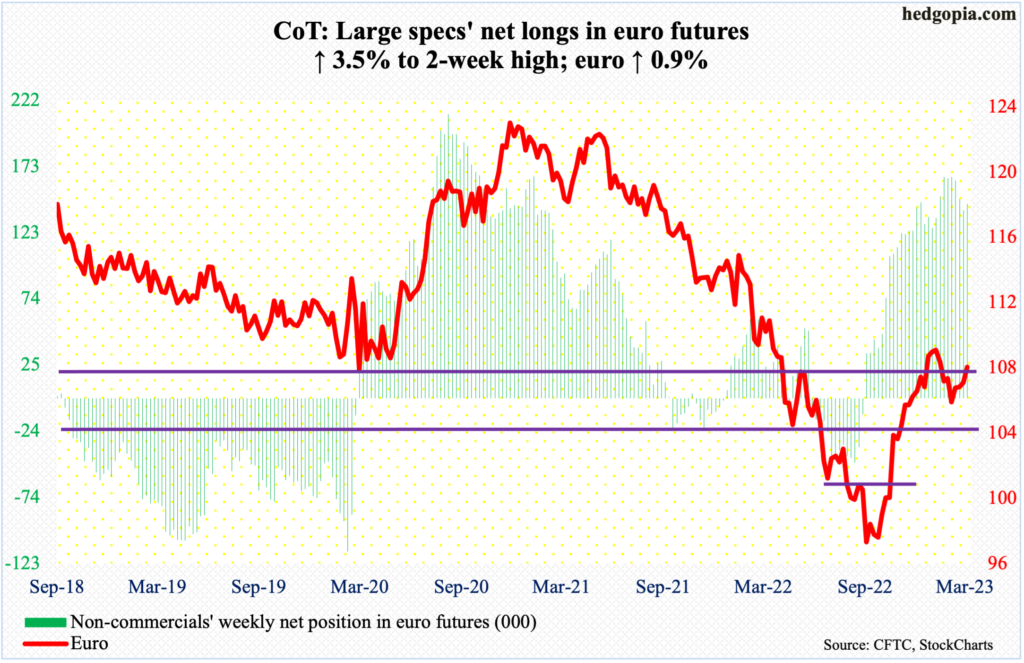
The euro is searching for direction. This week, it rallied 0.9 percent to $1.0764, although it was up as much as 2.3 percent at Wednesday’s high. Euro bulls’ inability to hang on to all of that session’s gains resulted in a weekly shooting star. This candle preceded back-to-back weekly long-legged dojis.
Last December, the euro reclaimed $1.04-$1.05, which has been an important level going back at least eight years and which was lost last July. This is constructive. But, from bulls’ perspective, this is just a battle won, not the war. For that, they need to recapture $1.09-$1.10, which has resisted rally attempts several times this year. This might very well happen in due course.
Gold: Currently net long 158.6k, up 18.3k.
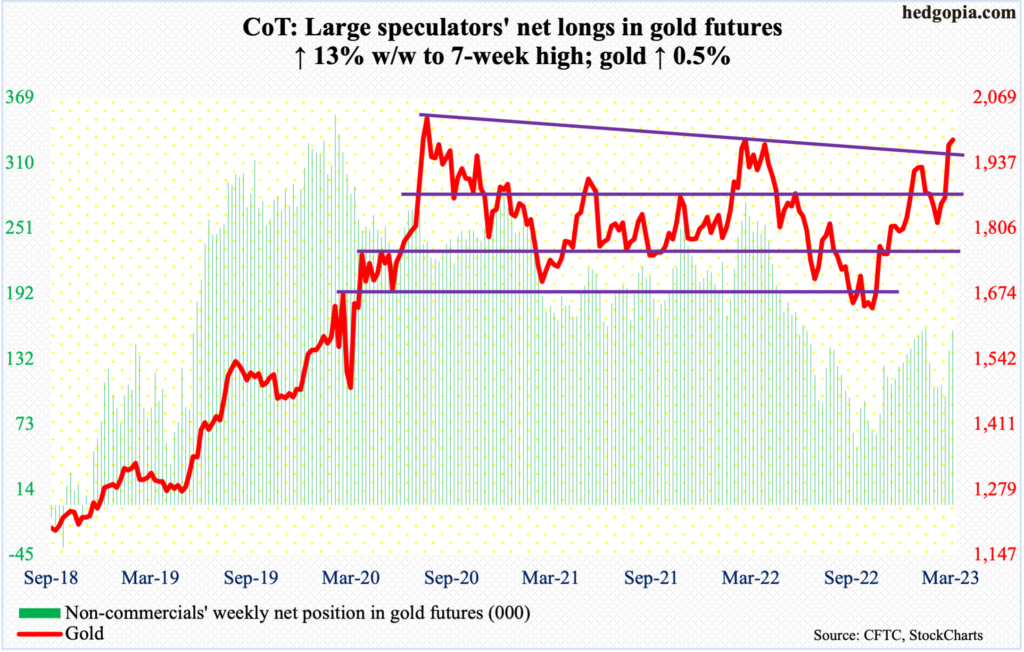
March has so far been a very fruitful month for gold bugs. With five more sessions left, the month is up eight percent, to $1,984/ounce. This would be fourth up month in five. In fact, the metal ticked $2,015 on Monday, and if it held, gold would have been up 9.7 percent.
The yellow metal has struggled just north of $2,000 going back to July 2020, with an all-time high of $2,089 in August that year before reversing hard. Last March, gold again tagged $2,079 but only to quickly go the other way. Hence the importance of this month’s rally.
In the event the hitherto-contained banking crisis continues to percolate, it will be just a matter of time before gold breaks out. Non-commercials have been adding to their gold longs, albeit not too aggressively.
Nasdaq 100 index (mini): Currently net short 5.1k, down 1.4k.
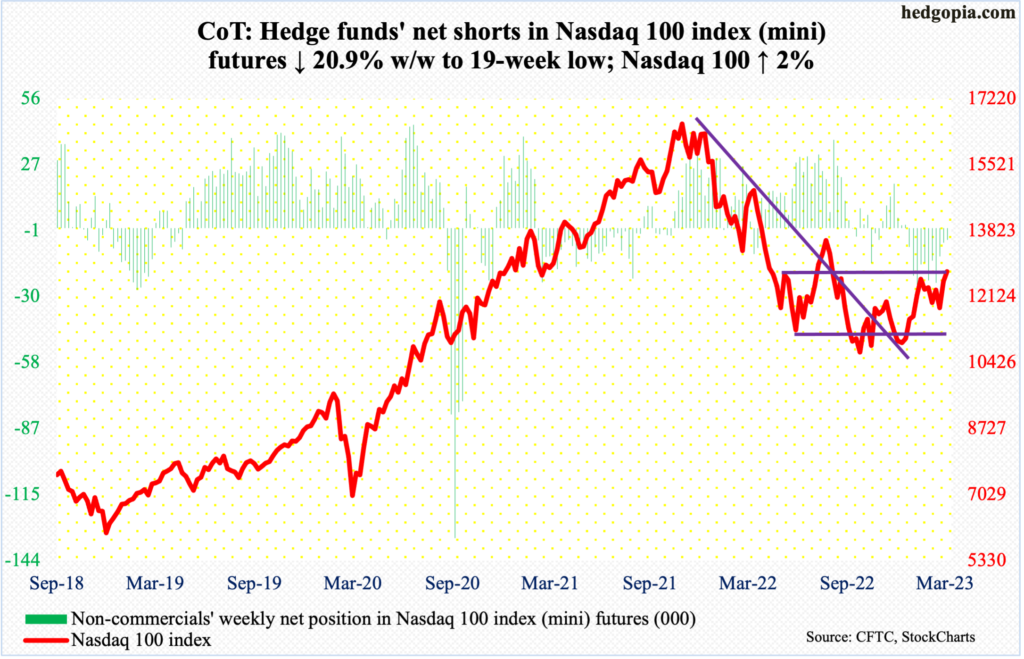
Tech has gotten its mojo back in March. Month-to-date, the Nasdaq 100 is up six percent. Going back to December 2020, 12800s has proven to be an area of interest for both bulls and bears. In February, the level was tested, but only to attract bears in droves, ending the month in a gravestone doji. March can end differently, provided tech bulls maintain the momentum for five more sessions.
The daily in the meantime looks to be wanting to go lower. Ideally, the tech-heavy index can come under pressure, test lower/nearest support at 12200s, which coincides with the now-rising 50-day (12187), and regroup to once again hammer at 12800s.
Non-commercials have reduced their net shorts in Nasdaq 100 index (mini) futures to a 17-week low.
Russell 2000 mini-index: Currently net short 45k, down 4.3k.
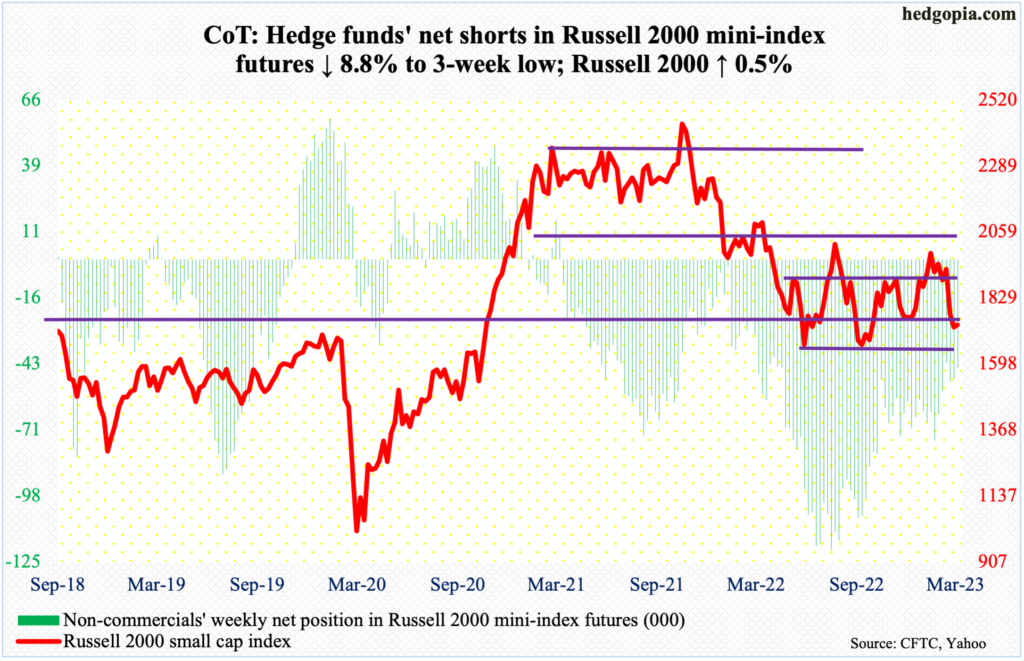
March-to-date, small-caps have so far bled heavily, with the Russell 2000 down 8.5 percent. This is in sharp contrast to how the S&P 500 (unchanged) or the Nasdaq 100 (up six percent) are behaving.
The small cap index is teetering on support. Intraday Friday, it ticked 1695 before generating buying interest, closing out the week at 1735. Horizontal support at 1700 goes back to August 2018. A breakdown can still be saved should longs pounce on 1640s, which represent the lows of last year in June and October. The way things have unfolded, it increasingly feels like 1700 will not only be tested in due course but will be breached. This should have a negative macro connotation given small-caps’ large exposure to the domestic economy.
US Dollar Index: Currently net long 14.1k, up 387.
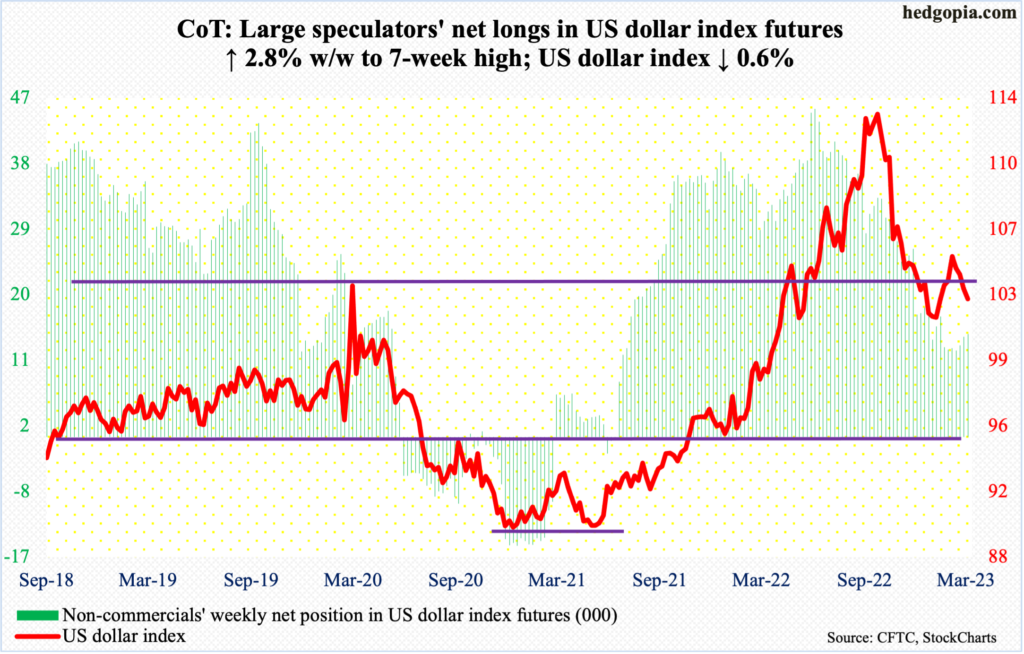
Last June, the US dollar index broke out of crucial 103-104. It then went on to post a high of 114.75 by September. The decline since has been unrelenting, with a monthly decline from October through January; February was up but March to date is down two percent.
It lost the 103-104 support in the prior week, with an additional 0.6 percent drop this week. Right here and now, the daily is looking to rally. In this scenario, what happens at 103-104 will reverberate through a whole host of assets. A breakout – should one occur – should be hard to sustain.
VIX: Currently net short 49.6k, down 11.9k.
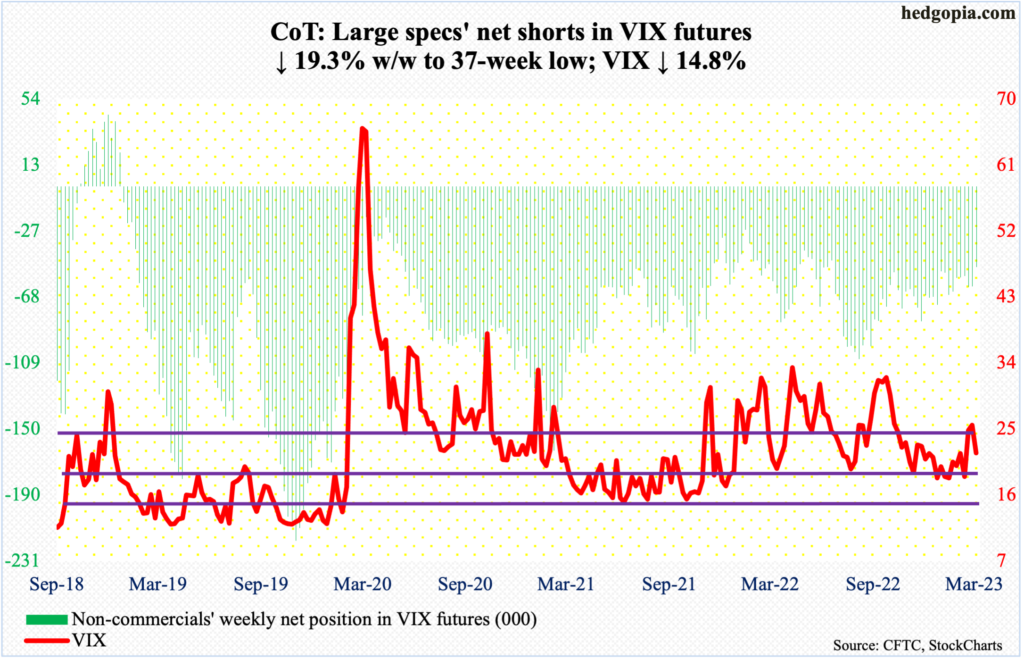
In February, VIX tagged 17.06 before turning higher. This was a successful test of a rising trend line from November 2017 when the volatility index made an all-time low of 8.56. Again this month, it ticked 18.16 on the 3rd before rising – which just about tested the trendline in question.
Longer-term, these tests could prove to be important, as the bias is up. VIX (21.74) did tick 30.81 on the 13th. Near-term, it could go either way, with maybe an upward bias.
Historically, VIX does not peak until non-commercials are either net long VIX futures or get close to doing that. This week, these traders reduced their net shorts to a 37-week low.
Thanks for reading!
