Following futures positions of non-commercials are as of March 28, 2023.
10-year note: Currently net short 471.6k, down 99.5k.
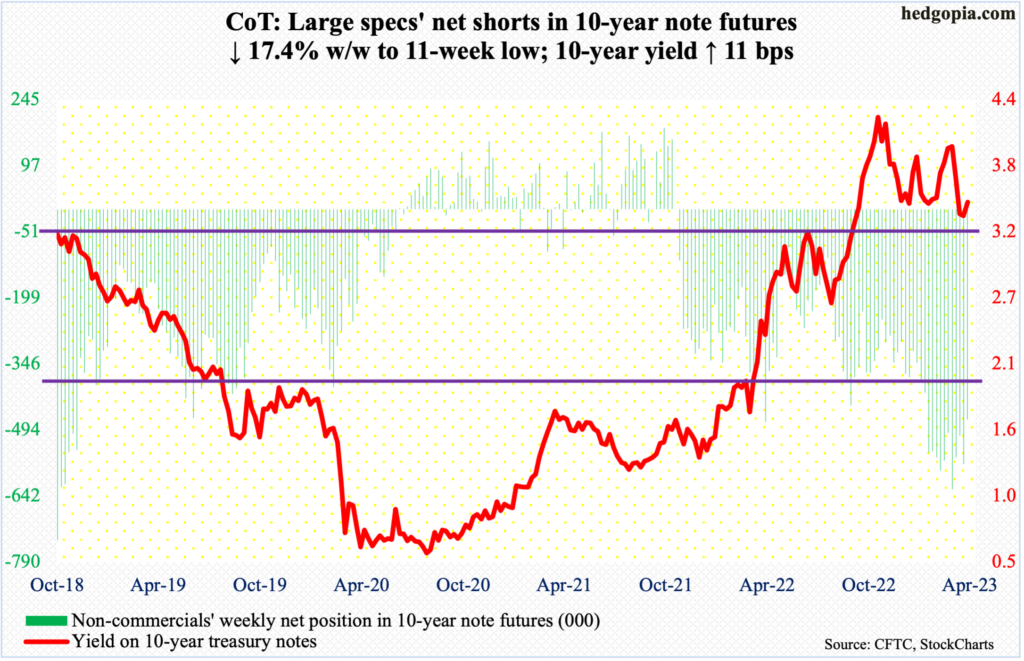
Non-commercials reduced net shorts in 10-year-note futures by nearly 100,000 contracts this week, to 471,578. In the week to February 28, they held 627,947 contracts – the highest since October 2018.
These traders have been net short since November 2021 and have done well, as the 10-year treasury yield rose from a low of 1.34 percent in December that year to a high of 4.33 percent last October, with a lower high of 4.09 percent early this March.
All of this week, the 10-year (3.49 percent) traded around the 200-day (3.5 percent), with a slight breach of the average by the end of the week. On the monthly in particular, the trend is decidedly down. In the weeks and months ahead, non-commercials in all probability will continue to cut their net shorts.
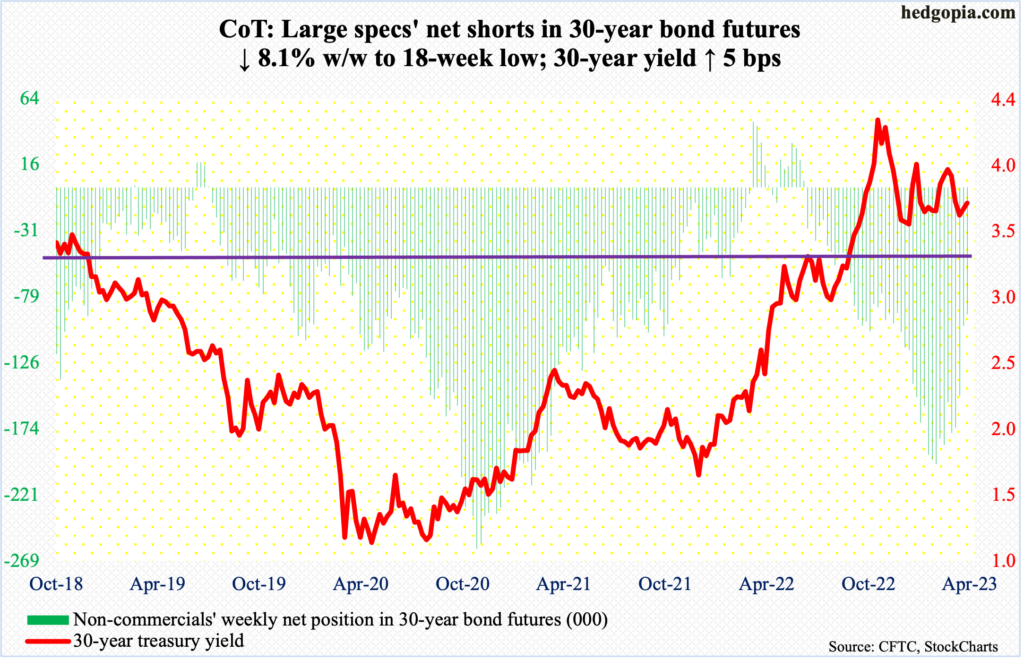
30-year bond: Currently net short 91.4k, down 8k.
Major economic releases for next week are as follows. Markets are closed Friday for observance of Good Friday!
The ISM manufacturing index (March) is published on Monday. In February, US manufacturing activity inched up three-tenths of a percentage point month-over-month to 47.7 percent. Activity has remained sub-50 for four months.
Factory orders (February) and job openings (February) are due out Tuesday.
Preliminarily, February orders for non-defense capital goods ex-aircraft – proxy for business capex plans – increased 4.3 percent year-over-year to a seasonally adjusted annual rate of $75.2 billion, which is just under last August’s record $75.4 billon.
January non-farm job openings dropped 410,000 m/m to 10.8 million. The series reached a record high 12 million in March last year before weakening.
The ISM services index (March) comes out on Wednesday. Services activity inched lower one-tenth of a percentage point m/m in February to 55.1 percent.
Friday brings the employment report (March). The economy created 311,000 non-farm jobs in February, for an average this year of 408,000. It is early in the year, still it compares with a monthly average in 2022 of 399,000 and 606,000 in 2021.
WTI crude oil: Currently net long 228.6k, up 43.1k.
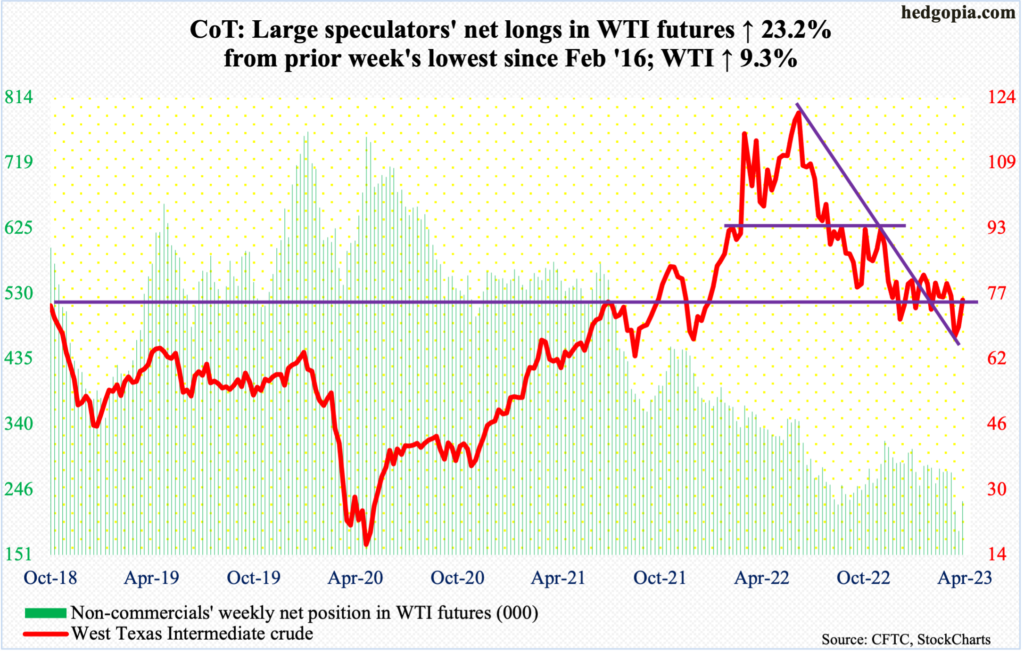
Three weeks ago, WTI ($75.67/barrel) fell out of a nearly four-month range between $71-$72 and $81-$82. By March 20, it ticked $64.36 intraday before closing the session with a bullish hammer. The upward momentum since had the crude reenter the broken range this week, with Friday essentially closing on the 50-day ($75.81). In the sessions ahead, odds favor the upper end of the range acts as a magnet.
In the meantime, as per the EIA, US crude production in the week to March 24 fell 100,000 barrels per day week-over-week to 12.2 million b/d. Crude imports fell 847,000 b/d to 5.3 mb/d. Stocks of crude and gasoline dropped as well – by 7.5 million barrels and 2.9 million barrels respectively to 473.7 million barrels and 226.7 million barrels. Distillates inventory, however, increased 281,000 barrels to 116.7 million barrels. Refinery utilization increased 1.7 percentage points to 90.3 percent.
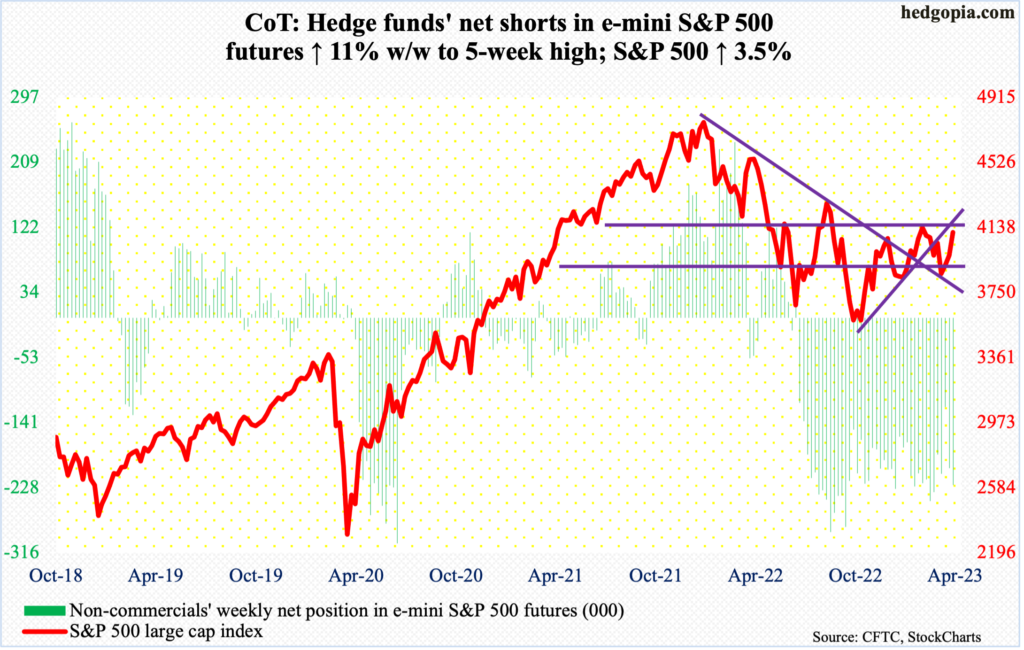
E-mini S&P 500: Currently net short 224.7k, up 22.2k.
In the week to Wednesday, US-based equity funds bled $20.5 billion. This was the sixth weekly outflows in seven, with last week attracting $11.9 billion (courtesy of Lipper). Concurrently, SPY (SPDR S&P 500 ETF), VOO (Vanguard S&P 500 ETF) and IVV (iShares Core S&P 500 ETF) witnessed redemptions of $2 billion in the week to Wednesday, versus inflows of $14.8 billion in the prior week (courtesy of ETF.com).
The flows dynamics probably improved later in the week, as the S&P 500 was essentially unchanged for the week until Tuesday. Then, it surged 3.5 percent in the next three sessions, recapturing the slightly-rising 50-day; Friday’s 1.4-percent rally came in a bullish marubozu session. The large cap index’s closing print of 4109 is a test of crucial horizontal resistance at 4100; this is also a test of the underside of the broken rising trendline from last October when the S&P 500 bottomed at 3492. A break to the upside opens the door toward 4200.
Euro: Currently net long 145k, up 183.
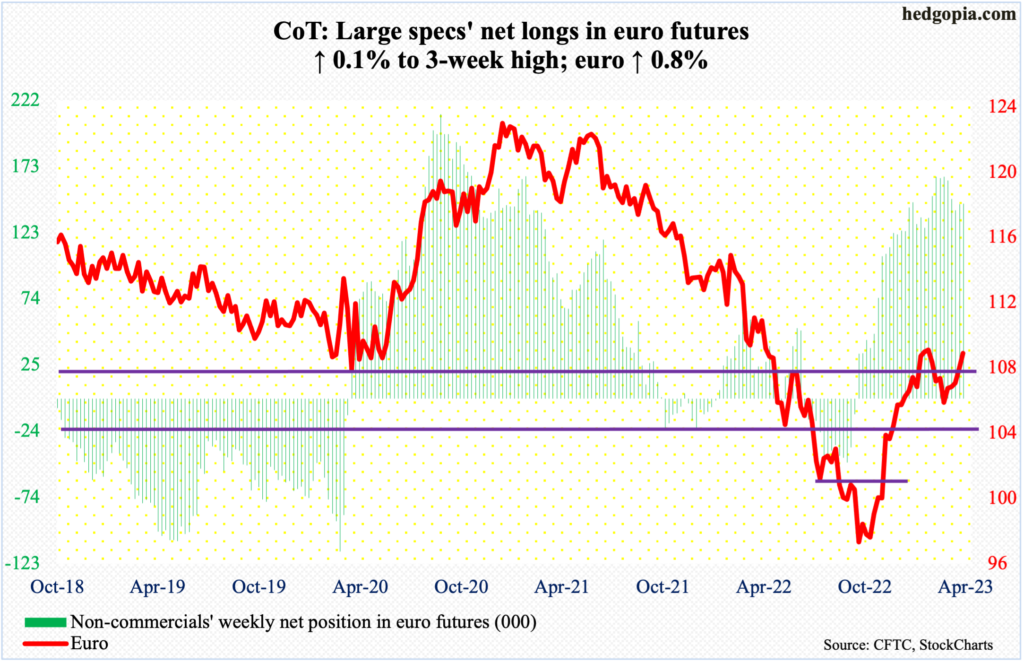
One more week and one more attempt at recapturing $1.09-$1.10, which has resisted rally attempts several times this year. On Thursday, the currency rallied as high as $1.0927, only to close out the week at $1.0850.
Non-commercials are staying with their net longs, which at 145,025 contracts are still under the early-February high of 165,068. There is no sign of exuberance just yet.
The daily is getting extended. In the event of downside pressure, bulls can step up and defend the 50-day ($1.0736), or, in a worse-case scenario, regroup near $1.04-$1.05, which has been an important level going back at least eight years and which was reclaimed last December.
Gold: Currently net long 181.6k, up 23k.
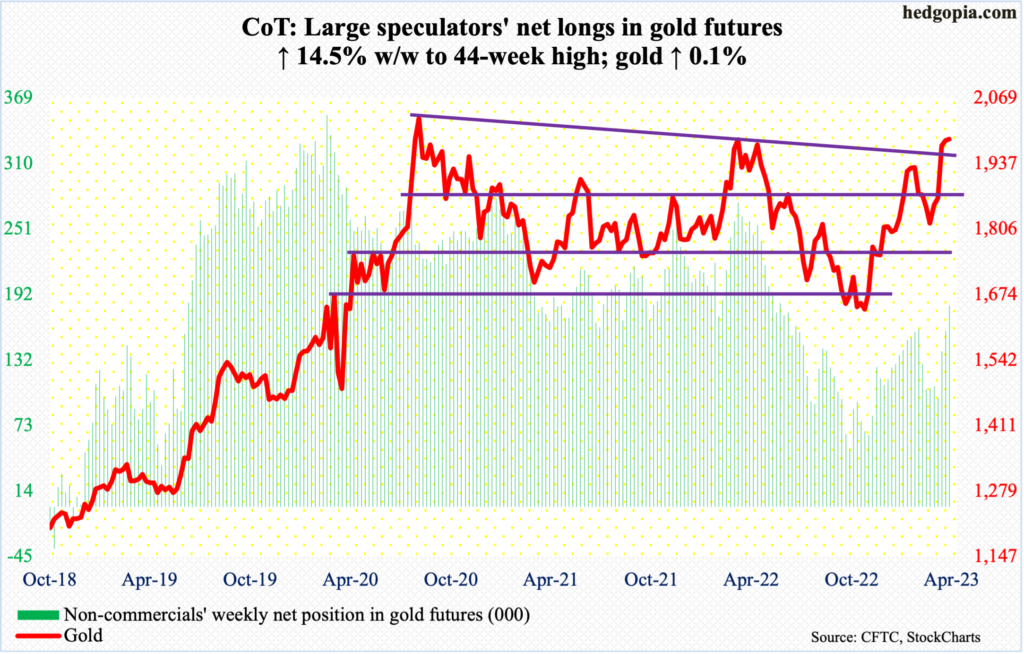
Gold ($1,986/ounce) continues to hover near $2,000. This week, it inched up 0.1 percent, with both Thursday and Friday poking the head out of $2,000 intraday but unable to close.
The yellow metal has struggled just north of $2,000 going back to July 2020, with an all-time high of $2,089 in August that year before reversing hard. Last March, gold again tagged $2,079 but only to quickly go the other way. Hence its significance.
Non-commercials are behaving as if a breakout is just a matter of time. Net longs are at a 44-week high.
Once $2,000 falls, gold bugs can then eye $2,080s. After that, it is new territory.
Nasdaq 100 index (mini): Currently net short 7.3k, up 2.2k.
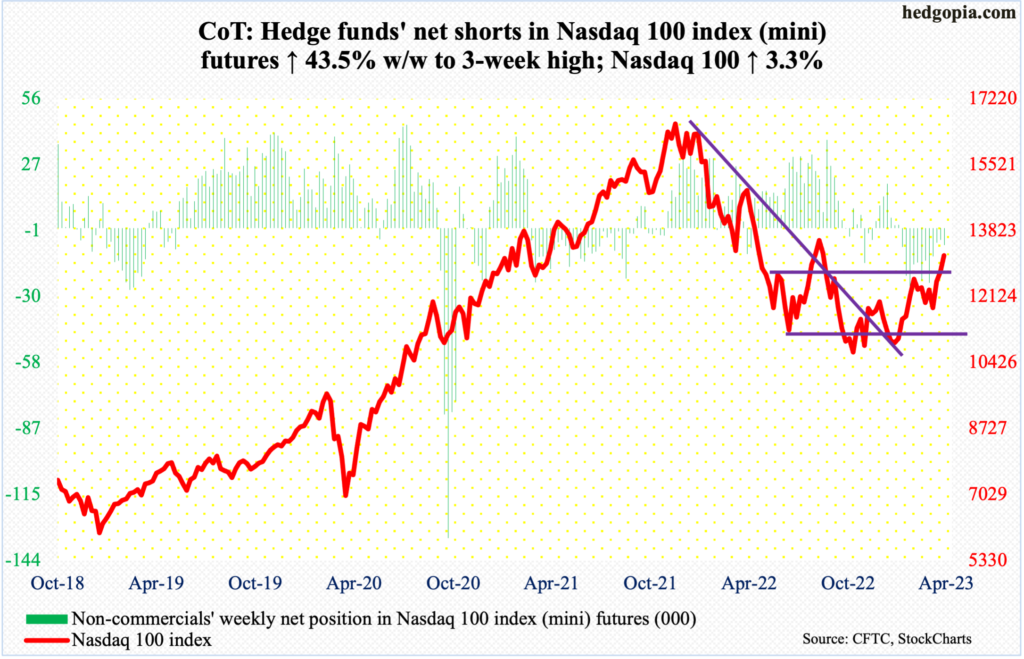
The Nasdaq 100 jumped 9.5 percent in March! In contrast, the S&P 500 rose 3.5 percent, while the Russell 2000 small cap index tumbled five percent.
It is difficult to make heads or tails of tech’s outperformance given how small-caps, which tend to be very sensitive to the domestic economy, are faring (more on this here).
Regardless, tech’s price action is strong – however long it lasts. This week, the Nasdaq 100 took out 12800s, which has been an area of interest for both bulls and bears going back to December 2020.
Immediately ahead, there is horizontal resistance at 13700s, which also lines up with the upper end of a rising channel from the latter months of last year.
Russell 2000 mini-index: Currently net short 42.8k, down 2.2k.
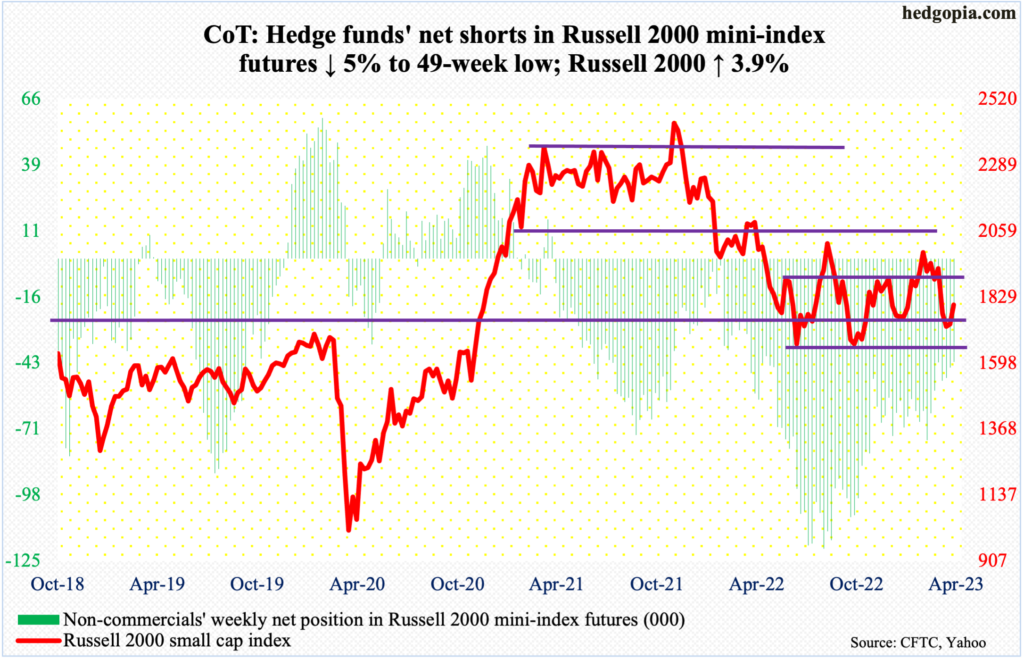
Small-cap bulls defended horizontal support at 1700, which goes back to August 2018. A breakdown could still have been saved at 1640s, which represent the lows of last year in June and October.
This week, the Russell 2000 (1802) rallied 3.9 percent, closing right in the middle of a 14-month range between 1700-1900.
Non-commercials have been reducing their net shorts in Russell 2000 mini-index futures. If the trend continues, this will obviously help the bulls. Longer-term, however, small-cap behavior raises tons of questions about the health of the economy going forward.
US Dollar Index: Currently net long 12.7k, down 1.4k.
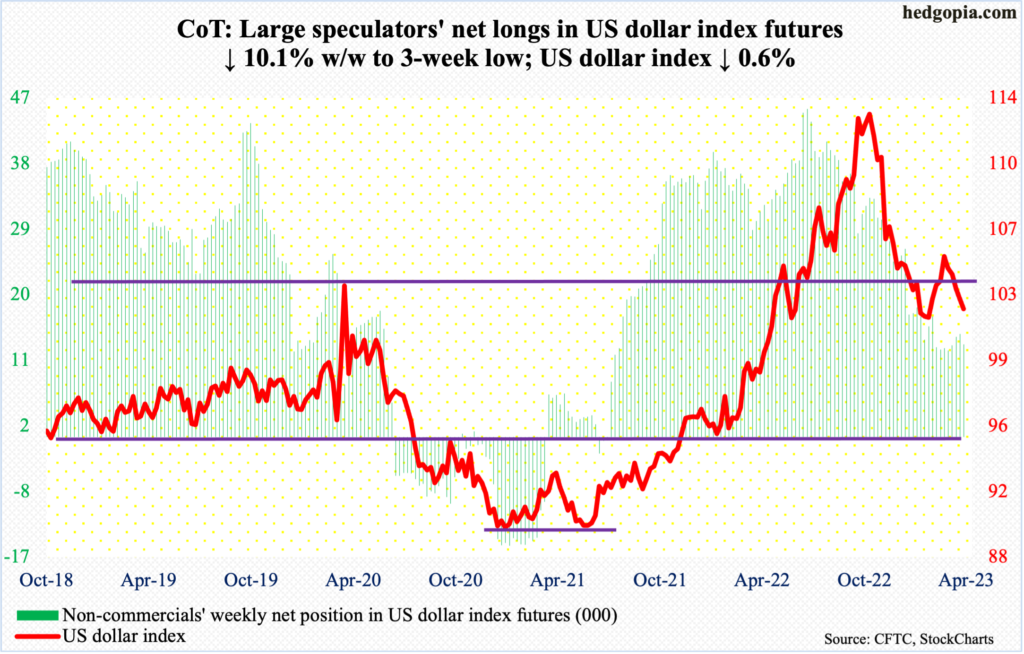
Last June, the US dollar index broke out of crucial 103-104. Subsequently in September, it tagged 114.75, before reversing. It dropped each month from October through January, rose in February and was down again in March.
Importantly, dollar bulls were unable to save 103-104, which was lost two weeks ago.
The daily is getting oversold. In this scenario, what happens at 103-104 is worth a watch. In due course, the US dollar index is likely to test 101 and fail.
VIX: Currently net short 42.2k, down 7.5k.
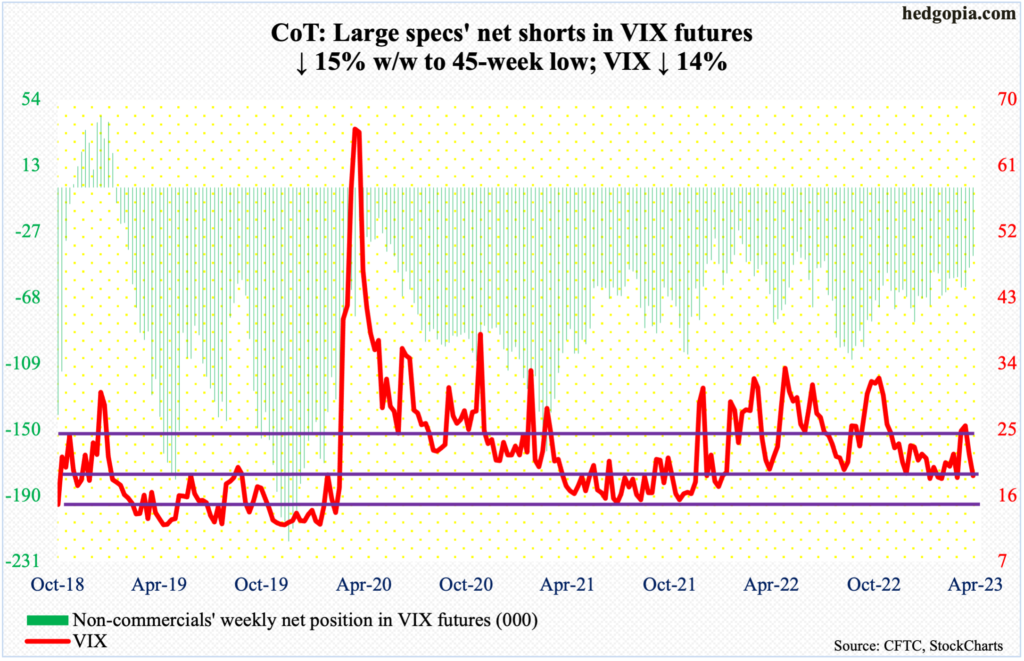
In March, VIX rallied as high as 30.81 intraday on the 13th. In several sessions around that high, there were signs of spike reversal. And quite a reversal it turned out to be! On Friday, the volatility index ticked 18.52 intraday – the lowest since the 7th (March) – closing the session at 18.70.
It has been two months since VIX went sub-18. Equity bulls would love to see that happen, which probably occurs should the S&P 500 bust out of 4100. Else, VIX is oversold on the daily.
Thanks for reading!

