
Following futures positions of non-commercials are as of May 2, 2023.
10-year note: Currently net short 749.1k, up 8.9k.
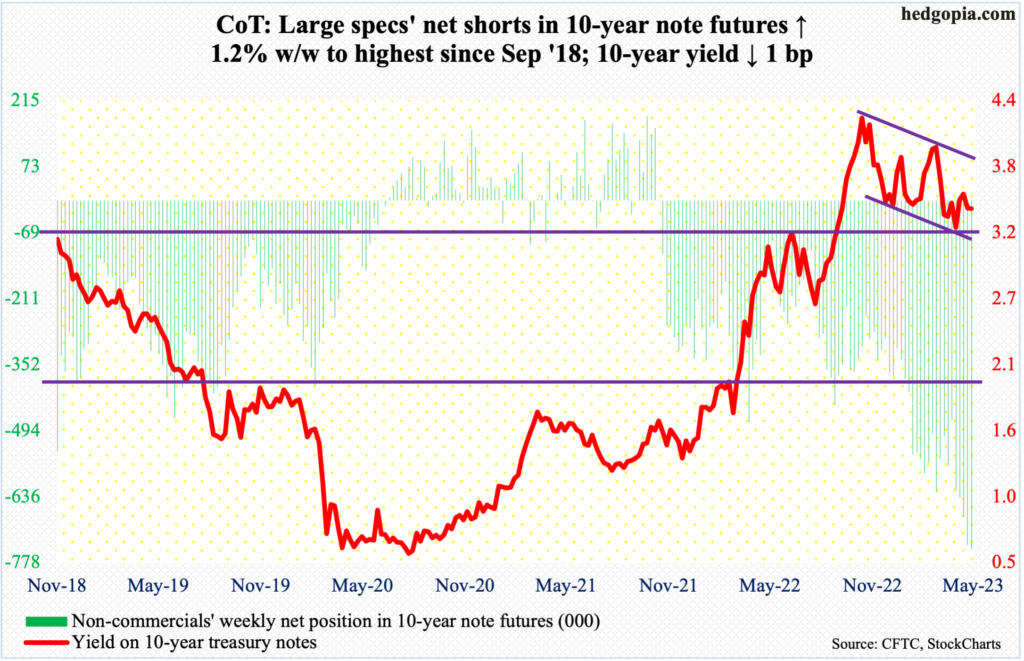
The Federal Reserve’s job is not getting any easier. On Wednesday, post-FOMC meeting, Chair Jerome Powell dropped hints that they were ready to take a pause after raising the fed funds rate 500 basis points over less than 14 months (more on this here).
Come Friday, April’s jobs report was published, and it was way hotter than expected. The economy added 253,000 non-farm jobs last month, the average hourly earnings grew 4.5 percent year-over-year and the unemployment rate dropped to 3.39 percent, which was a 54-year low.
Granted jobs are a lagging indicator, but the economy is just not responding to the 500-basis-point tightening the way the central bank would like to see. Yes, the pace of job creation has slowed but jobs are being produced at a steady pace. In the first four months this year, 285,000 jobs were added on average, down from the 2022 monthly average of 399,000 and 606,000 before that in 2021.
As a result, inflation is trending lower but at a gradual pace. In the 12 months to March, core CPI (consumer price index) and PCE (personal consumption expenditures) increased 5.6 percent and 4.6 percent, having peaked last year at 6.6 percent in September and 5.4 percent in February, in that order. Between the two, core PCE is the Fed’s favorite, and even that is more than twice the central bank’s two percent objective.
With this as a background, the upcoming CPI and PCE reports for April have gained on massive importance. They are due out on the 10th and 26th this month, in that order. The FOMC next meets on June 13-14. In fact, by that time, they will also have May’s CPI at their disposal as it is scheduled for the 13th.
30-year bond: Currently net short 89.4k, down 8k.
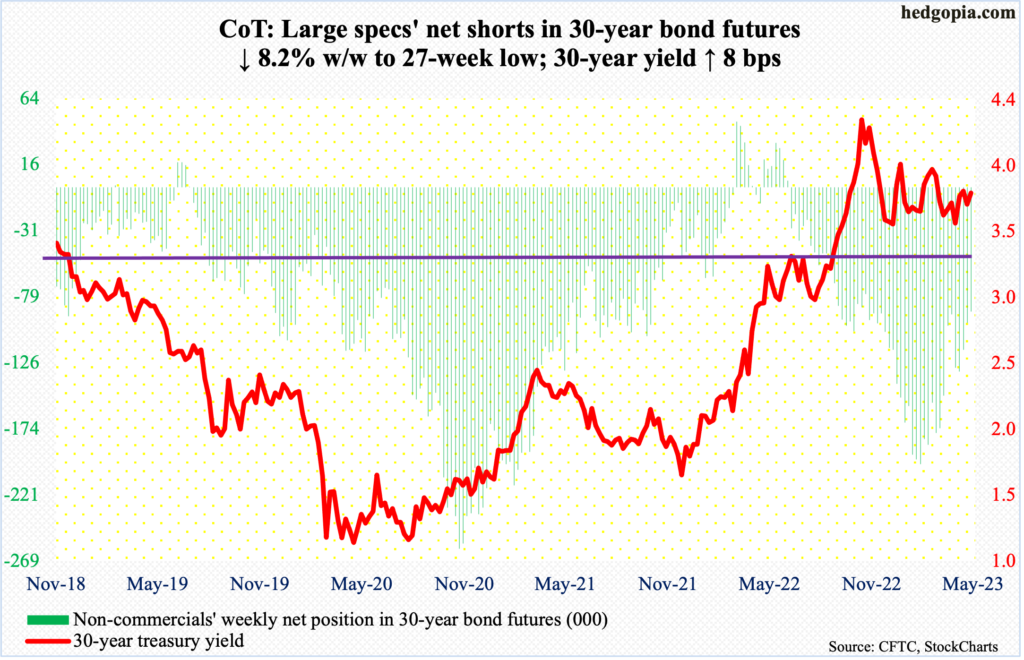
Major economic releases for next week are as follows.
The NFIB optimism index (April) is scheduled for Tuesday. Small-business optimism in March declined eight-tenths of a point month-over-month to 90.1 – a three-month low.
Wednesday brings the CPI (April). In the 12 months to March, headline and core CPI grew 5.6 percent and five percent respectively. They respectively peaked last year at 6.6 percent in September and 9.1 percent in June.
The University of Michigan’s consumer sentiment index (May, preliminary) is scheduled for Friday. In April, sentiment rose 1.5 points m/m to 63.5 – a two-month high. Last June, sentiment hit an all-time low 50.
WTI crude oil: Currently net long 229.6k, down 19.4k.
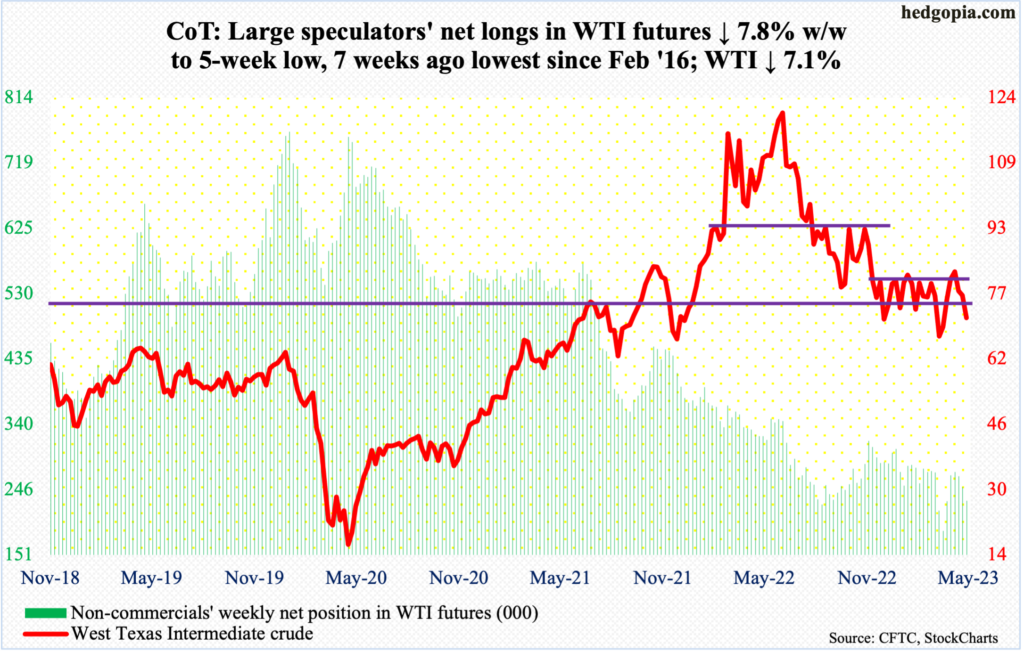
WTI ($71.34/barrel) is back at testing the lower end of a five-month range between $71-$72 and $81-$82. The crude gave back 7.1 percent this week, although, to oil bulls’ credit, it was down as much as 17.2 percent at Thursday’s low of $63.57.
This was the third consecutive weekly decline, and it continues to be a show-me story. With that said, it can rally near term as the daily unwinds its oversold condition.
In the meantime, as per the EIA, US crude production in the week to April 28 increased 100,000 barrels per day week-over-week to 12.3 million b/d. Crude imports grew as well – up 20,000 b/d to 6.4 mb/d. As did gasoline stocks, which rose 1.7 million barrels to 222.9 million barrels. Stocks of crude and distillates, however, fell – by 1.3 million barrels and 1.2 million barrels to respectively 459.6 million barrels and 110.3 million barrels. Refinery utilization decreased six-tenths of a percentage point to 90.7 percent.
E-mini S&P 500: Currently net short 355.4k, down 7.9k.
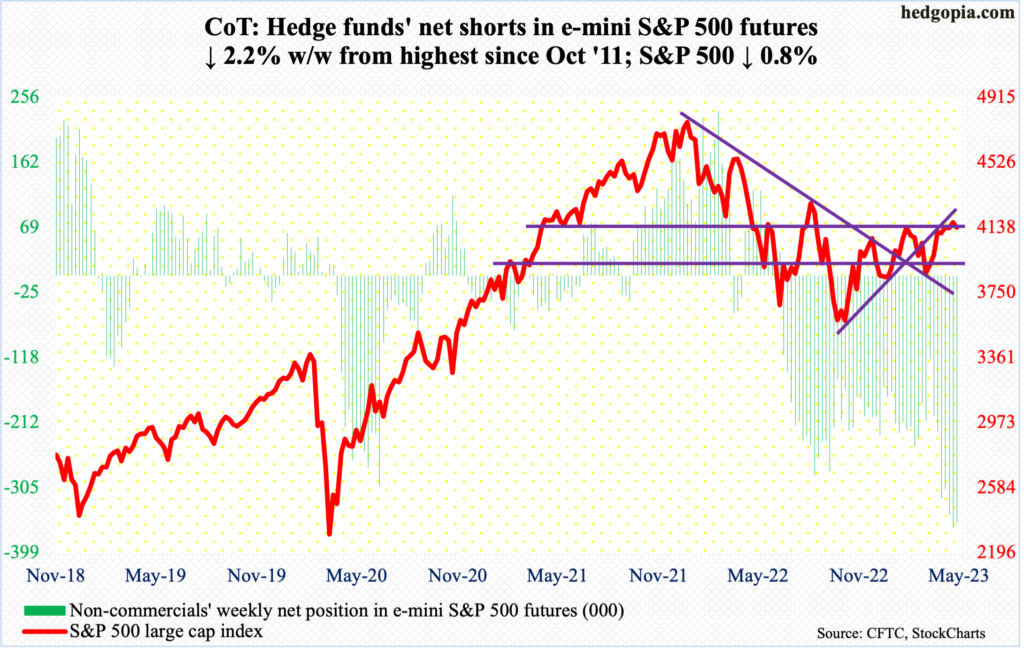
Non-commercials are staying put. Last week, they were net short 363,267 contracts – the shortest they have been since October 2011. This week, holdings were reduced by 2.2 percent. It is possible Friday’s 1.9-percent rally in the cash forced/led them to cut their net exposure further.
It is equally possible these traders would not budge until the S&P 500 (4136) decisively takes out 4170s. This week, in a shooting star session Monday, 4187 was tagged but only to attract selling. By Thursday’s low, the large cap index was down 2.9 percent for the week – which improved to down 0.9 percent by Friday’s session.
Immediately ahead, bulls are likely to again go after 4170s (more on this here).
Euro: Currently net long 173.5k, up 4.1k.
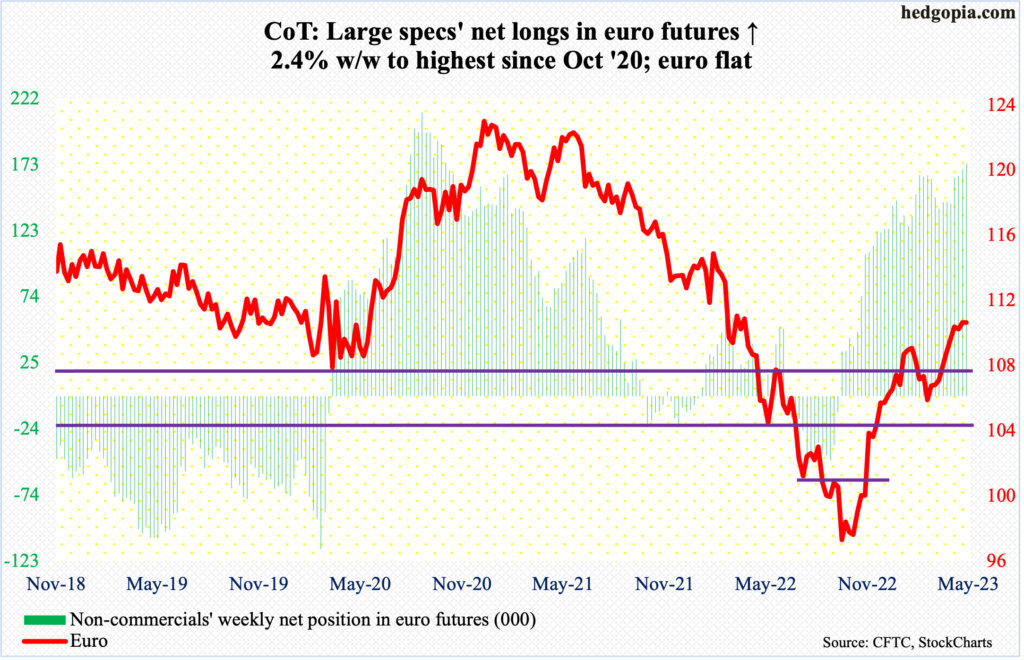
One more week and one more failure at the all-important $1.09-$1.10. On Wednesday, the euro ticked $1.1092 intraday but was unable to hold on to it. A week before that, $1.1095 was tagged intraday but only to close at $1.1042. This week, the euro was unchanged.
Amidst this, the weekly has formed three spinning tops in a row. This is taking place after a decent rally, having bottomed at $0.9559 last September, and after non-commercials accumulating the most net longs since October 2020.
Odds favor the euro fails to break out of $1.09-$1.10.
Gold: Currently net long 195.6k, up 10.3k.
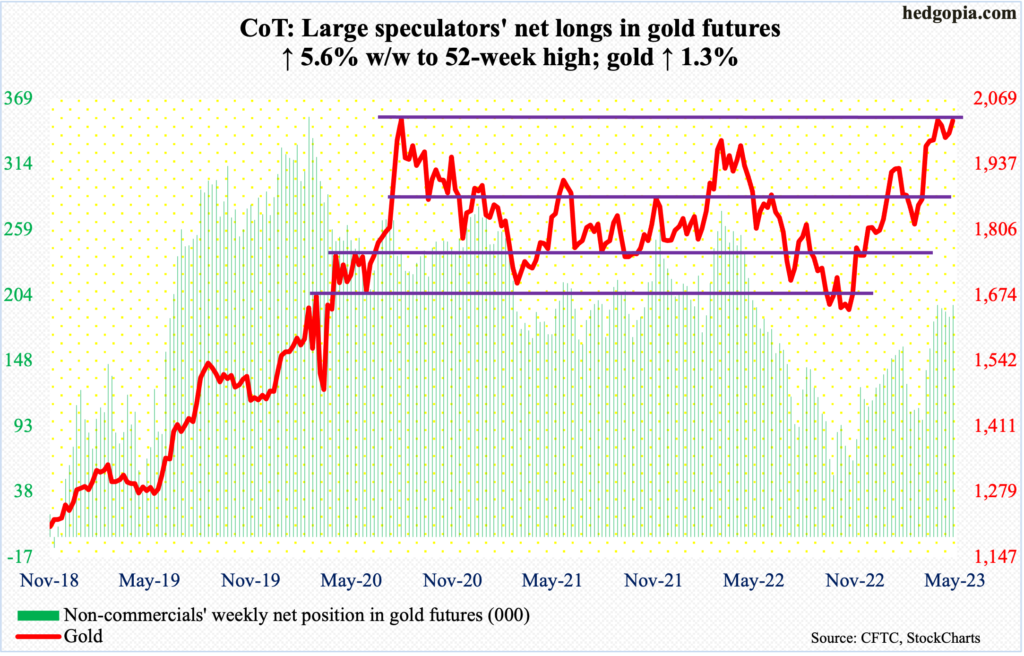
In Thursday’s long-legged doji session, gold came within $4 of the all-time high $2,089 from August 2020; the metal touched $2,085 intraday Thursday but only to close at $2,056. By the end of the week, it closed at $2,025/ounce, leaving behind a long upper wick. This was also the case when gold reached that high in August 2020 and again in March last year when it sharply retreated after tagging $2,079.
The difference between 2020/2022 and now is that back then gold immediately fell apart once it reversed. This time around, it is hanging in there, having also reversed in April after tagging $2,063.
In general, odds of a breakout grow the longer a ceiling gets hammered. Non-commercials, with net longs at 52-week highs, are behaving as if a breakout is imminent.
Nasdaq 100 index (mini): Currently net long 13.3k, up 8.2k.
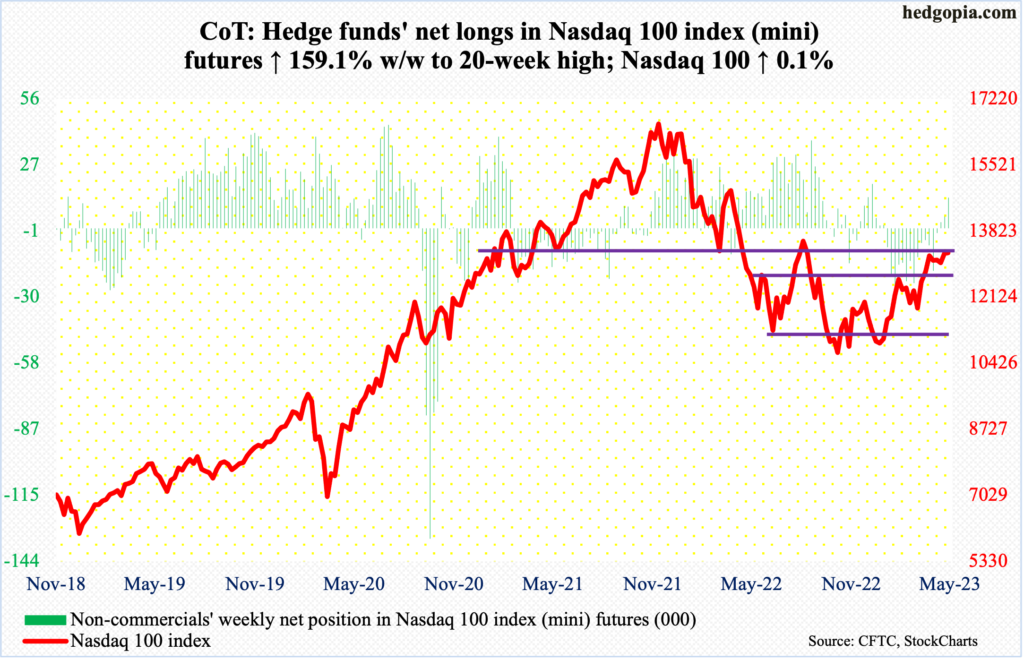
Apple (AAPL) was the savior. With a 12.6-percent weight in QQQ (Invesco QQQ Trust)/Nasdaq 100, the stock obviously has an inordinate influence on the ETF/index. Its March-quarter results were received very well, rallying 4.7 percent on Friday. The Nasdaq 100 jumped 2.1 percent in that session, ending the week up 0.1 percent; at Thursday’s low, it was down 2.3 percent.
Before this, the tech-heavy index last week managed to poke its head out of 13100s, which had rejected rally attempts for four consecutive weeks; this week, the index (13259) made a little bit more progress, but nothing to write home about. It needs to decisively eclipse this resistance before more gains are possible.
Russell 2000 mini-index: Currently net short 59.4k, up 7.3k.
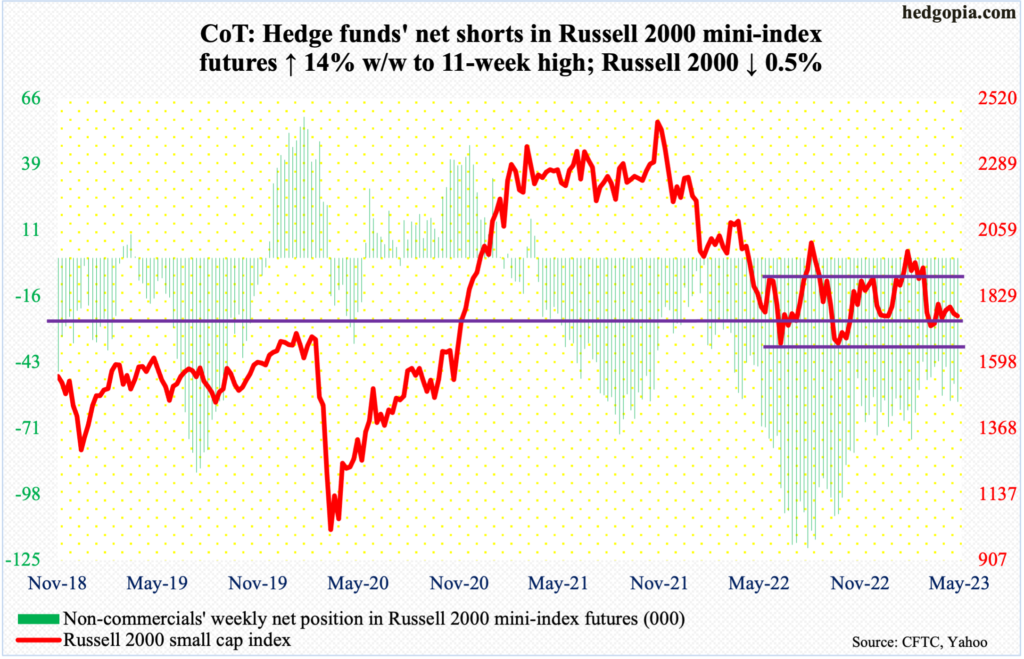
Thursday’s low of 1705 successfully tested – once again – the lower end of a 1700-1900 range intact since January last year. Support at 1700, in fact, goes back to August 2018. Small-cap bears have been hammering on it for a year now, to no avail – except for a brief drop to 1640s last June and October which was bought.
Thursday’s drop to that support drew buying interest, ending at 1760 – right on a falling trendline from February’s high. Odds favor it gets taken out, which will open the door toward at least the mid-point of the range in question.
US Dollar Index: Currently net long 11.4k, up 611.
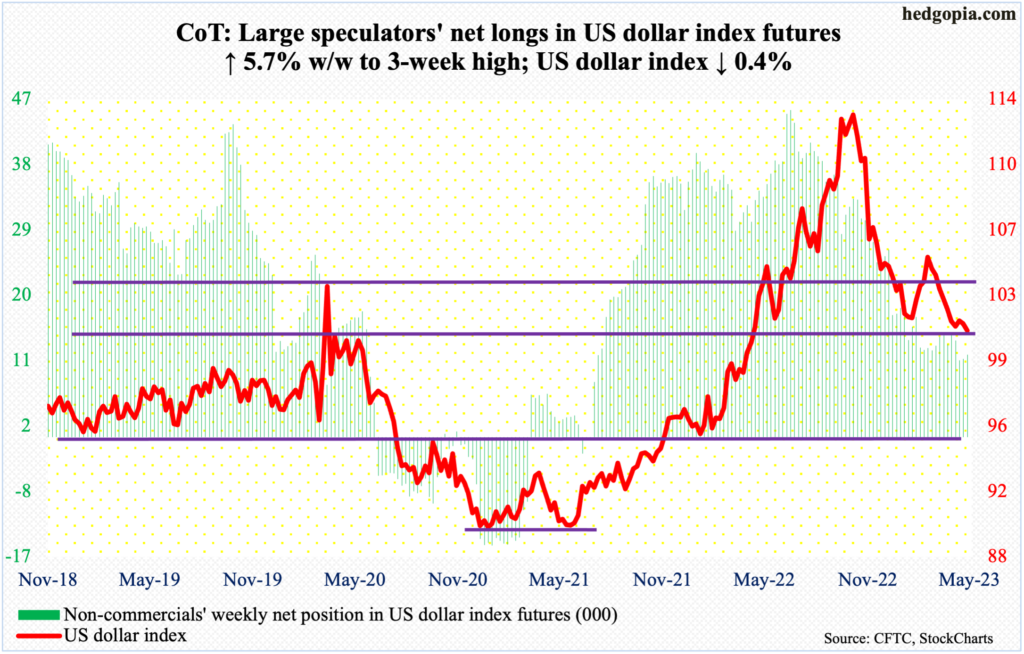
The April 14th low of 100.42 still stands, with Thursday having ticked 100.52, ending the week at 101. At 100-101 lies eight-year horizontal support, which dollar bulls have done a good job of defending thus far. The problem is that it is taking a little too long for the US dollar index to lift off of this support, with sideways action of four weeks in succession. The longer it takes, breach risks grow.
VIX: Currently net short 80k, down 1.9k.
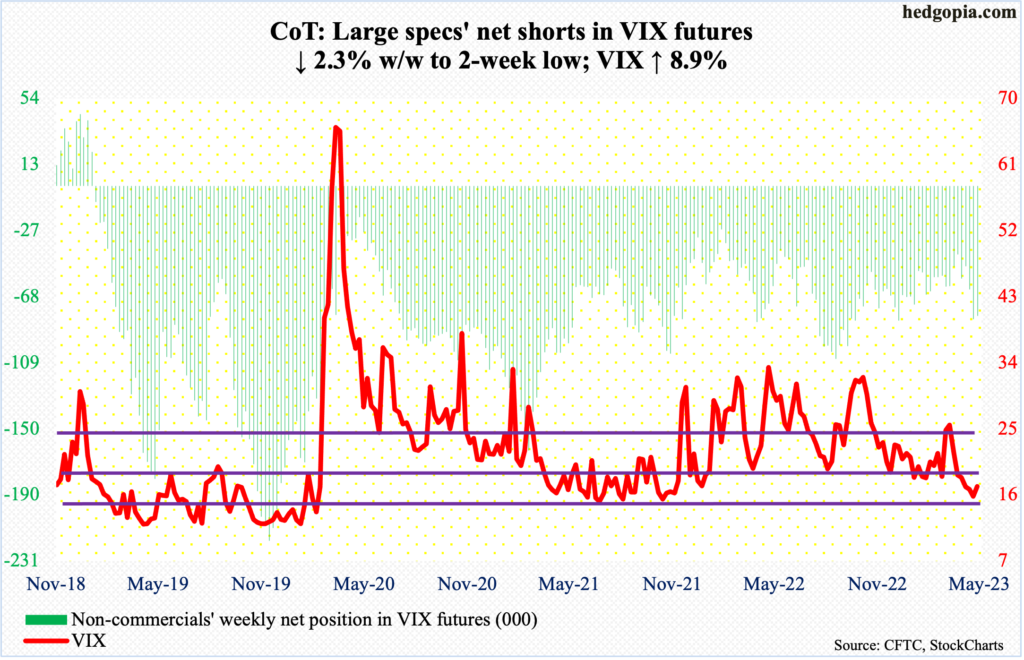
Monday’s low of 15.53 kissed the daily lower Bollinger band before rebounding. By Thursday, VIX ticked 21.33 intraday, but volatility bulls were unable to hold the gains, closing at 20.09 and leaving behind a long upper wick, followed by Friday’s smackdown to end the week at 17.19.
As things stand, the daily probably wants to go lower.
Thanks for reading!
