
Following futures positions of non-commercials are as of May 9, 2023.
10-year note: Currently net short 731.7k, down 17.4k.
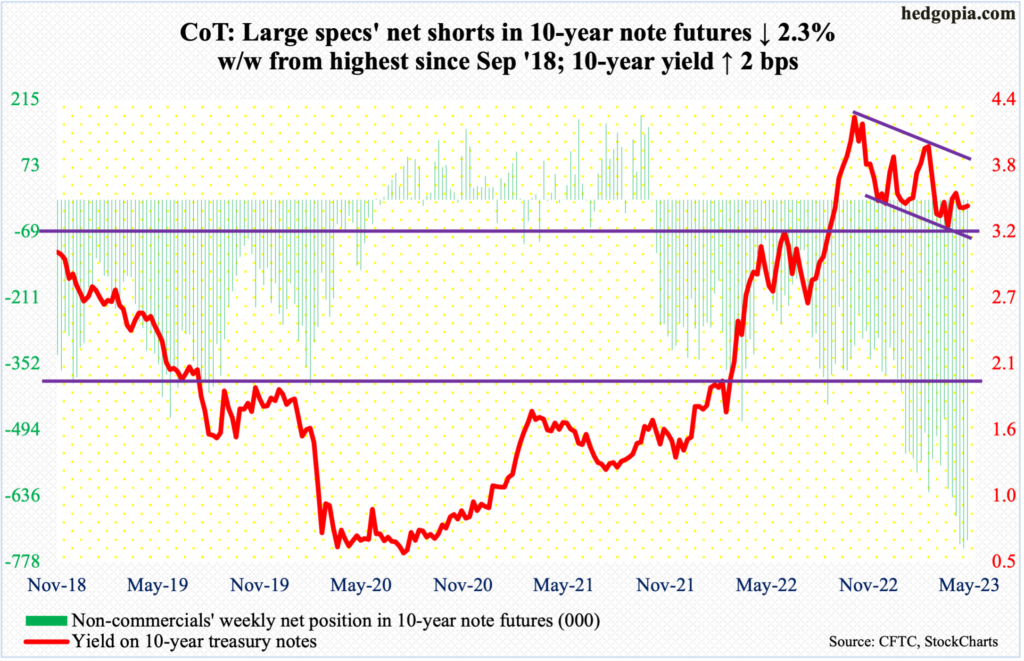
This week, April’s CPI (consumer price index) and PPI (producer price index) were published. Both showed continued decelerating trend in inflation – both consumer and producer.
In the 12 months to April, headline and core CPI increased 4.9 percent and 5.5 percent, having respectively peaked at 9.1 percent in June and 6.6 percent in September; since that peak, headline CPI has dropped every month. Headline and core PPI similarly softened to growth of 2.3 percent and 3.4 percent year-over-year, in that order. Both CPI and PPI rose less than expected.
These reports further embolden the futures traders who were already pricing in an end to the tightening cycle followed by a prompt Fed pivot. In the May 2-3 meeting, the Federal Reserve raised the fed funds rate by 25 basis points to a range of 500 basis points to 525 basis points. In March last year, the benchmark rates were zero to 25 basis points.
Fed funds futures now expect the Fed to begin to ease in September with a 25-basis-point cut. This will be followed by two more cuts of same increments in November and December to end the year between 425 basis points and 450 basis points. This is way too aggressive versus where Fed officials think things are headed. Post-FOMC meeting early this month, Chair Jerome Powell did drop hints of a pause, but he also made it clear members saw no cuts this year.
If past is prelude – at least beginning the Alan Greenspan era in 1987 – the central bank eventually tends to acquiesce the markets. Thus far, Powell and his team are saying the days of Fed put are over. Markets refuse to believe them. Odds favor the Fed will stare them down in due course.
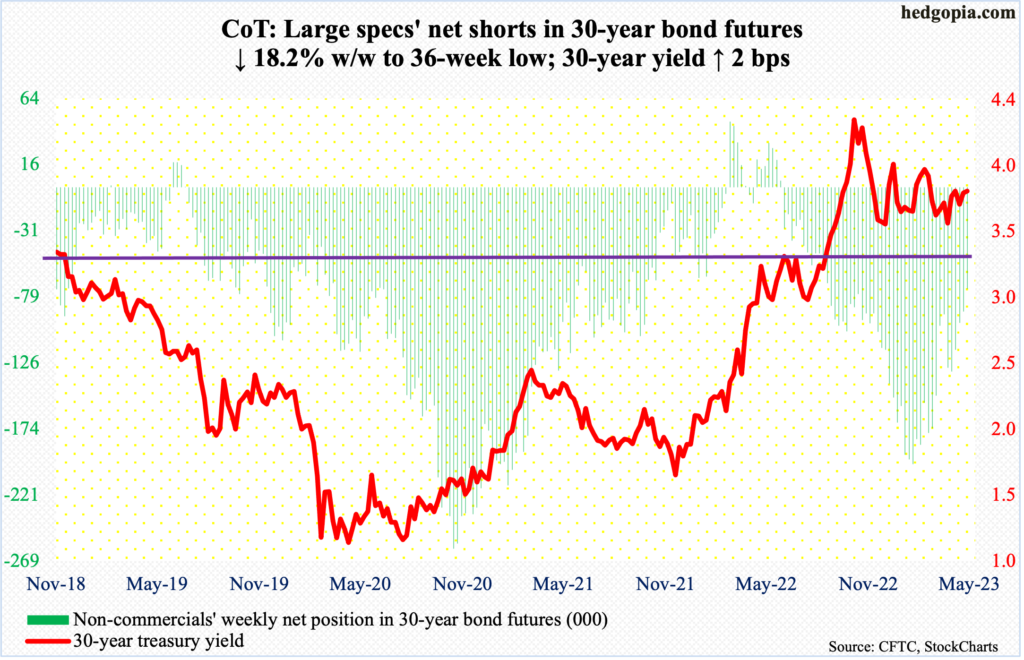
30-year bond: Currently net short 73.1k, down 16.3k.
Major economic releases for next week are as follows.
Monday brings Treasury International Capital data (March). In February, foreigners on a net basis sold $13.2 billion in US equities month-over-month to $12.3 trillion. In the 12 months to February, net sales totaled $191.6 billion, which is massive but much lower versus record net sales of $293.5 billion posted last August.
Retail sales (April), industrial production (April) and the NAHB housing market index (May) are scheduled for Tuesday.
March retail sales were down one percent m/m to a seasonally adjusted annual rate of $691.7 billion. The all-time high of $700.1 billion was hit this January.
Capacity utilization inched up 0.2 percent m/m in March to 79.8 percent. Last September’s 80.8 percent was the highest since January 2008.
Homebuilder optimism inched up a point m/m in April to 45 – a seven-month high. December’s 31 reading was the lowest since April 2020.
Housing starts (April) are due out on Wednesday. Starts slid 0.8 percent m/m in March to 1.42 million units (SAAR). January’s 1.33 million was the lowest since June 2020.
Existing home sales (April) will be published on Thursday. Sales in March dropped 2.4 percent m/m to 4.4 million units (SAAR), with January’s four million a multi-year low.
WTI crude oil: Currently net long 230.2k, up 567.
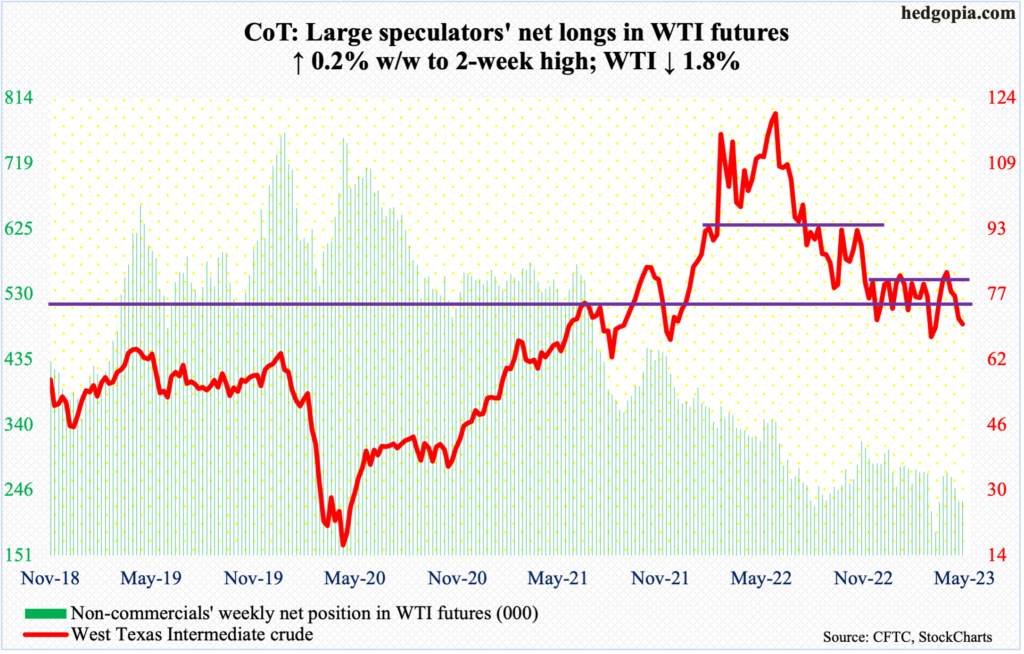
WTI ($70.04/barrel) was pushed back under a five-plus-month range between $71-$72 and $81-$82. The crude gave back 1.8 percent this week – its fourth straight weekly loss. On April 12, it retreated after tagging $83.53.
As things stand, the daily can continue lower. In the right circumstances for oil bears, bulls’ mettle will be tested at $63-$64.
In the meantime, as per the EIA, US crude production in the week to May 5 was unchanged week-over-week at 12.3 million barrels per day. Crude imports declined 843,000 b/d to 5.6 mb/d. As did gasoline and distillate stocks, which dropped 3.2 million barrels and 4.2 million barrels respectively to 219.7 million barrels and 106.2 million barrels. Crude stocks, however, increased three million barrels to 462.6 million barrels. Refinery utilization rose three-tenths of a percentage point to 91 percent.
E-mini S&P 500: Currently net short 376k, up 20.6k.
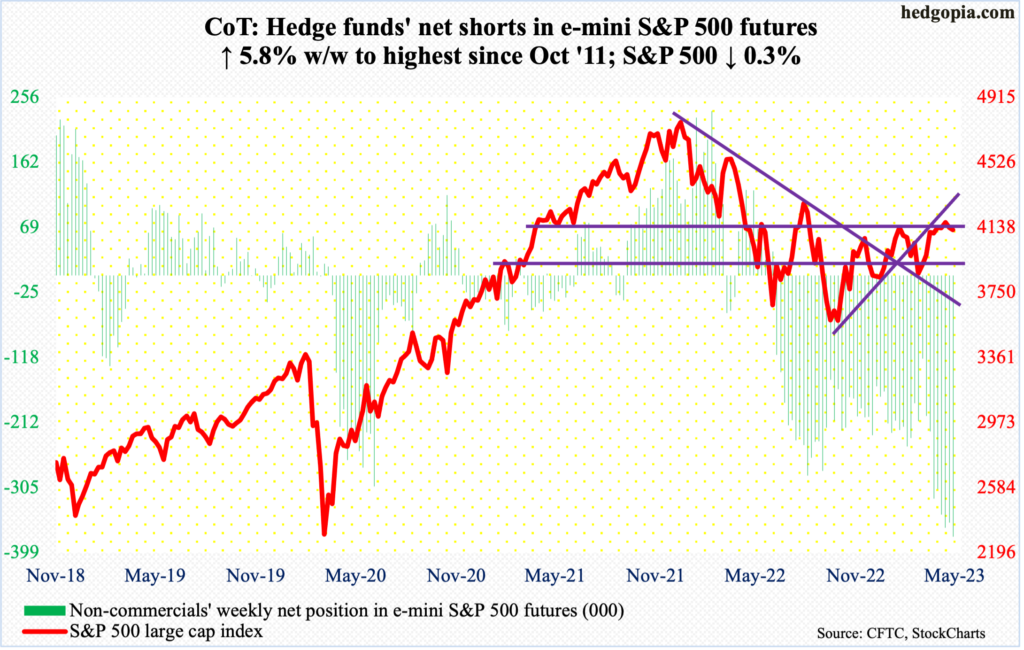
Equity bulls’ inability to meaningfully build on a breakout at 4100 early last month has encouraged non-commercials to accumulate a boatload of net shorts in e-mini S&P 500 futures and hang on to them. As of Tuesday, they were sitting on 376,023 contracts, which is the most net short exposure they have since October 2011; in the week to March 14 this year, they were only net short 119,819.
Back then, the S&P bottomed in October after dropping north of 21 percent from its May high. Short squeeze soon followed, with net shorts dropping from 382,984 in the week to October 25 to 79,928 in the week to February 7 (2012). This is what the bulls are hoping for. They are salivating over the prospects of a squeeze, but for that to occur, they have to deliver.
The nearest resistance lies at 4170s-4180s. In the first three sessions this week, 4100 was defended but they could only manage to rally the index to 1954, before sell orders came in. This ceiling needs to go for non-commercials to even begin to think about covering.
Euro: Currently net long 179.4k, up 5.9k.
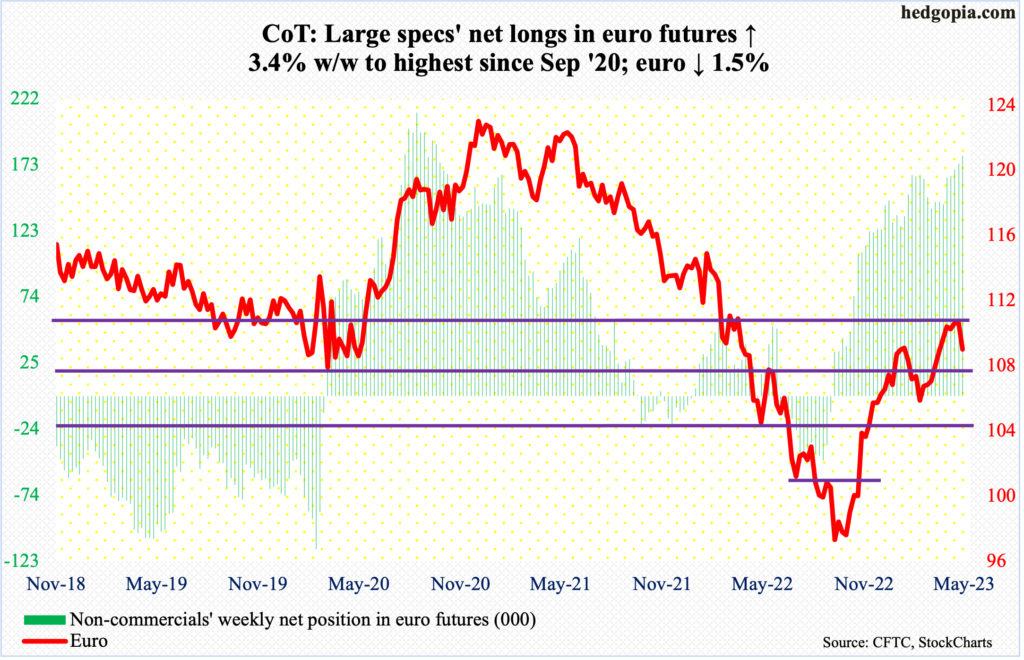
After three weekly spinning tops, the euro gave back 1.5 percent this week. Before this, the currency rallied 16-plus percent from last September’s low of $0.9559 through the April 26th high of $1.1095.
Euro bulls tried to push through $1.09-$1.10 for five weeks, but to no avail.
This has the potential to be an important reversal. Non-commercials are net long up to the gills, with holdings the highest since September 2020. Once they get convinced the currency has peaked, they will start reducing their long exposure.
In this scenario, $1.04-$1.05, which has been an important level going back at least eight years and which was reclaimed last December, has gained on significance. On Friday, the euro ($1.0862) essentially closed on its 50-day moving average ($1.0868), which approximates a rising trend line from last September’s low. Once this support goes, bears will start eyeing $1.04-$1.05, which approximates the 200-day at $1.0441.
Gold: Currently net long 195.8k, up 247.
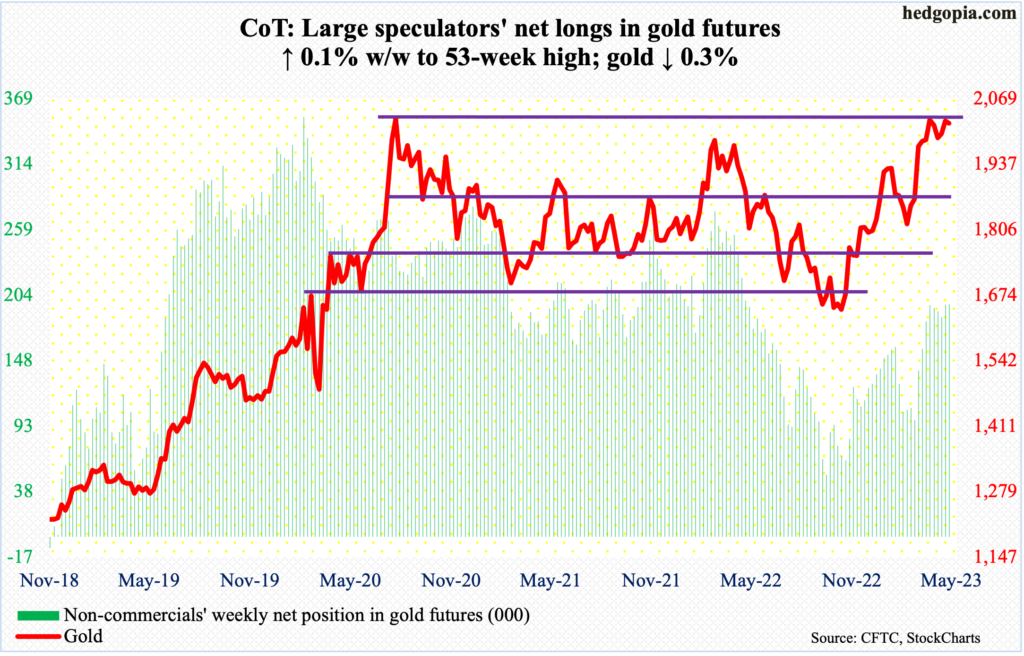
Gold gave back $5 to end the week at $2,020/ounce. The story remains the same. Gold bugs have so far been unable to take out the previous highs – $2,089 from August 2020 and $2,079 from March last year – with the recent high of $2,085 from the 4th this month.
In 2020 and 2022, the metal retreated sharply once those levels were hit. This time around, gold has refused to falter, although it remains way off this month’s high. But the longer this goes on, there is a chance the longs will begin to experience fatigue. If so, they can regroup around $1,970s, which is a must-hold.
Nasdaq 100 index (mini): Currently net long 21.4k, up 8.1k.
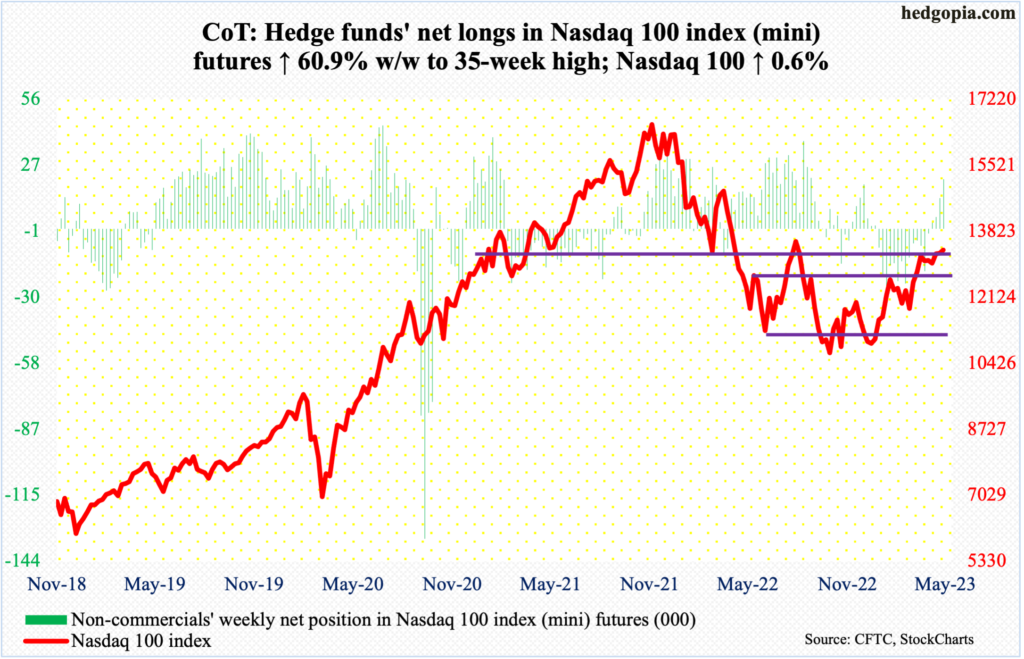
The Nasdaq 100 rallied 0.6 percent this week. In contrast, both the S&P 500 and the Russell 2000 finished in the red. Tech bulls should find it heartening that an intra-week drop to 13100s attracted bids, closing the week at 13340. This is potentially significant in that the Nasdaq 100 was rejected/went sideways at 13100s for four weeks before the tech-heavy index poked its head out three weeks ago. This week, bids showed up at that support in the first three sessions.
It is hard to label this a decisive breakout retest, but of course it is constructive. It is now up to the bulls to build on it. Non-commercials are doing their bit, with net longs at a 35-week high.
Russell 2000 mini-index: Currently net short 59.7k, up 257.
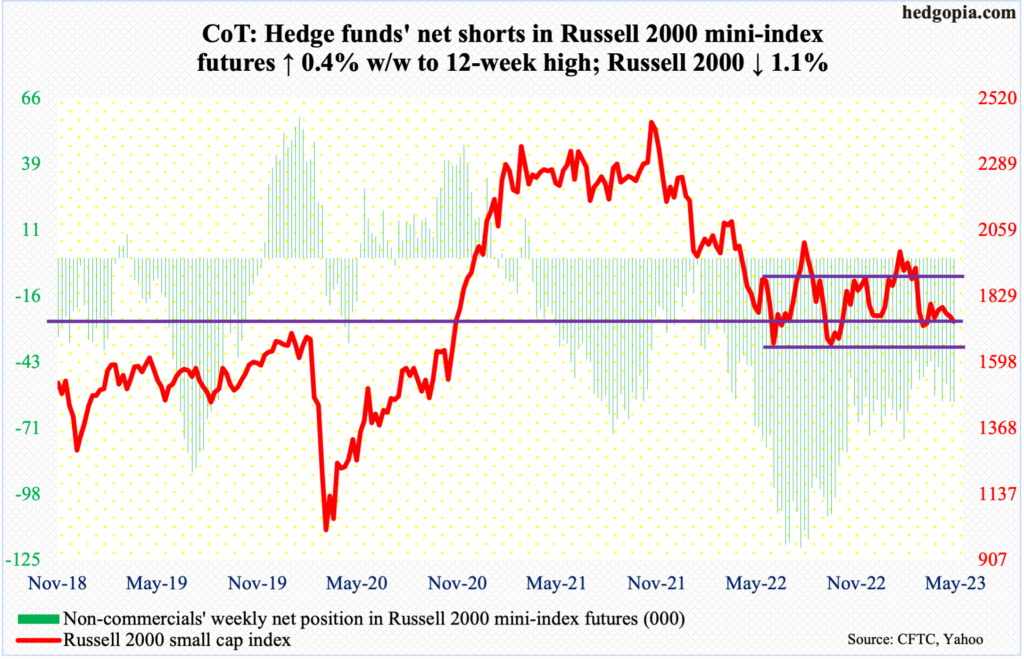
Small-cap bulls continued to face trouble at a falling trendline from February’s high. Intraday Monday and Wednesday, the Russell 2000 ticked 1768 and 1773 respectively but failed to hang on to the gains, closing out the week at 1741, down 1.1 percent for the week. Continued resistance at the trendline would mean 1700 will again get tested sooner or later. The level was most recently tested on the 4th – successfully. Support at 1700 goes back to August 2018, and from January last year the Russell 2000 has been rangebound between 1700 and 1900 (more on this here).
Small-cap bears have been hammering on it for a year now, with nothing to show for it – except for a brief drop to 1640s last June and October which was bought.
US Dollar Index: Currently net long 11.2k, down 194.
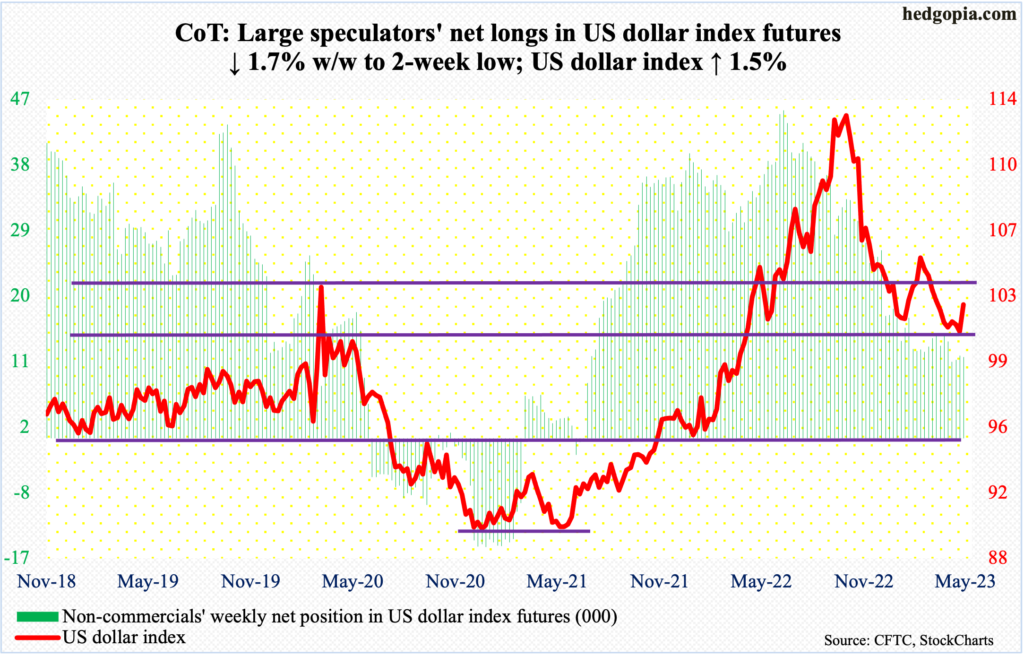
After four weeks of sideways action at 100-101, wherein lies eight-year horizontal support/resistance, the US dollar index jumped 1.5 percent this week to 102.51 – second up week in 11 weeks. The index peaked at 105.87 on March 8. Before that in January 2021, it bottomed at 89.17, and at 89.52 in May that year.
Dollar bulls have a decent opportunity to test 103-104, which was lost mid-March. The index broke out of this level last June, subsequently tagging 114.75 in September, before reversing.
VIX: Currently net short 67.8k, down 12.1k.
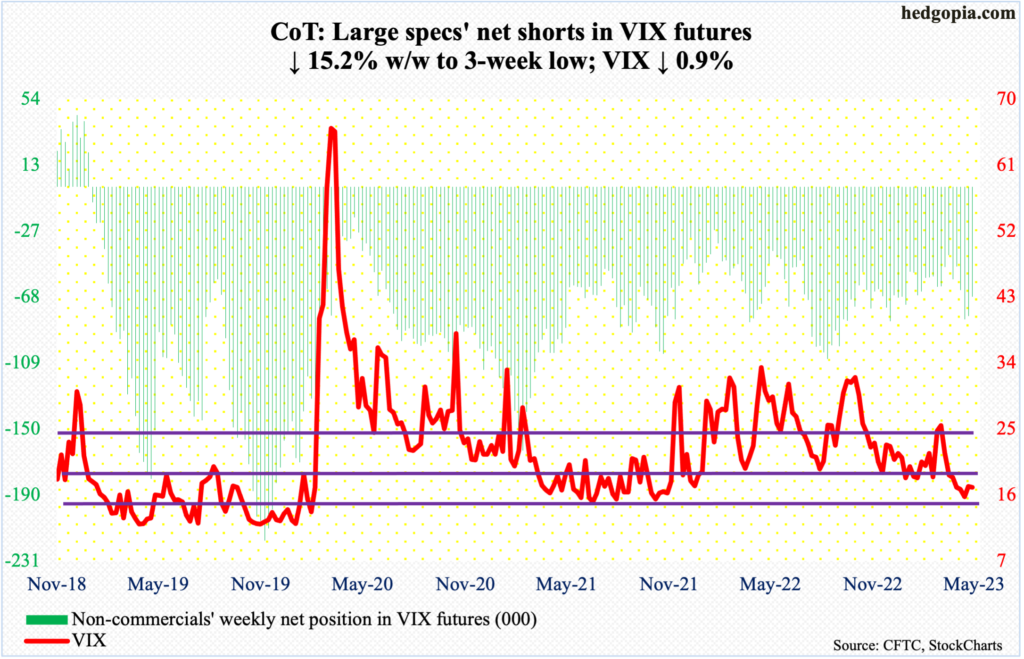
Volatility is quiet.
VIX declined 0.16 points this week to 17.03, with a range of 18.31 and 16.36 – ending right on a rising trendline from November 2017 when the volatility index reached an all-time low of 8.56. On the 4th this month, when VIX tagged 21.33, volatility bulls had an opportunity to decisively reclaim the trendline but came up short. This resistance needs to fall before they regain momentum.
Thanks for reading!
