
Following futures positions of non-commercials are as of July 3, 2023.
10-year note: Currently net short 780.7k, down 20.3k.
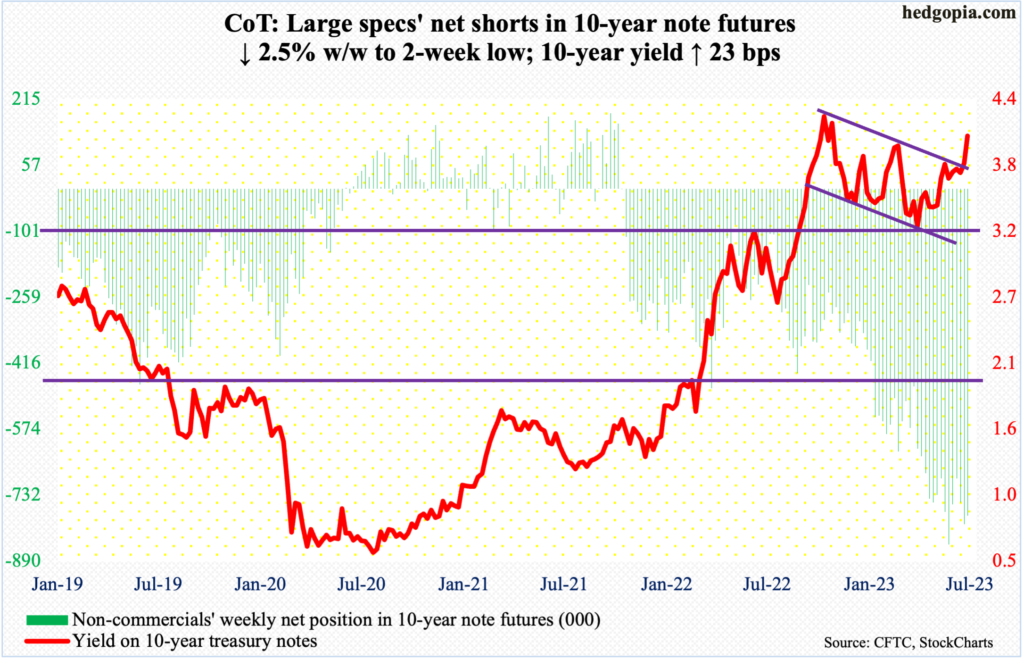
Non-commercials’ persistence is paying off. They are – have been – sitting on loads of net shorts in 10-year note futures, which posted a new record of 850,421 contracts in the week to May 30 (this year).
They have consistently stayed net short since October 2021. The 10-year yield ended that month at 1.56 percent. One year later – on October 21 last year, to be specific – the notes were yielding 4.33 percent before heading south; in that week, these traders were sitting on 247,748 contracts and were so convinced of higher rates that they kept adding to net shorts. However, by April 6, the 10-year yield dropped to 3.25 percent, but this was not enough to deter these traders.
All along, after last October’s peak, the 10-year began trading within a descending channel. This week, it broke out, ending up 23 basis points to 4.05 percent. This was a vindication of the conviction non-commercials had shown. The question now is, what next?
On Friday, the 10-year touched the February (this year) high of 4.09 percent before heading south a little. From here on, the higher the yields go, the higher the temptation for bond investors to get into the long end of the curve, given how far the short rates – the fed funds rate – have come up and the damage it is likely to inflict to the economy in quarters to come.
If and when non-commercials begin to subscribe to this view and begin cutting their holdings, this in and of itself can begin to put downward pressure on the 10-year yield. Fingers crossed! It is one thing to be right and another to overstay one’s welcome.
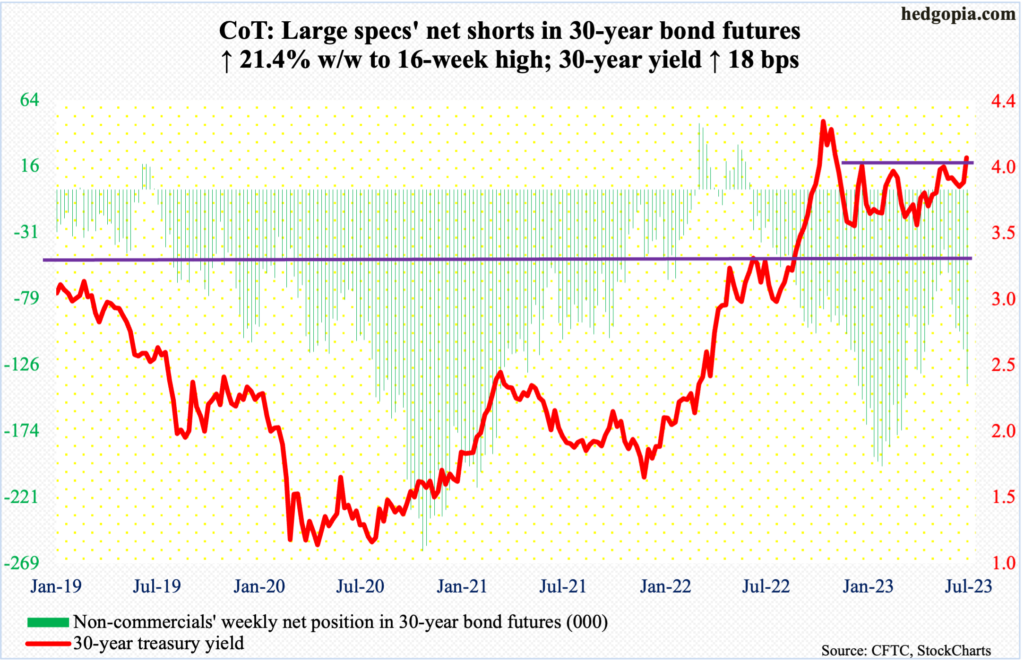
30-year bond: Currently net short 139.9k, up 24.7k.
Major US economic releases for next week are as follows.
The NFIB optimism index (June) is due out on Tuesday. Small-business optimism inched up four-tenths of a point month-over-month in May to 89.4 – a two-month high.
Wednesday brings the consumer price index (June). In the 12 months to May, headline and core CPI increased 4.1 percent and 5.3 percent, in that order. They respectively peaked last year at 9.1 percent (June) and 6.6 percent (September).
The producer price index (June) is scheduled for Thursday. Headline and core wholesale prices respectively rose 1.1 percent and 2.8 percent in May from a year ago.
The University of Michigan’s consumer sentiment index (July, preliminary) will come out on Friday. Sentiment jumped 5.2 points m/m in June to 64.4 – a four-month high – and up substantially from a record low 50 a year ago.
WTI crude oil: Currently net long 173.7k, up 14.2k.
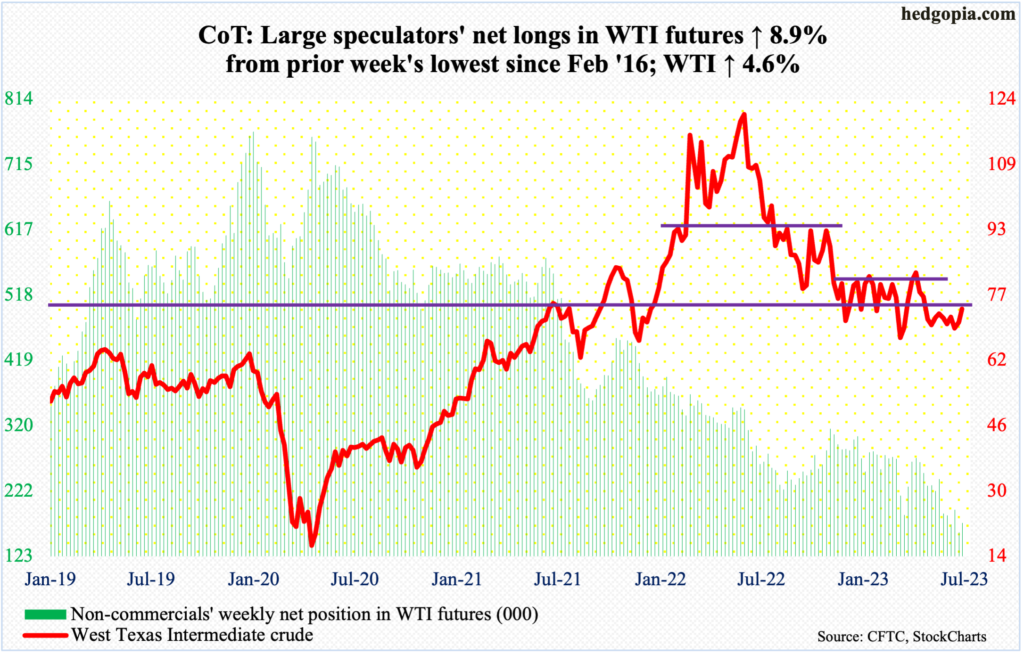
Oil bulls’ consistent defense of $67 for more than a month resulted in improved action this week, as West Texas Intermediate crude pushed back into a seven-month range between $71-$72 and $81-$82.
On Friday, an intraday drop to $71.19, which also approximated the 50-day moving average at $71.31, actively drew bids, ending the session/week at $73.86. The upper end of the range has not been tested for two and a half months now. It is unlikely this happens anytime soon.
The daily is beginning to get overbought, and the crude is just above the daily upper Bollinger band. In the best of circumstances, bulls have a shot at $75 for now.
In the meantime, as per the EIA, US crude production in the week to June 30 jumped 200,000 barrels per day week-over-week to 12.4 million b/d. Crude imports increased as well – up 458,000 b/d to 7 mb/d. Stocks of crude, gasoline, and distillates all dropped – respectively down 1.5 million barrels, 2.5 million barrels and 1 million barrels to 452.2 million barrels, 219.5 million barrels and 113.4 million barrels. Refinery utilization declined 1.1 percentage point to 91.1 percent.
E-mini S&P 500: Currently net short 207.2k, down 1.1k.
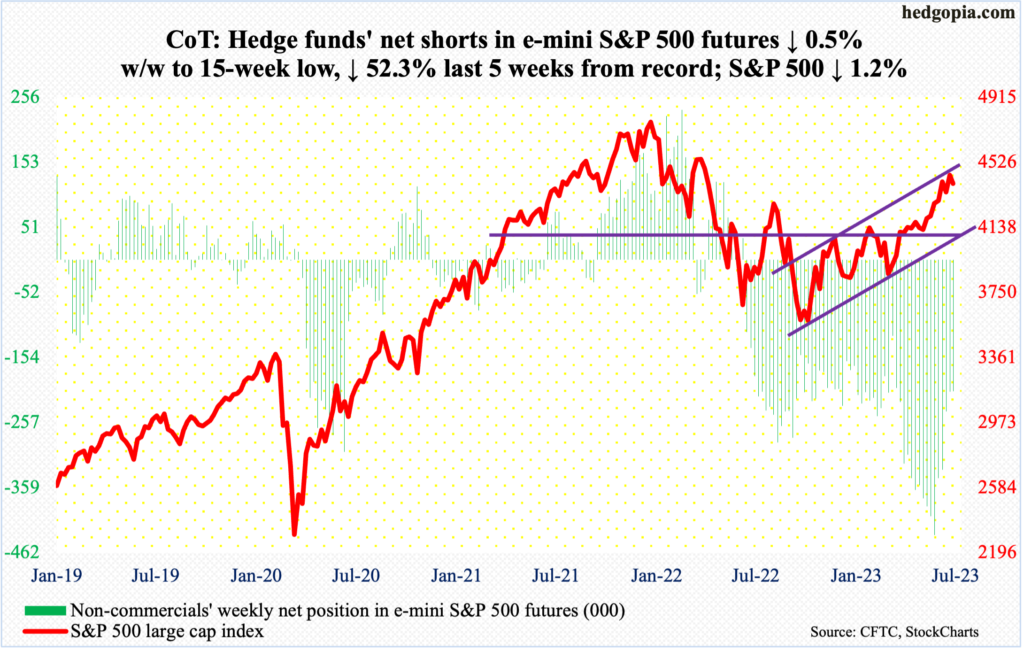
After last October’s bottom at 3492, the S&P 500 tried to take out 4100 early December but was rejected. This was followed by several more attempts, but the ceiling would not give way until early April. In the following three months, the large cap index rallied just under nine percent.
Last Friday, the S&P 500 touched 4458 intraday, which was a test of another crucial resistance – that of the upper trendline of a rising channel from the October low. It is probable this resistance holds. The test is taking place after the index has rallied 27.7 percent over less than nine months, and bullish sentiment is elevated.
In the week to Tuesday, the Investors Intelligence bullish percent jumped 4.9 percentage points w/w to 54.9 percent. This was the highest reading since November 2021 and the fifth week in a row bulls’ count stayed north of 50 percent. The bearish percent slid three-tenths of a percentage point to 18.3 percent, which has not been this low since August 2021. As a result, for the first time in nearly two years, the ratio of bulls to bears hit three (more on this here).
Ahead, odds favor selling accelerates once 4320s get breached. This was a high from last August and was recaptured on June 12, followed by a successful breakout retest on the 26th. Once this level gives way, bears will be eyeing 4100 – a make or break for both camps.
Euro: Currently net long 142.8k, down 2.2k.
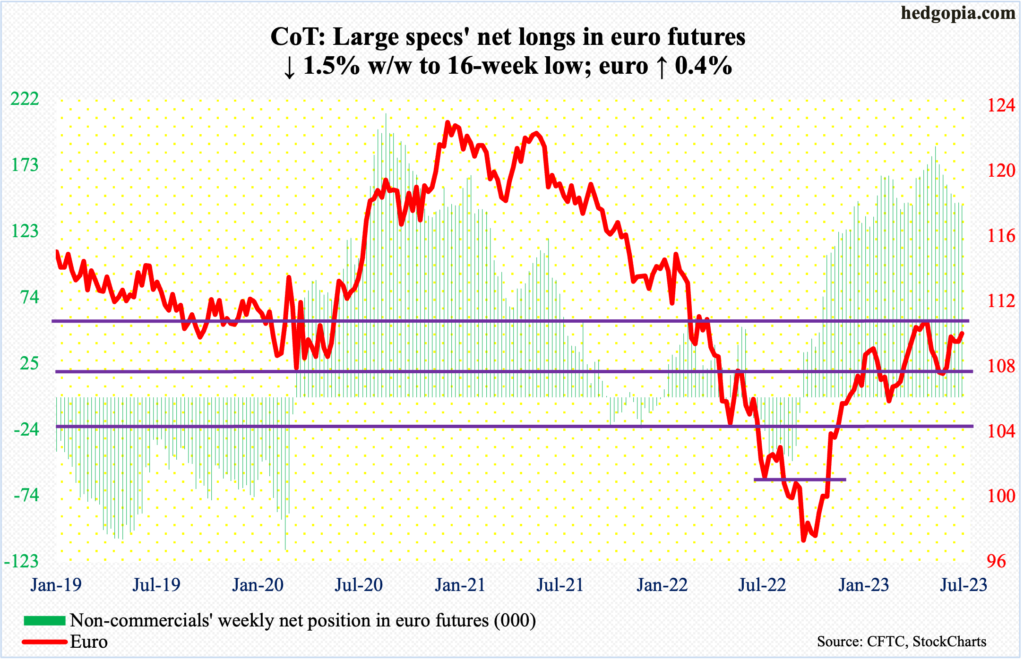
Euro bulls have not given up. They keep hammering on $1.09-$1.10, which rejected rally attempts for several weeks during April and early May this year – as well as the last four weeks. This Friday, the euro ticked $1.0981 intraday, closing the session/week at $1.0963.
If strength persists, the currency at the most is likely to head toward $1.1090s, which is a high from late April to early May, and that will be a trading opportunity to sell. Else, there is horizontal support at $1.07-$1.08.
Gold: Currently net long 163.1k, up 11.2k.
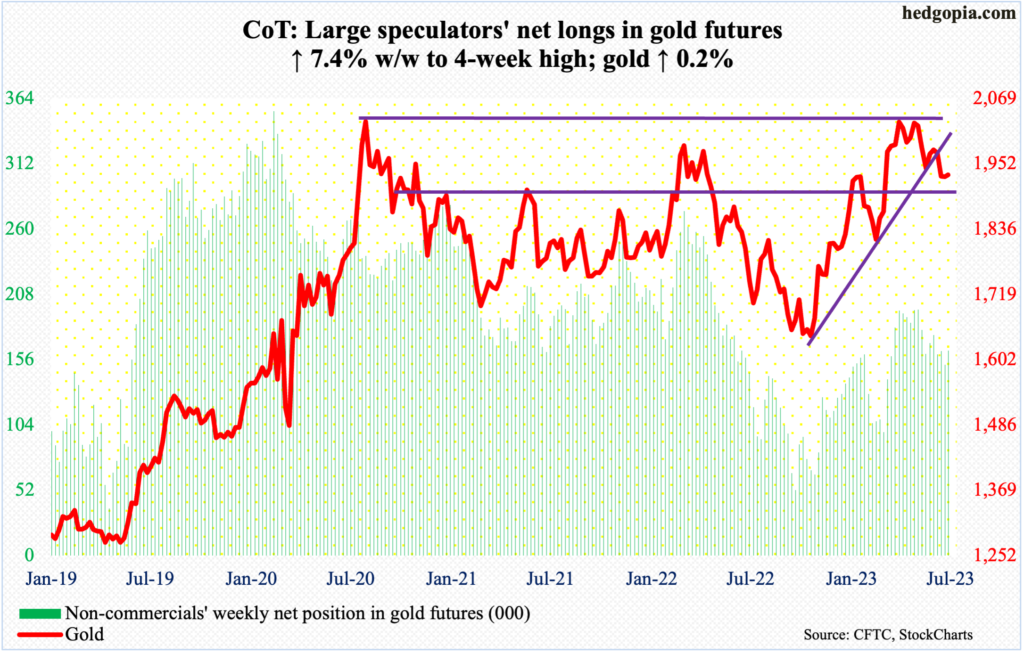
Gold is marking time around $1,920s. This week, it added $3.10 to $1,932.50/ounce, with a low of $1,908.50 on Thursday. Last week, on June 29, $1,900.60 was tagged. Earlier, on May 4, in a spinning top session, the metal ticked $2,085.40 before retreating. This was an important price point. In the past, $2,089.20 was tagged in August 2020 – an all-time high – and $2,078.80 in March 2022.
Gold bugs have failed to break out of $2,080s yet have so far done a good job of defending $1,920s, a breach of which will prove costly. Long-term, a breach looks imminent, but could go either way near- to medium-term.
Nasdaq 100 index (mini): Currently net long 5.5k, down 11.8k.
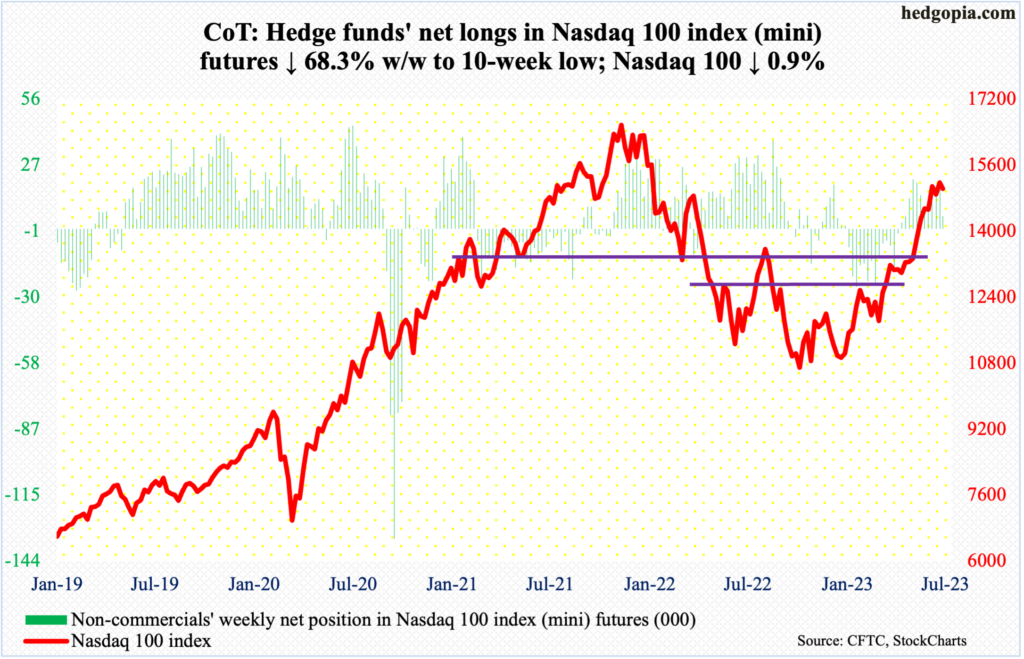
On June 16, the Nasdaq 100 retreated after touching 15285 intraday. This Wednesday, it tagged 15275. This equates to three trading weeks of going nowhere. Back then, shorter-term averages were still rising. Now, they are flattish. The distance between the 10- and 20-day is negligible, with decent odds of a cross-down in the sessions ahead.
If this materializes, this would have come after a rip-roaring 46.4-percent surge from last October’s low.
On nearly all timeframes, conditions are overbought, with the weekly RSI into the 70s for the last seven weeks. Nearest support lies at 14600s, with the 50-day at 14179. The tech-heavy index closed last week at 15037, with a shooting star on Friday.
Russell 2000 mini-index: Currently net short 67.5k, up 3.8k.
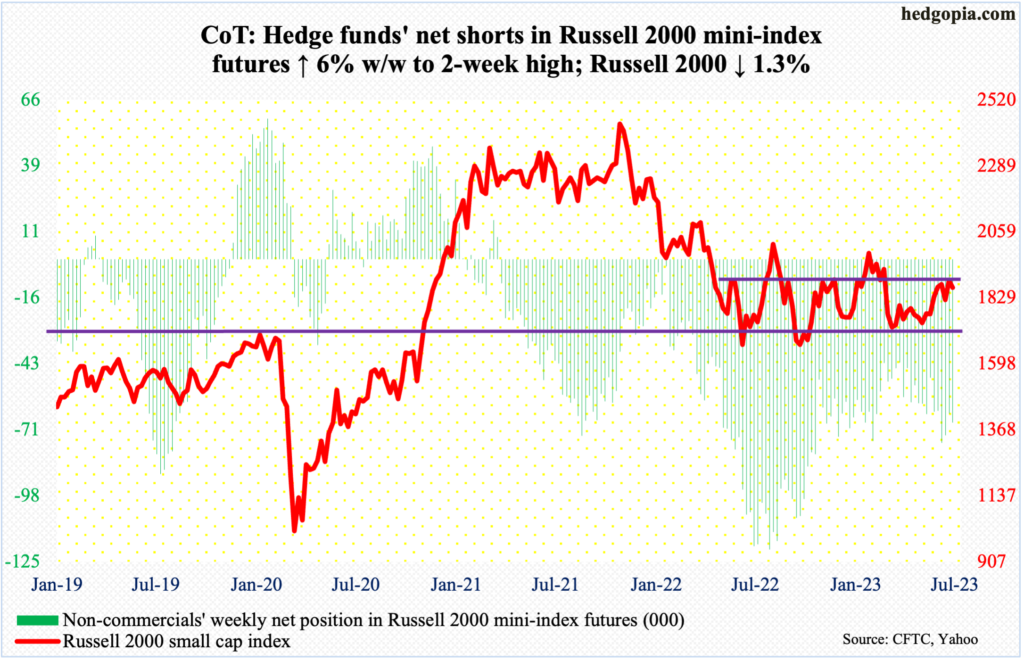
Both small-cap bulls and bears are defending their turf. The former has been on the defensive for a while now, as 1900 – the top end of a 200-point range intact since January last year – refuses to break. At the same time, they have been stepping up to save the midpoint of the range at 1800.
In the first two trading sessions this week, the Russell 2000 ticked 1899 and 1892 intraday before offers overwhelmed bids. Thursday’s intraday drop to 1824, however, was bought. In the end, the small cap index finished the week at 1865, down 1.3 percent for the week.
Until 1900 gets decisively recaptured, it remains bears’ ball to lose.
US Dollar Index: Currently net long 14.3k, down 651.
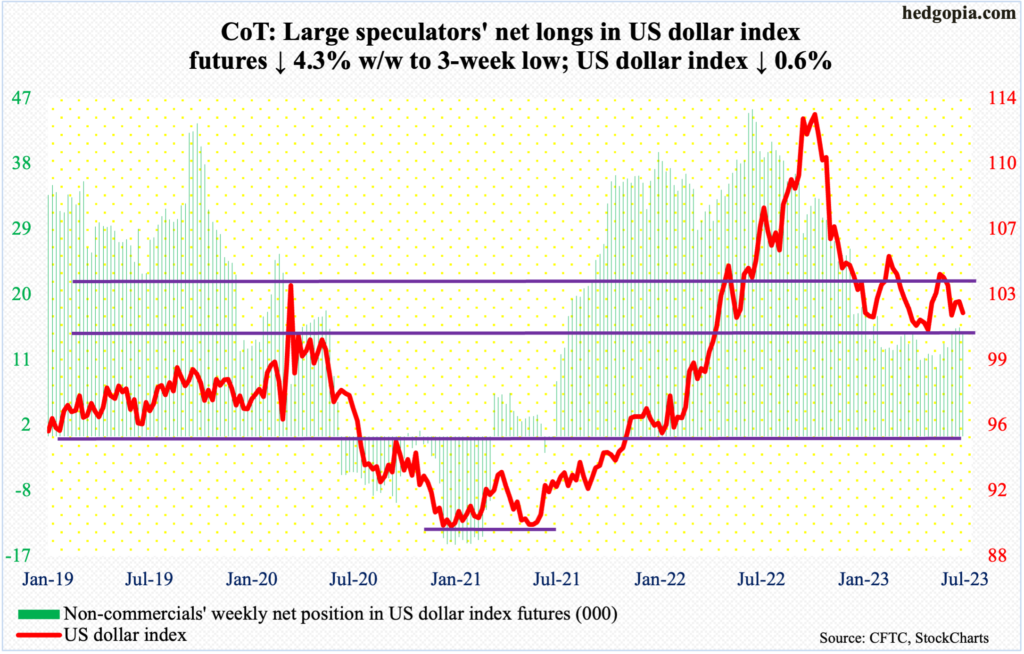
Dollar bulls’ inability to take out 103-104, which resisted breakout attempts several times in May and June, is raising the odds that they will be forced to defend horizontal support at 100-101, which goes back eight years.
After Thursday’s intraday high of 103.28 invited sellers, the US dollar index reacted to Friday’s June jobs report by a 0.9-percent tumble, slicing through the 50-day to close the week out at 101.95. There is more room for weakness on the daily.
Support at 100-101 is a must-hold.
VIX: Currently net short 54.9k, down 9.8k.
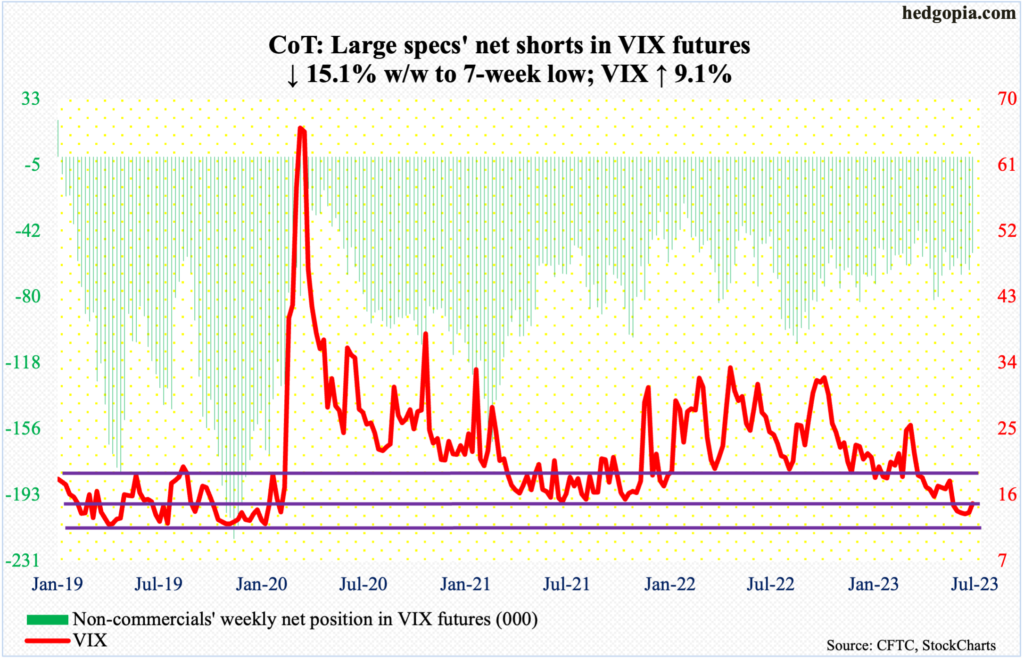
Volatility perked up this week. VIX rallied 1.24 points to 14.83. At one point on Thursday, in fact, the volatility index rose as high as 17.08, but sold off leaving behind a long upper wick on both the daily and weekly.
Concurrently, on both these timeframes, VIX acts like it is itching to rally.
Thanks for reading!
