
Following futures positions of non-commercials are as of July 25, 2023.
10-year note: Currently net short 623.8k, down 5.8k.
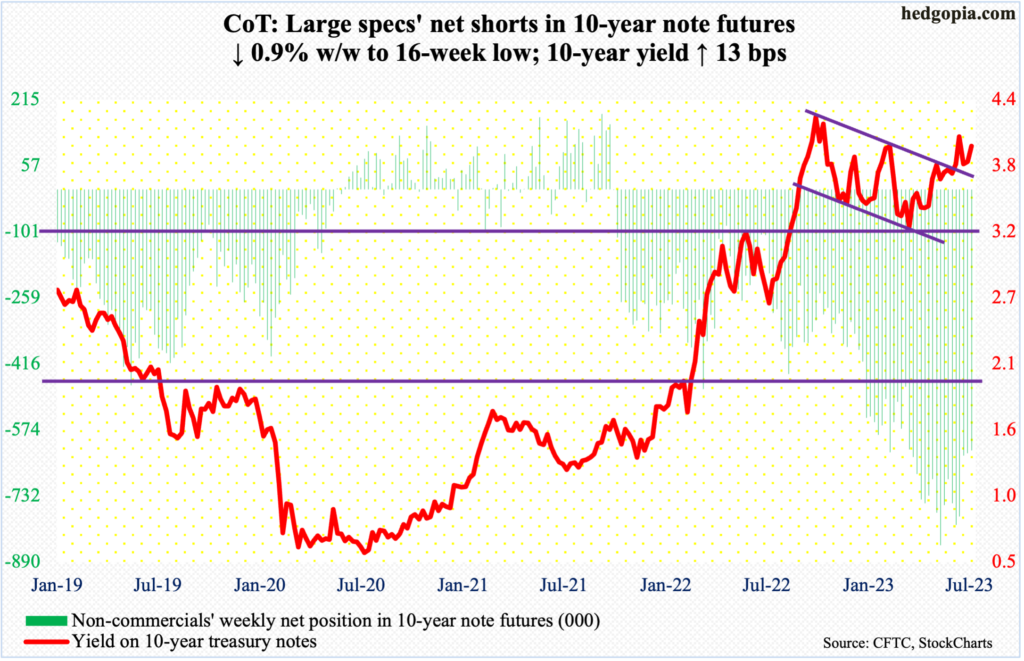
This week, the Federal Reserve raised the fed funds rate by 25 basis points, to a range of 525 basis points to 550 basis points. Fourteen months ago in March last year, these rates were zero to 25 basis points – left there languishing for two whole years post-Covid economic disruptions.
This has been a rapid 525-basis-point increase in just over a year. An increasing number of market participants are now saying this is the terminal rate – meaning the end of the tightening cycle. Futures traders have been saying that for a while; they are in fact betting on the central bank to begin to cut next May and end 2024 between 400 basis points and 425 basis points. This is very aggressive.
The Fed is nowhere near that. This week, both the FOMC statement and Chair Jerome Powell before the press made it clear September is a live meeting, suggesting a pause is as much possible as a hike. Yes, inflation has trended lower from last year’s four-decade highs, but core inflation is more than twice the Fed’s two percent objective.
Powell is also having to deal with rapidly easing financial conditions, which runs counter to monetary tightening (more on this here). In this regard, both equity bulls and futures traders cannot be right. For the level of easing expected by these traders to occur, the economy will have to significantly decelerate/enter recession, which markets have not yet priced in – either in equities or long bonds.
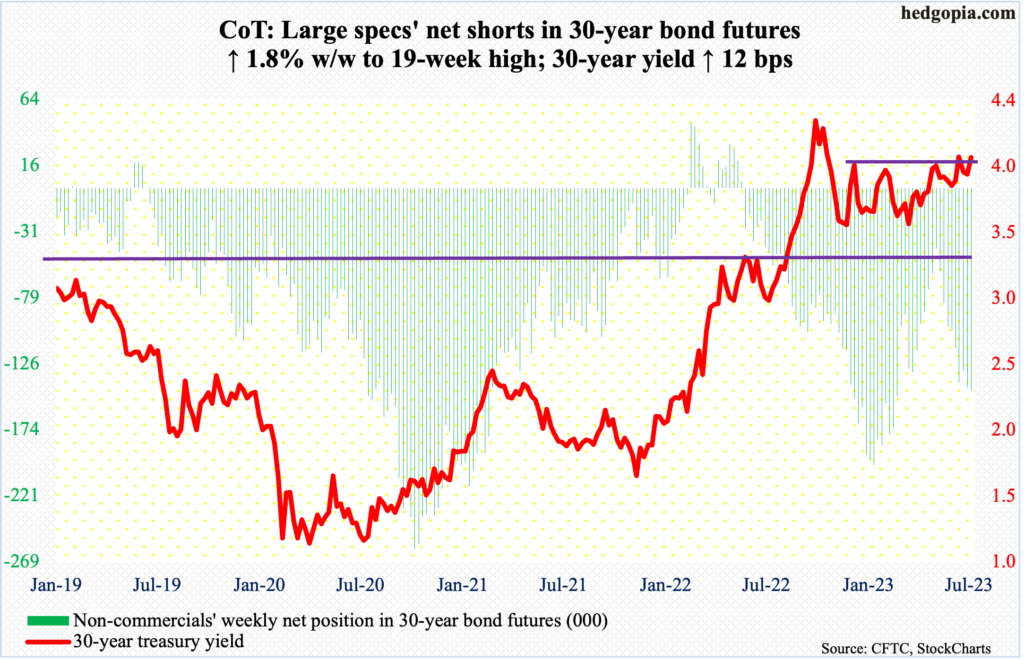
30-year bond: Currently net short 145.8k, up 2.6k.
Major US economic releases for next week are as follows.
The ISM manufacturing index (July) and JOLTs job openings (June) are scheduled for Tuesday.
Manufacturing activity declined nine-tenths of a percentage point month-over-month in June to 46 percent. This was the eighth month in a row of sub-50 reading.
In May, non-farm job openings fell 496,000 m/m to 9.8 million. In March last year, openings peaked at a record 12 million, subsequently dropping to 9.7 million this March.
On Thursday, labor productivity (2Q23), durable goods orders (June, revised) and the ISM services index (July) are on tap.
Non-farm output per hour contracted at an annual rate of 2.1 percent in 1Q23.
Preliminarily in June, orders for non-defense capital goods ex-aircraft – proxy for business capex plans – rose 0.2 percent m/m to a seasonally adjusted annual rate of $74.1 billion, which is a fresh record.
In May, services activity jumped 3.6 percentage points m/m to 53.9 percent. Activity has persistently remained above 50, except for last December’s brief drop to 49.2 percent.
Friday brings payroll (July). In the first half this year, an average of 278,000 non-farm jobs has been added each month. This compares to a monthly average last year of 399,000, and 606,000 before that in 2021.
WTI crude oil: Currently net long 267.7k, up 12.6k.
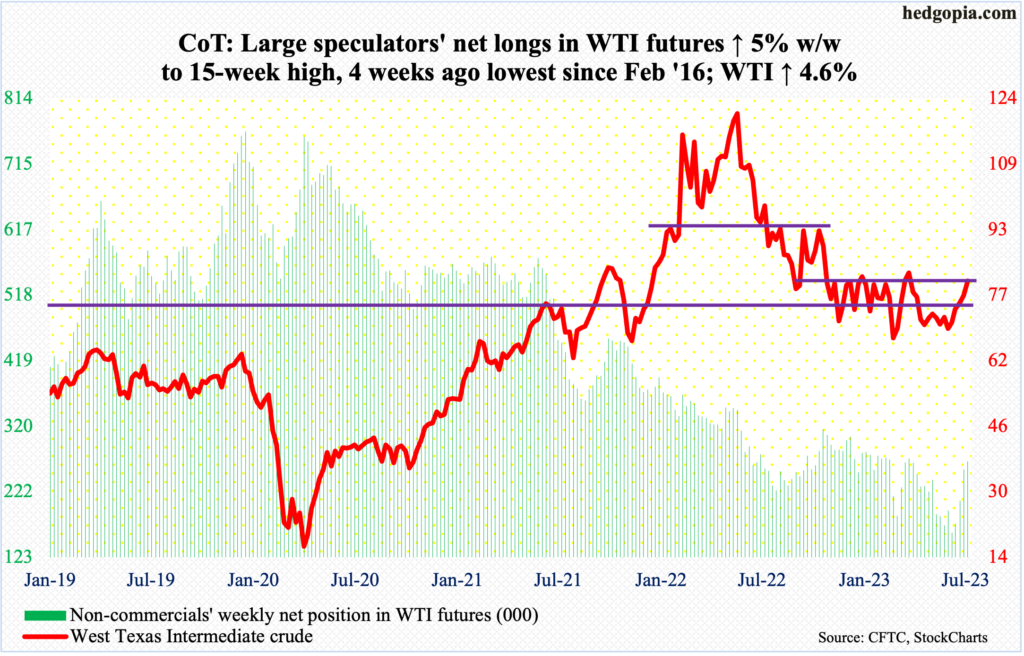
After rallying for five weeks in a row, West Texas Intermediate crude ($80.58/barrel) is back at testing the upper bound of an eight-month range between $71-$72 and $81-$82. The crude has not traded this high since April 19th; a week before that, it tagged $83.53 before coming under decent pressure, touching $63.53 early May. The April high has now gained in importance.
There is room for continued rally on both the weekly and monthly. A range breakout, followed by a higher high past the April high will be a meaningful development for oil bulls.
In the meantime, as per the EIA, US crude production in the week to July 21 dropped 100,000 barrels per day week-over-week to 12.2 million b/d. Crude imports fell as well, down 807,000 b/d to 6.4 mb/d. Stocks of crude, gasoline, and distillates all declined – respectively down 600,000 barrels, 786,000 barrels and 245,000 barrels to 456.8 million barrels, 217.6 million barrels and 117.9 million barrels. Refinery utilization edged lower nine-tenths of a percentage point to 93.4 percent.
E-mini S&P 500: Currently net short 232.6k, down 31.1k.
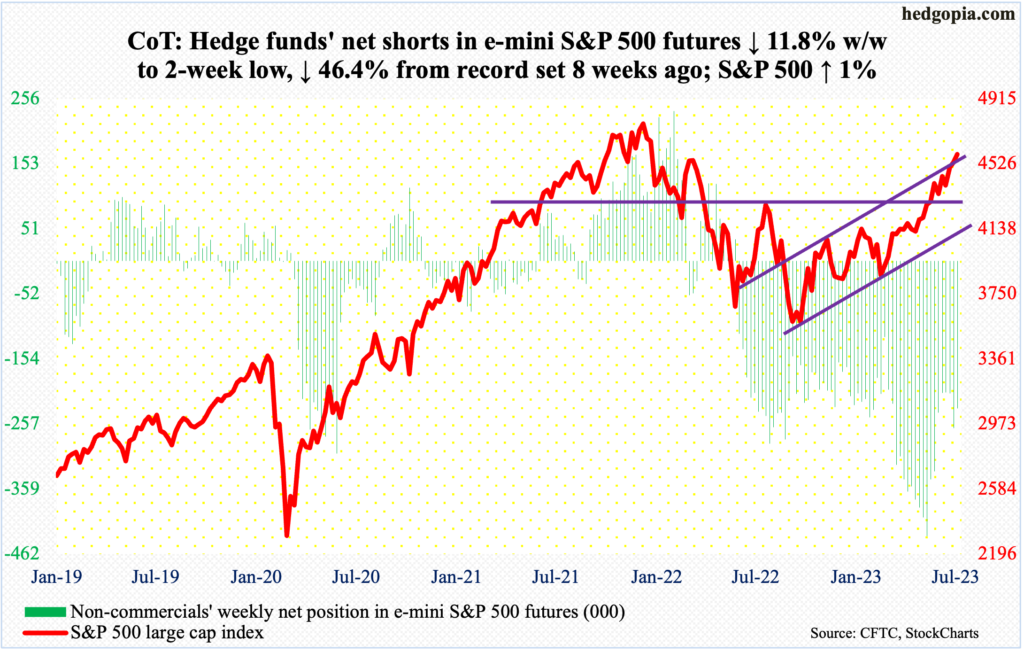
Equity bulls prevented the S&P 500 from forming yet another potentially bearish weekly candle on time. Until Thursday, the large cap index was on track for a weekly gravestone doji. This would follow last week’s shooting star. Friday’s one-percent rally saved the week for the bulls.
When it was all said and done, the index (4582) rallied one percent for the week, finishing right on short-term horizontal resistance at 4580s. Unable to break out next week should embolden the bears, who were able to force an intraday reversal on Thursday for a bearish engulfing candle.
Conditions remain overbought and have been that way for at least a few weeks. The weekly RSI just entered the 70 territory, ending the week at 70.52.
Immediately ahead, there is decent support at 4450s. After that comes the make-or-break 4320s, which the S&P 500 broke out of on June 12, followed by a successful retest on June 26.
Euro: Currently net long 177.2k, down 1.6k.
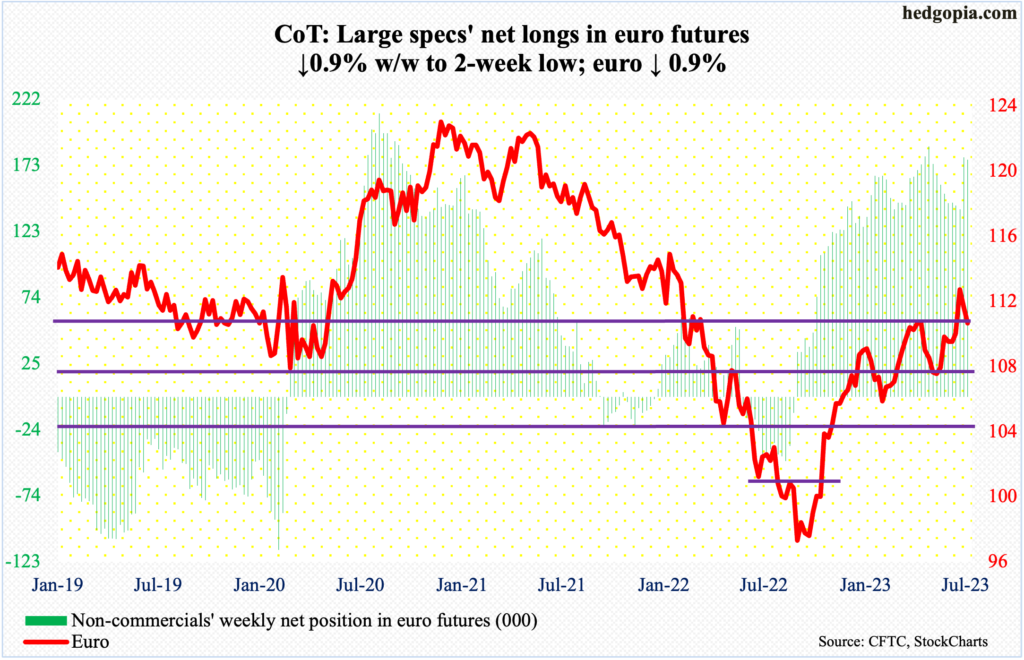
On Thursday, when the European Central Bank raised its benchmark rate by 25 basis points and signaled that a pause in September was possible, the euro formed a massive bearish engulfing candle.
It ended the week at $1.1025, which essentially is a retest of a breakout two weeks ago at $1.09-$1.10. Following that breakout, the currency went on to touch $1.1270 on the 18th, but only to then weaken.
The euro has had quite a rally – from last September’s low of $0.9559, and $1.0635 in late May. Odds favor the bulls will in due course fail to save $1.09-$1.10.
Gold: Currently net long 173.6k, down 19.7k.
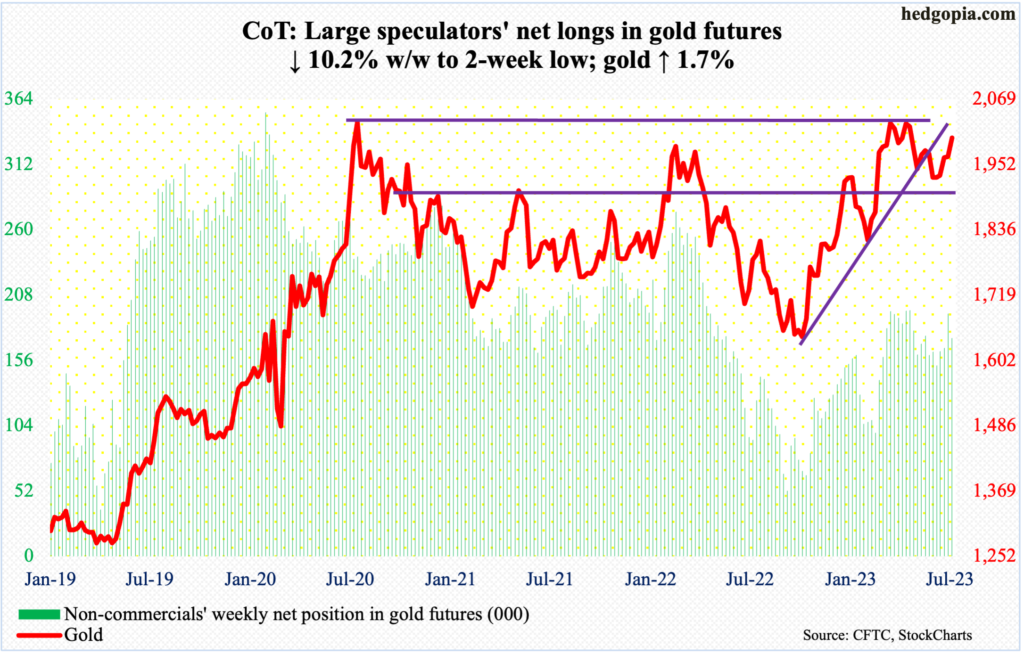
Gold had its fourth consecutive up week, quietly rallying 1.7 percent this week to $2,000/ounce. The metal has been denied here in the past, including in June. A decisive takeout of $2,000 opens the door toward $2,080s, which has proven to be impenetrable.
On May 4 (this year), in a spinning top session, the metal ticked $2,085 before pulling back. In the past, $2,089 was tagged in August 2020 – an all-time high – and $2,079 in March 2022.
Gold bugs should be happy in that the May top did not result in a sustained breach of $1,920s and that horizontal resistance at $1,980s failed to stop the latest advance. A bigger test lies ahead – which is if $2,000 gives in or not.
Nasdaq 100 index (mini): Currently net short 10.7k, up 11.9k.
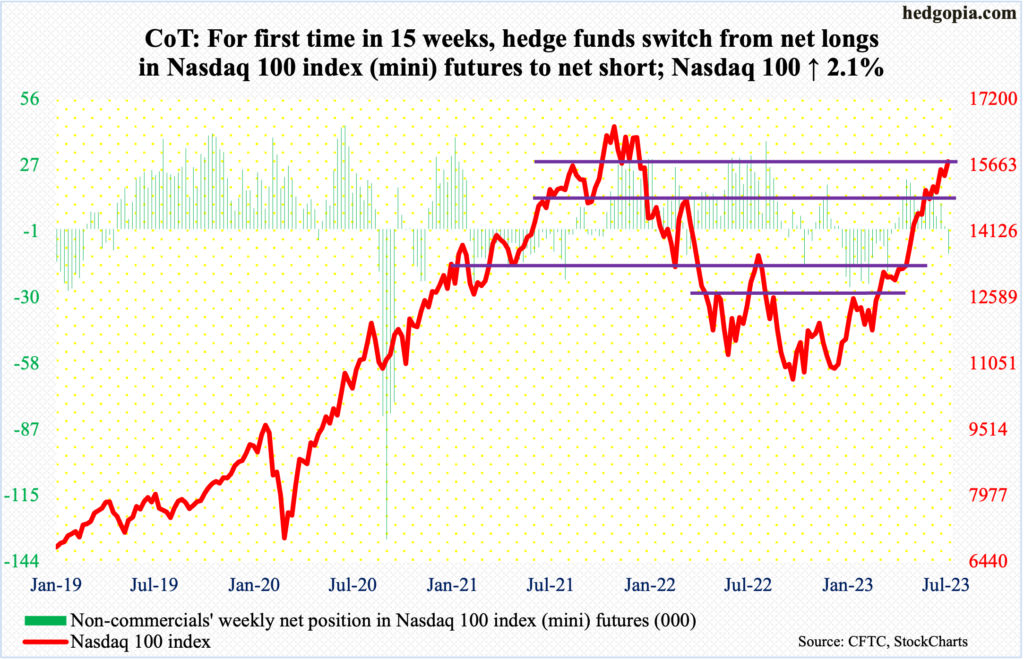
With a mixed post-earnings reaction this week to Microsoft (MSFT), Google parent Alphabet (GOOG) and Facebook parent Meta Platforms (META) – down, up and up respectively – two more crucial reports are due out next week. Both Apple (AAPL) and Amazon (AMZN) report on Thursday (more on this here).
It is worth pointing out that AAPL, which at $3.1 trillion in market cap is the largest stock out there, rallied to a new high ($198.23) in the week before but only to essentially give it all back to form a weekly gravestone doji; this week’s two-percent rise to $195.83 helped repair the damage somewhat. In the event of an adverse reaction on Thursday, AAPL’s make-or-break support lies at $180-$181.
AAPL obviously will influence which way the Nasdaq 100 goes, as the stock has a 11.6-percent weighting. The tech-heavy index itself had a tough week last week, reversing with a weekly shooting star; the potentially bearish development was not confirmed this week. Next week, therefore, is key.
Ahead of this, non-commercials switched to net short.
Immediately ahead, there is short-term support at 15280s. The index finished the week at 15751.
Russell 2000 mini-index: Currently net short 68.8k, up 3.1k.
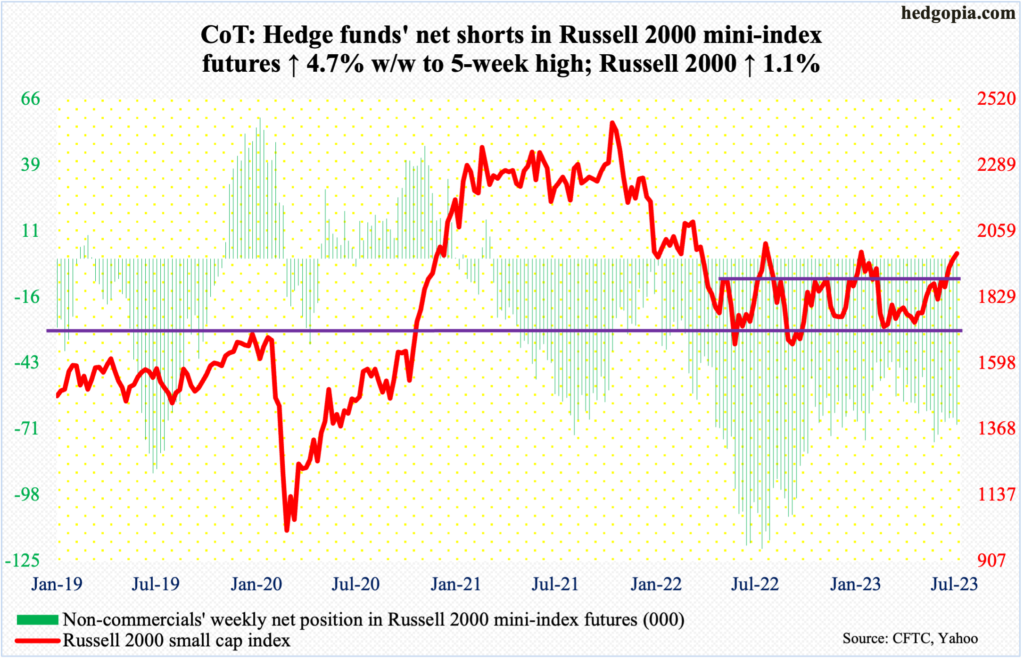
One more week and one more attempt at 2000, which needs to be taken out in order to surpass the high from February for a higher high. Small-cap bulls could only manage to rally to 1995 on Thursday, a session which reversed hard to end with a huge bearish engulfing candle.
For reference, the Russell 2000 peaked in November 2021 at 2459 before suffering a 33.2-percent tumble through June last year when it tagged 1641, which was later matched by 1642 in October. From the June low to August’s high of 2017, it quickly rallied 22.9 percent before momentum petered out. It later made a lower high of 2007 in February.
Hence the importance of the February high. Earlier, on the 11th (this month), the small cap index broke out of 1900, which is the top end of a 200-point range in place since January last year, with false breakouts in August and February.
Failure to reclaim 2000 raises the odds of a breakout retest at 1900.
US Dollar Index: Currently net long 6.1k, down 5k.
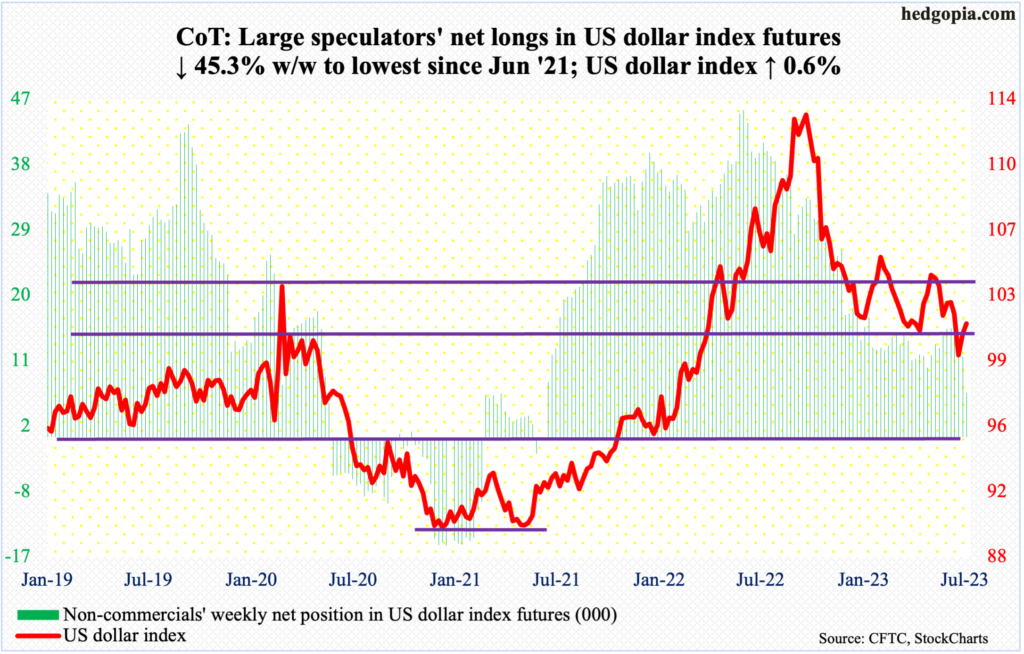
The US dollar index has a chance to rally – toward 103-104. Last week, it rose 1.2 percent to 100.80. Horizontal support at 100-101 goes back eight years. This week, the index (101.40) rallied another 0.6 percent to further pull away from 100-101, albeit barely.
On Friday, dollar bulls were unable to latch on to the session high 101.83. Once this gets taken out, there is not much resistance until the 50-day moving average at 102.31.
VIX: Currently net short 42.1k, up 1.9k.
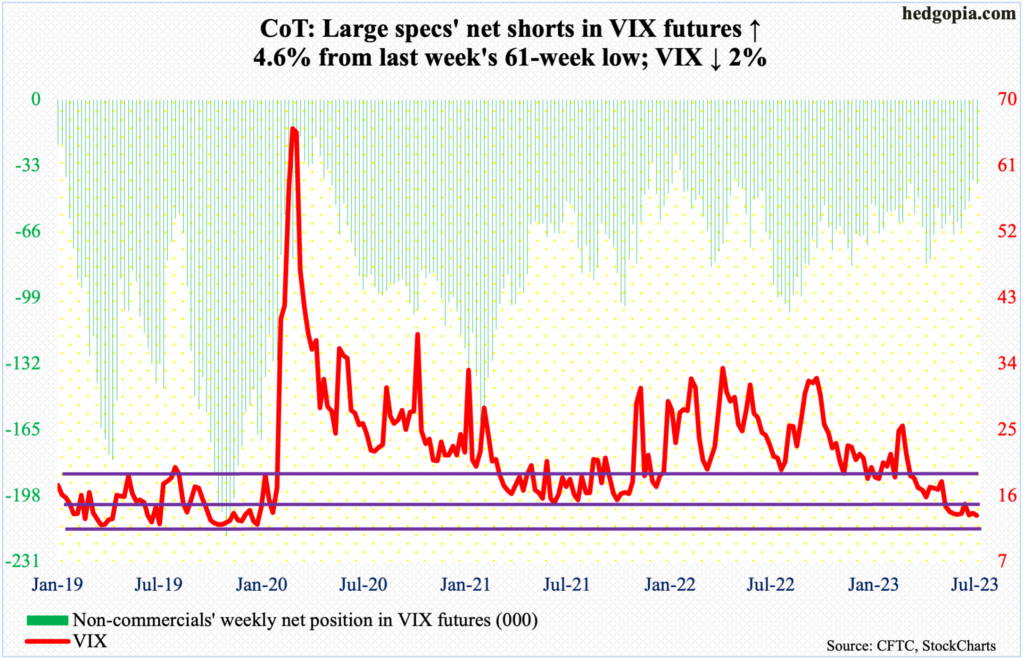
Once again, Thursday’s rally attempt past the 50-day was unsuccessful. VIX has not closed above the average since May 24th. Thursday was also a session the volatility index went sub-13 intraday, only to find support at the daily lower Bollinger band and rally hard to close at 14.41, with an intraday high of 15.02.
Volatility bulls had an opportunity to build some momentum this week, but the daily RSI retreated from just north of 50. They can take solace in the fact that VIX has refused to break 13 on a sustained basis, going sideways just above 13 the last six weeks.
Thanks for reading!
