
Following futures positions of non-commercials are as of September 19, 2023.
10-year note: Currently net short 702.3k, down 42k.
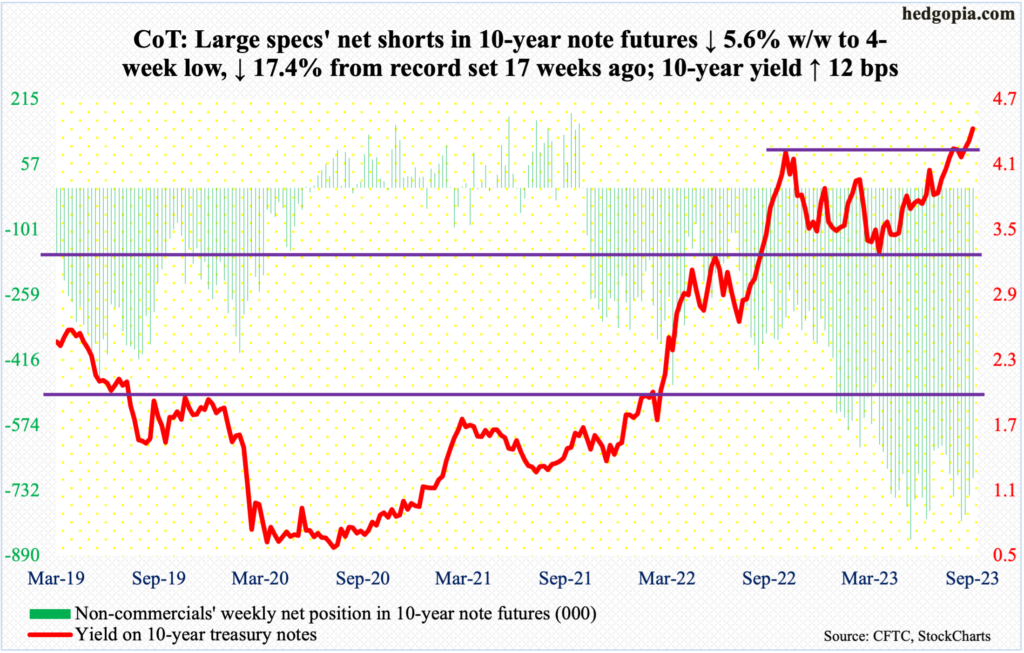
The 10-year treasury yield this week made what could turn out to be an important breakout. Or could it?
Last October, yields retreated after touching 4.33 percent; early August last year, these notes were yielding 2.53 percent, and 1.13 percent in August 2021. After the October high, the 10-year came under pressure to eventually bottom at 3.25 percent early April this year.
In last month’s second half, bond bears (on price) went after the October high at least three times – all unsuccessfully. Last week and early this week, there were again several attempts. The resistance held firm – until Thursday when the 10-year gapped up 13 basis points to close at 4.48 percent, with a high of 4.49 percent. The breakout came on the heels of Wednesday’s hawkish message from the Fed (more on this here).
If the breakout holds, this is a clear victory for bond bears. Speaking of which, non-commercials – ahead of Thursday’s breakout – cut net shorts in 10-year note futures by 5.6 percent, to a four-week low. From the record set in the week to May 30th, holdings are now down 17.4 percent – from 850,421 contracts to 702,316.
They cannot be blamed for locking in profit, as they are sitting on tons of it. But if this marks the beginning of a trend, there is no way this week’s breakout in the 10-year yield (4.44 percent) holds.
Immediately ahead, Thursday’s gap-up gets filled at the above-mentioned resistance, which obviously will amount to a retest of this week’s breakout.
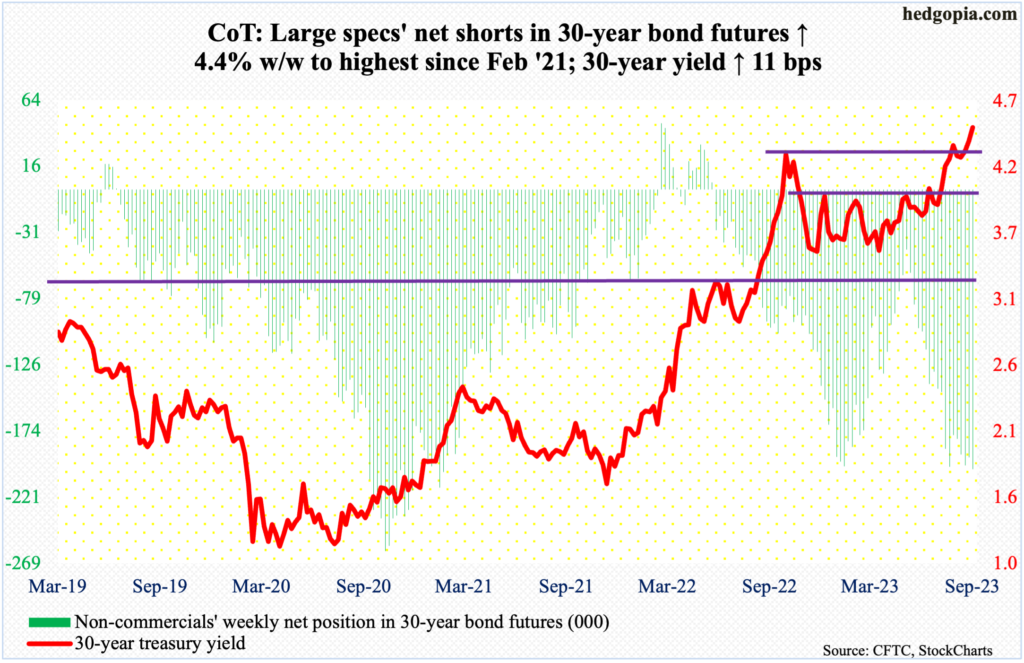
30-year bond: Currently net short 201.1k, up 8.4k.
Major US economic releases for next week are as follows.
The S&P Case-Shiller home price index (July) and new home sales (August) are due out Tuesday.
Nationally, US home prices inched lower 0.02 percent year-over-year in June. This was the fourth consecutive month of decline after remaining in the positive territory since May 2012.
Sales of new homes firmed up 4.4 percent month-over-month in July to a seasonally adjusted annual rate of 714,000 units – a 17-month high.
Durable goods orders (August) will be reported on Wednesday. July orders for non-defense capital goods ex-aircraft – proxy for corporations’ capex plans – edged up 0.05 percent m/m to $73.6 billion (SAAR). A record high $73.9 billion was set in May.
Thursday brings GDP (2Q23, 3rd estimate) and corporate profits (2Q23, revised).
The second estimate showed real GDP grew 2.1 percent (SAAR) in the June quarter. This is the fourth quarter in a row of economic expansion after two quarters of decline in 1Q and 2Q of last year.
In 2Q23, preliminarily, corporate profits with inventory valuation and capital consumption adjustments dropped 6.5 percent from a year ago to $2.8 trillion; 2Q22’s $3 trillion was a record.
Personal income/spending (August) and the University of Michigan’s consumer sentiment index (September, final) are scheduled for Friday.
In the 12 months to July, headline and core PCE (personal consumption expenditures) grew 3.3 percent and 4.2 percent, in that order. They respectively peaked last year at seven percent and 5.4 percent in June and February.
September’s preliminary estimate showed consumer sentiment dropped 1.8 points m/m to 67.7 – a three-month low.
WTI crude oil: Currently net long 358.7k, up 3.5k.
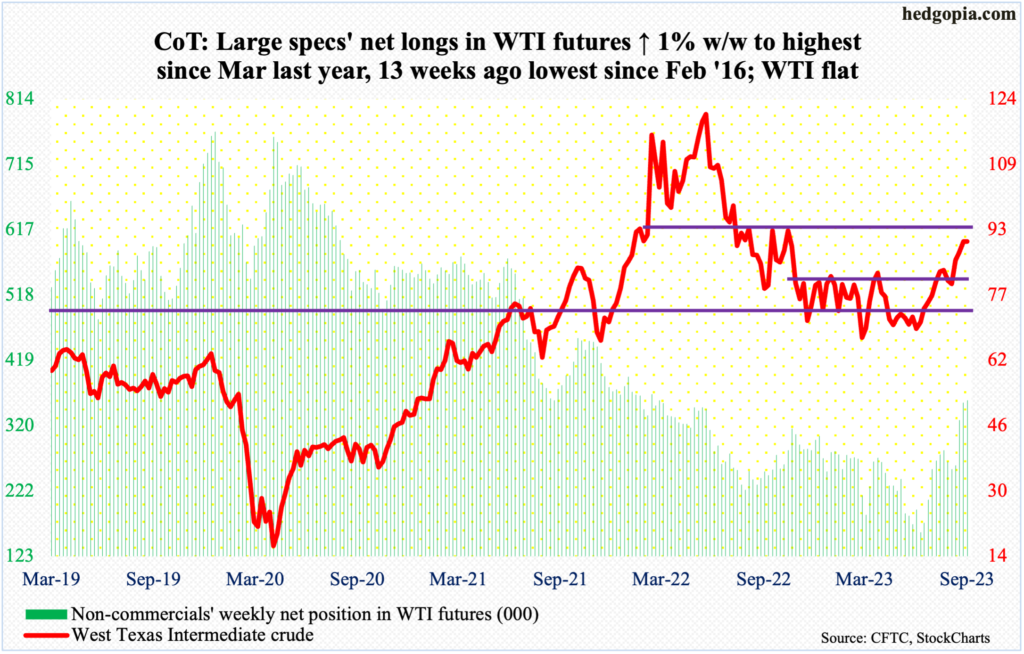
West Texas Intermediate crude’s rally could be stalling here.
From $67.05 in late June to Tuesday’s $92.43, it has come a long way. The latest push higher came on the back of announcement two weeks ago by Saudi Arabia and Russia of voluntary production cuts of one million barrels per day and 300,000 b/d respectively for another three months until the end of this year.
This week, oil bulls failed to hang onto Tuesday’s high, ending the week at $90.03/barrel, unchanged for the week. The weekly formed a spinning top. There is decent resistance at $93-$94. It likely holds for now.
Late August, WTI decisively broke out of a nine-month range between $71-$72 and $81-$82. Before a breakout retest occurs, there is short-term support at $88, which was successfully tested on Thursday.
In the meantime, as per the EIA, US crude production in the week to September 15 was unchanged week-over-week at 12.9 mb/d, which is the highest since the week to April 17, 2020. Crude imports decreased 1.1 mb/d to 6.5 mb/d. As did stocks of crude, gasoline, and distillates, which respectively dropped 2.1 million barrels, 831,000 barrels and 2.9 million barrels to 418.5 million barrels, 219.5 million barrels and 119.7 million barrels. Refinery utilization was down 1.8 percentage points to 91.9 percent.
E-mini S&P 500: Currently net short 139k, up 22.7k.
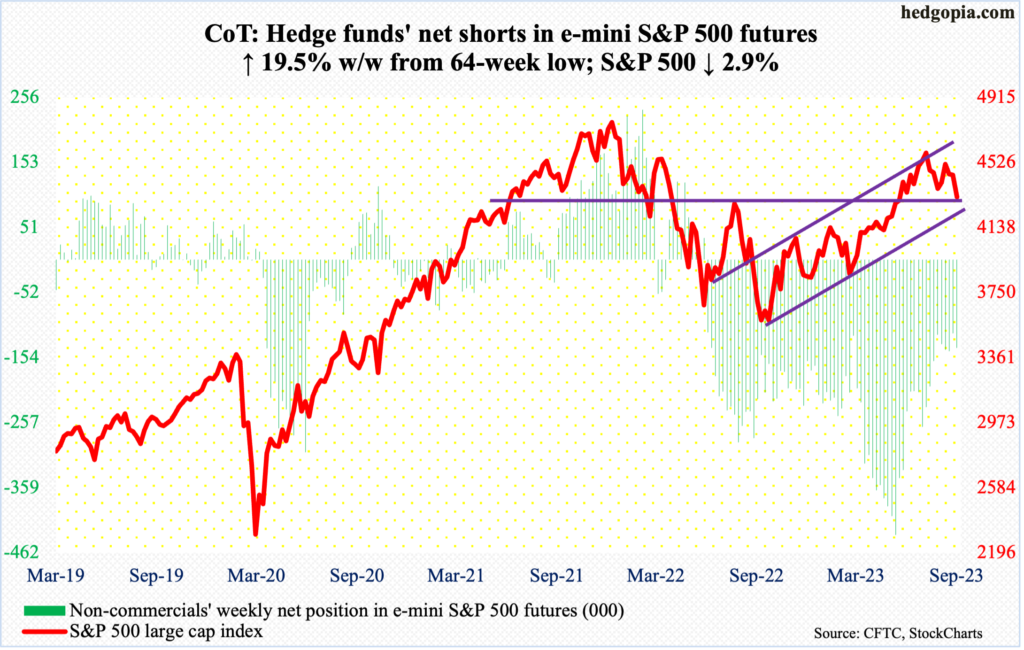
From the July 27th high of 4607 through Friday’s low of 4316, the S&P 500 gave back 6.3 percent. More pain probably lies ahead as the monthly chart is itching to move lower. Margin debt and share buybacks are beginning to turn into a headwind – relatively speaking (more on this here).
Near-term, a reflex rally can ensue should 4320s, which is where the large cap index (4320) ended the week, be defended. This level was reclaimed on June 12th and was successfully retested last month. It is being tested again.
The way the index has acted post-FOMC meeting, odds favor it is headed toward a test of the 200-day at 4191; the index has not closed below the average since March 17th. The 200-day also approximates channel support from last October when the S&P 500 bottomed.
Euro: Currently net long 102k, down 11.1k.
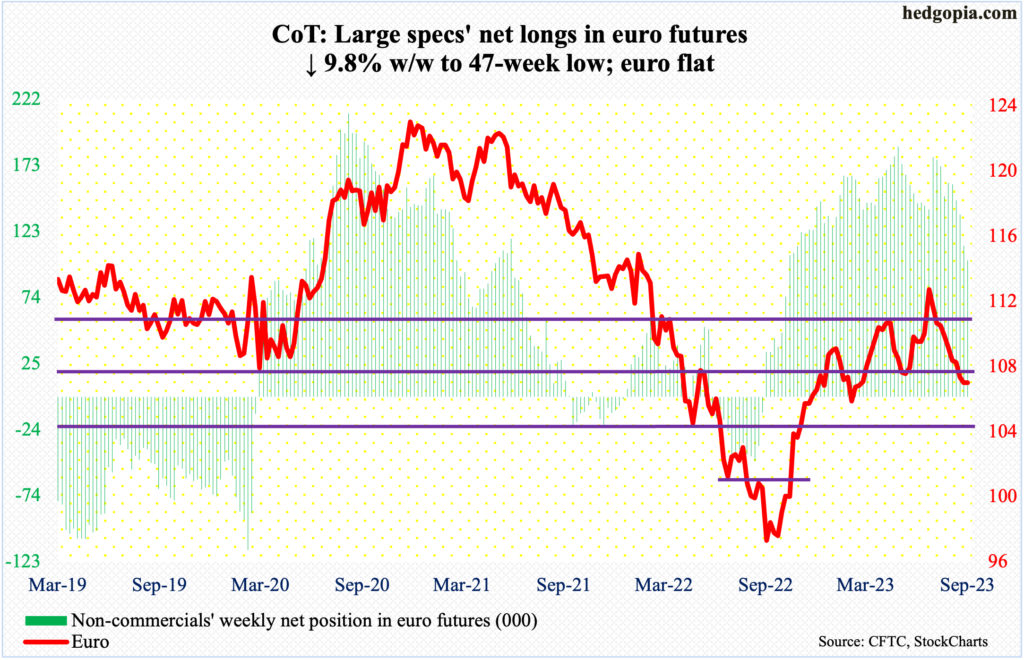
After nine consecutive weeks of decline, the euro essentially finished unchanged this week at $1.0662, for a weekly long-legged doji. The currency dropped from $1.1270 on July 18th to Thursday’s $1.0625. Before that, it bottomed at $0.9559 last September.
Euro bulls are trying to put their foot down at lateral support at $1.0650. Failure to hold this level exposes the currency to downside risks of $1.0530s at best and $1.03-$1.04 at worst.
Gold: Currently net long 135.2k, up 11.3k.
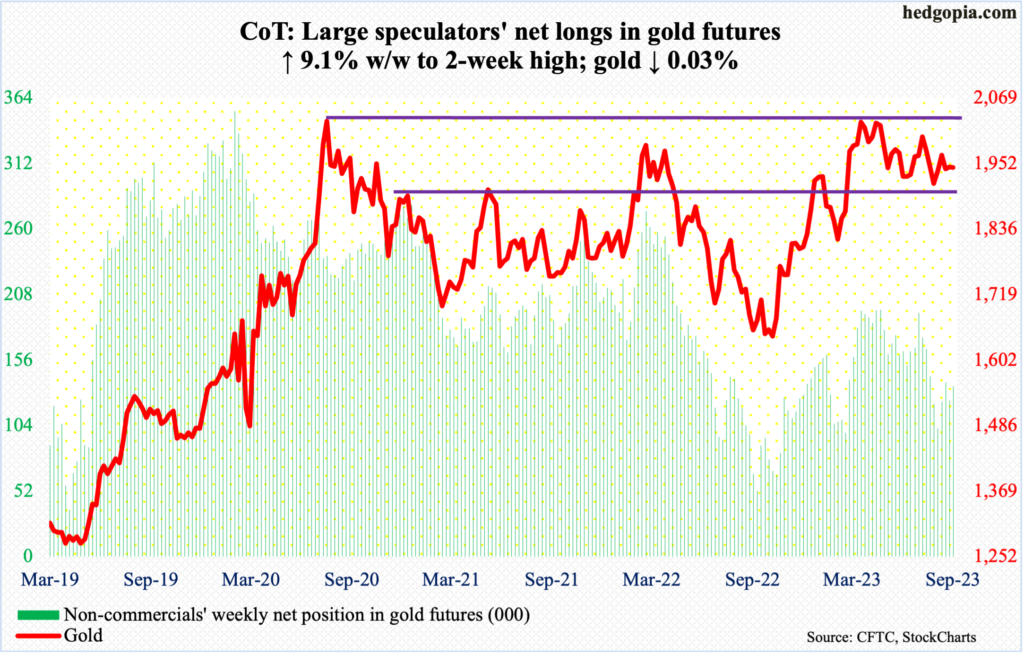
Gold bugs continued to defend the 200-day, with Thursday’s low of $1,933 kissing the average ($1,934). On Wednesday, the metal rallied as high as $1,969 – past the 50-day at $1,954 – but the average was lost in the very next session. It closed out the week at $1,946/ounce.
In essence, gold is stuck between these averages, with a downward bias toward must-save $1,920s.
Bulls had a tremendous opportunity in May this year to stage a major breakout, but gold headed lower as soon as $2,085 was ticked on the 4th. In the past, $2,089 was tagged in August 2020 – an all-time high – and $2,079 in March 2022. Concurrently, gold bears have been unable to convincingly reclaim $1,920s.
Nasdaq 100 index (mini): Currently net long 3.2k, down 5.9k.
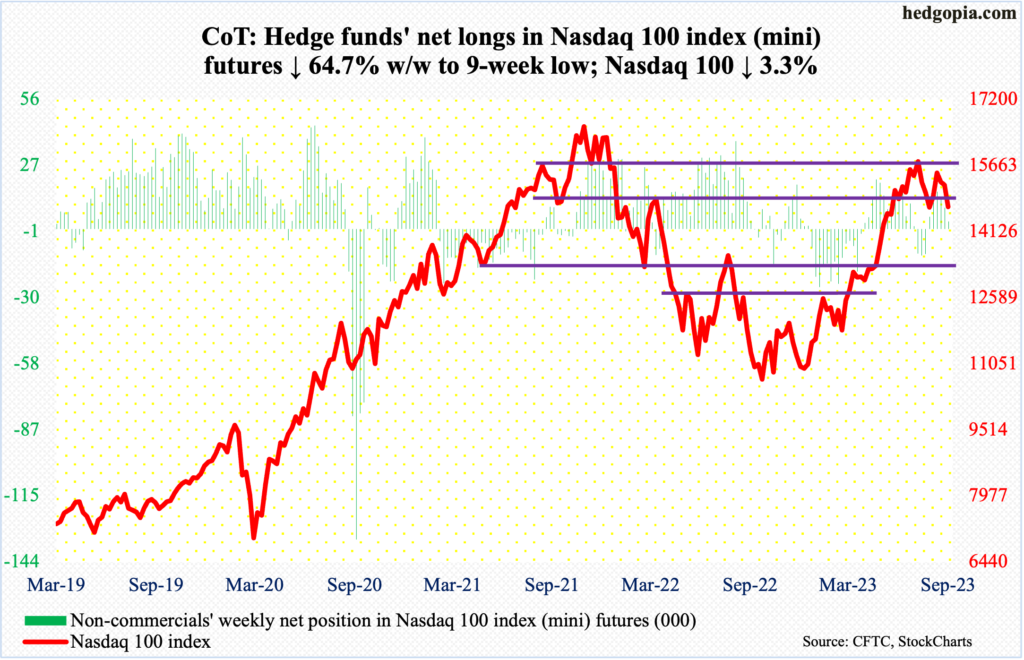
With five sessions left before September is over, the month so far has formed a bearish marubozu. That said, down 5.2 percent for the month, the Nasdaq 100 is yet to undercut August’s low of 14558. This week, the tech-heavy index fell to 14687 intraday Friday, closing the session/week at 14701.
Mid- to long-term, the bias remains down. Near-term, last month’s low is the one to watch. If it remains intact, Thursday’s gap-down gets filled at 14960s, followed by the 50-day at 15282.
Russell 2000 mini-index: Currently net short 63.6k, down 54.
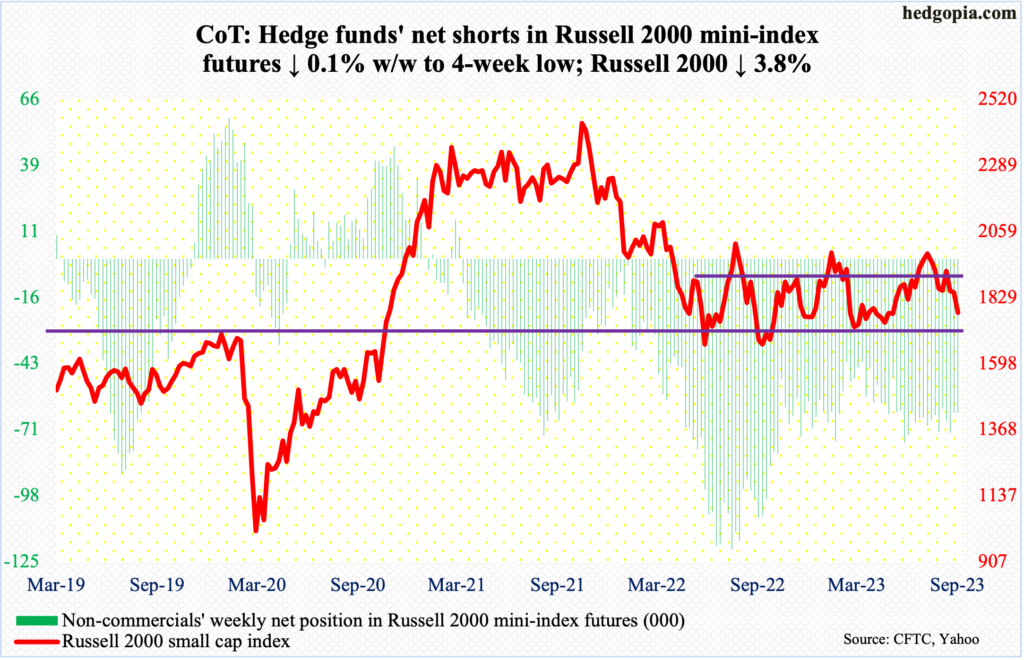
The Russell 2000 continues to act sick.
Caught in a range between 1700 and 1900 since January last year, the small cap index broke out on July 11th. It then went on to rally to 2004, which was hit on July 31st, but came up short of eclipsing the February (2023) high of 2007. The downward pressure from that high found support at 1830s twice last month – on the 18th and 25th – and on the 13th this month. This week, it gave way, closing down 3.8 percent to 1777.
Rather ominously, the midpoint of the above-mentioned range – 1800 – also coincided with the neckline of a head-and-shoulders pattern, with the head made up of the July 31st high and the shoulders forming mid-June and early this month. If the pattern completes, small-cap bears will be eyeing 1600. That is a long way from here. For reference, last June and October, the Russell 2000 troughed at 1641 and 1642, in that order. Before that happens, there is trendline support from last October’s low at 1740s, followed by the range support at 1700.
US Dollar Index: Currently net long 15.6k, up 9.6k.

Non-commercials showed some aggression this week, bringing net longs in US dollar index futures to a 36-week high. Earlier, in the week to August 8th, they had reduced their holdings to the lowest since June 2021.
The US dollar index bottomed at 99.22 on July 18th, having peaked last September at 114.75. This week, it rose 0.3 percent to 105.26.
Support at 103-104 goes back to at least December 2016. The level was reclaimed early this month; post-breakout, it has been retested this week and last – both successfully. So long as this holds, non-commercials have odds in their favor.
Near-term, dollar bulls need to defend 105; else, the daily can begin to unwind its overbought condition.
VIX: Currently net short 28.8k, down 10.5k.
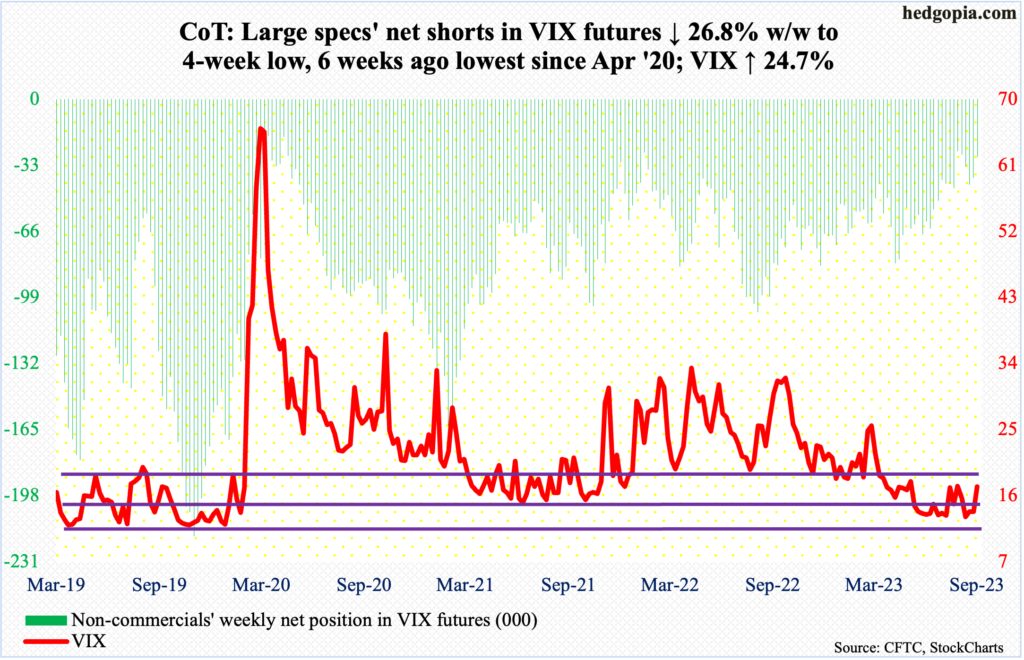
Volatility perked up this week. VIX added 3.41 points to 17.20. Thursday’s intraday high of 17.54 was made just under the 200-day (17.80). The volatility index has not closed above the average since March 17th.
Mid- to long-term, VIX is headed a lot higher. Near-term, as things stand, even if the 200-day gets taken out, last month’s high of 18.88 is likely to come in the way.
Thanks for reading!
