
Following futures positions of non-commercials are as of September 26, 2023.
10-year note: Currently net short 732k, up 29.7k.
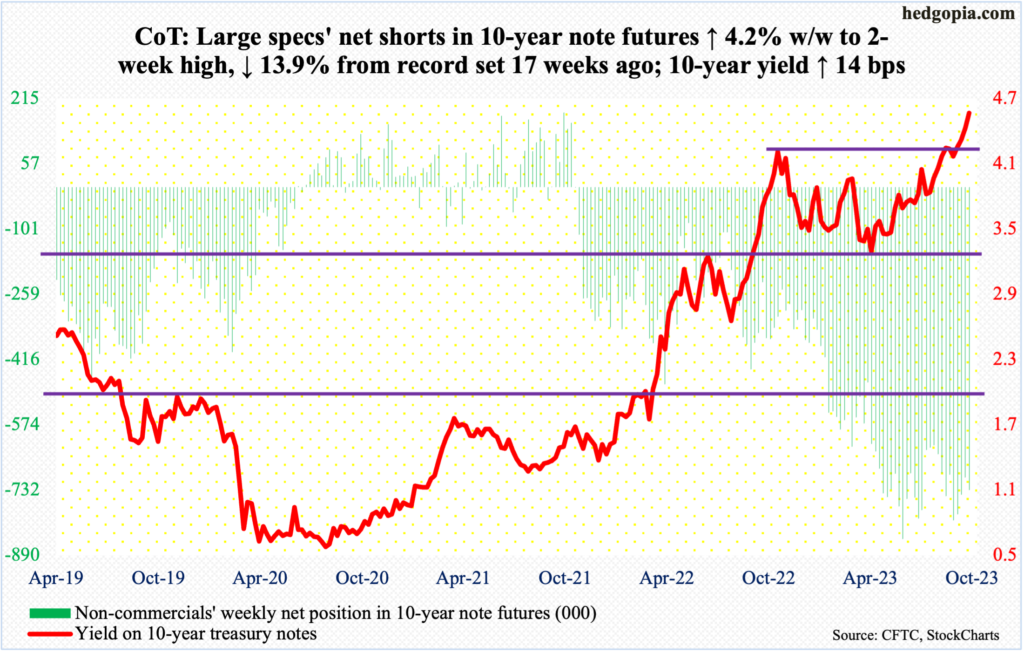
The 10-year treasury yield continued higher, up 14 basis points from last week to 4.57 percent. On Thuresday, rates rose as high as 4.69 percent, which was the highest print since October 2007. Back then, the 10-year was on its way down from June’s high of 5.32 percent.
This week, bond bears (on price) were unable to hang on to all of the weekly gains, resulting in a weekly shooting star.
Yields have come a long way. Early August last year, these notes were yielding 2.53 percent, and 1.13 percent in August 2021.
Last October, yields came under pressure after reaching 4.33 percent, subsequently bottoming at 3.25 percent early April this year. In the second half of this August, bond bears (on price) went after the October high at least three times – all unsuccessfully. In September, there were again several attempts. The resistance held firm – until the 21st when the 10-year gapped up 13 basis points to close at 4.48 percent, with a high of 4.49 percent; the breakout came on the heels of a hawkish message from the Fed post-conclusion of FOMC meeting that Wednesday.
Such levels of import naturally come with stop orders. Once stops get taken out, it can become a self-fulfilling prophecy. In just seven sessions, the 10-year went from a low of 4.31 percent to a high of 4.69 percent.
If this was a genuine breakout, the next time mid-4.30s get tested, bond bears, such as non-commercials, should be willing to add to positions. Else, the latest move higher post-breakout will simply qualify as having resulted from stop orders getting taken out.
A retest looks imminent.
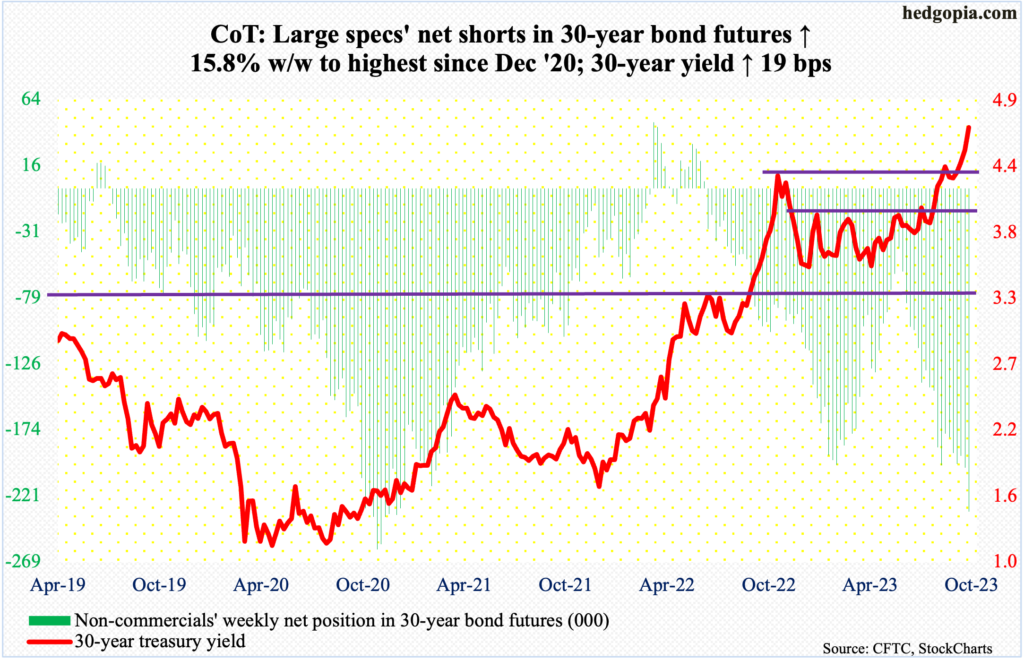
30-year bond: Currently net short 232.8k, up 31.7k.
Major US economic releases for next week are as follows.
The ISM manufacturing index (September) will be reported on Monday. Manufacturing activity increased 1.3 percentage points month-over-month in August to 47.6 percent. This was the 10th month in a row of sub-50 activity.
JOLTs job openings (August) are due out Tuesday. July openings were down 338,000 m/m to 8.8 million – a 28-month low. A record 12 million was posted in March last year.
Durable goods orders (August, revised) and the ISM services index (September) are scheduled for Wednesday.
Orders for non-defense capital goods ex-aircraft – proxy for corporations’ capex plans – firmed up 0.9 percent m/m in August to a seasonally adjusted annual rate of $73.9 billion, which was a new high.
August non-manufacturing activity rose 1.8 percentage points m/m to 54.5 percent. Barring a brief sub-50 activity last December (49.2 percent), services activity has consistently been above 50 percent.
Friday brings payroll (September). In the first eight months this year, the economy produced an average 236,000 non-farm jobs, with June through August producing sub-200,000. In 2022 and 2021, the monthly average was 399,000 and 606,000 respectively.
WTI crude oil: Currently net long 388.2k, up 29.5k.
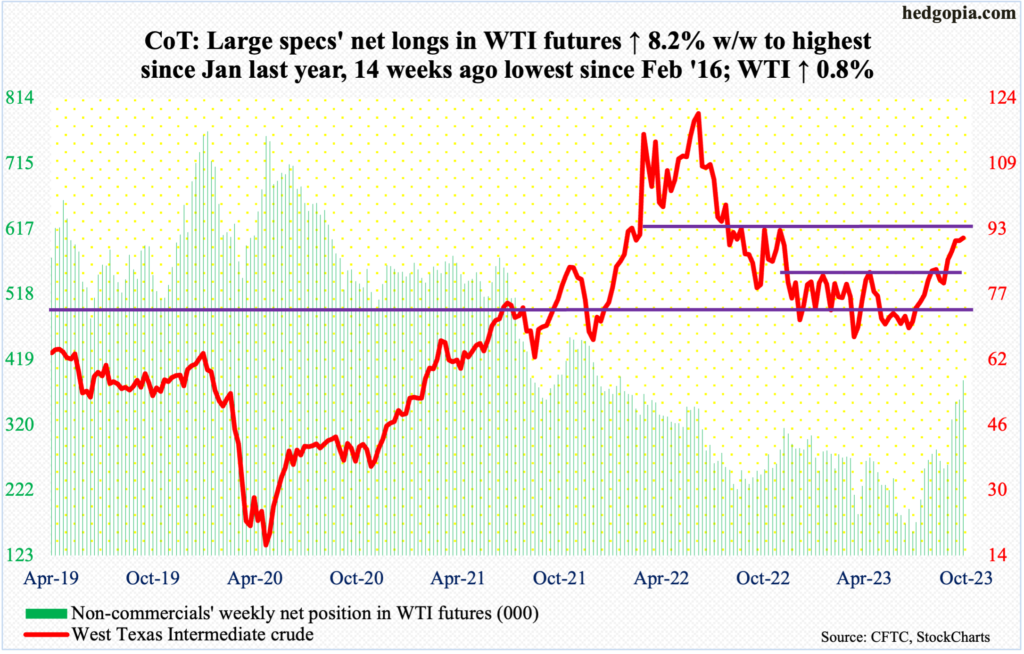
West Texas Intermediate crude is beginning to give out signs of fatigue. This week, it rallied 0.8 percent to $90.79/barrel, but was up as much as 5.6 percent at Thursday’s intraday high of $95.03. There is decent resistance at $93-$94.
Oil bulls’ inability to hang on to the gains resulted in a weekly long-legged doji, coming on the heels of last week’s spinning top.
In late June, the crude tagged $67.05, so has rallied a lot.
Late August, WTI decisively broke out of a nine-month range between $71-$72 and $81-$82. Before a breakout retest occurs, there is short-term support at $88, which was successfully tested on Tuesday, and three sessions before that.
In the meantime, as per the EIA, US crude production in the week to September 22 was unchanged for the third week in a row at 12.9 million barrels per day, which is the highest since the week to April 17th, 2020. Crude imports increased 712,000 b/d week-over-week to 7.2 mb/d. As did stocks of gasoline and distillates, which respectively grew one million barrels and 398,000 barrels to 220.5 million barrels and 120.1 million barrels. Crude inventory, however, dropped 2.2 million barrels to 416.3 million barrels. Refinery utilization was down 2.4 percentage points to 89.5 percent.
E-mini S&P 500: Currently net short 89.3k, down 49.7k.
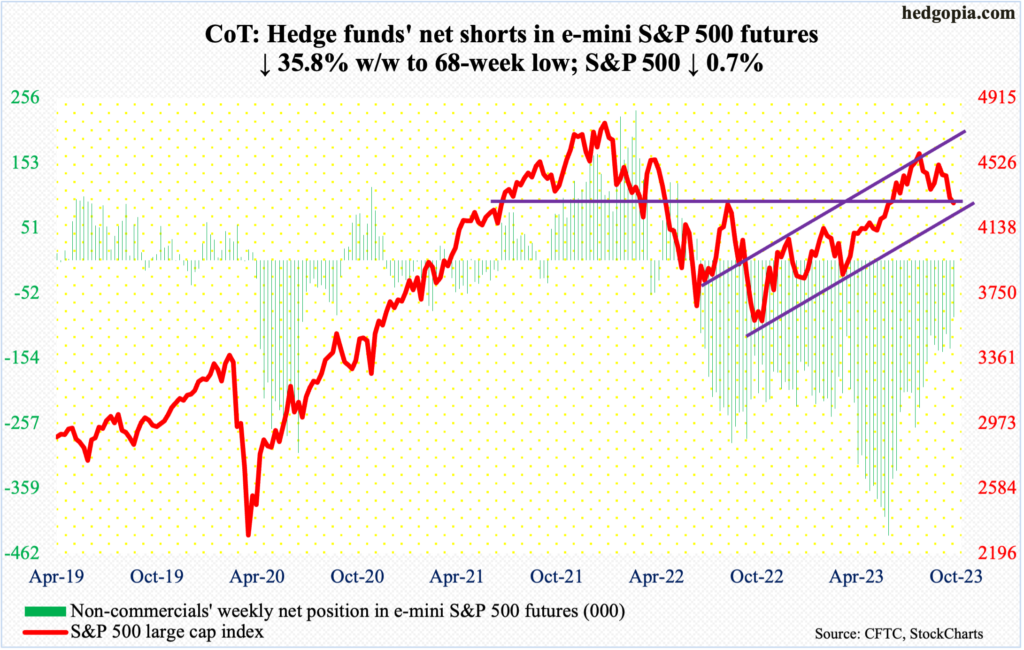
Equity bulls have an opportunity to put their foot down.
The S&P 500 declined 0.7 percent this week, for four down weeks in a row, but with signs that odds for a reflex rally have grown. By Tuesday’s low of 4239, the large cap index was down 1.9 percent for the week. That low was bought, with the 200-day at 4199; the index has not closed below the average since March 17th. Tuesday’s low also lined up with channel support from late July when the S&P 500 retreated at 4607. From that high through Tuesday’s low, it gave back eight percent.
The index (4288) ended the week below 4320s, which is now resistance. Both Thursday and Friday, sellers showed up there, or just above. This is the hurdle for now. Immediately ahead, the September 21st gap gets filled at 4400, with channel resistance at 4450s, which is where the 50-day (4453) lies as well.
Euro: Currently net long 98.4k, down 3.6k.
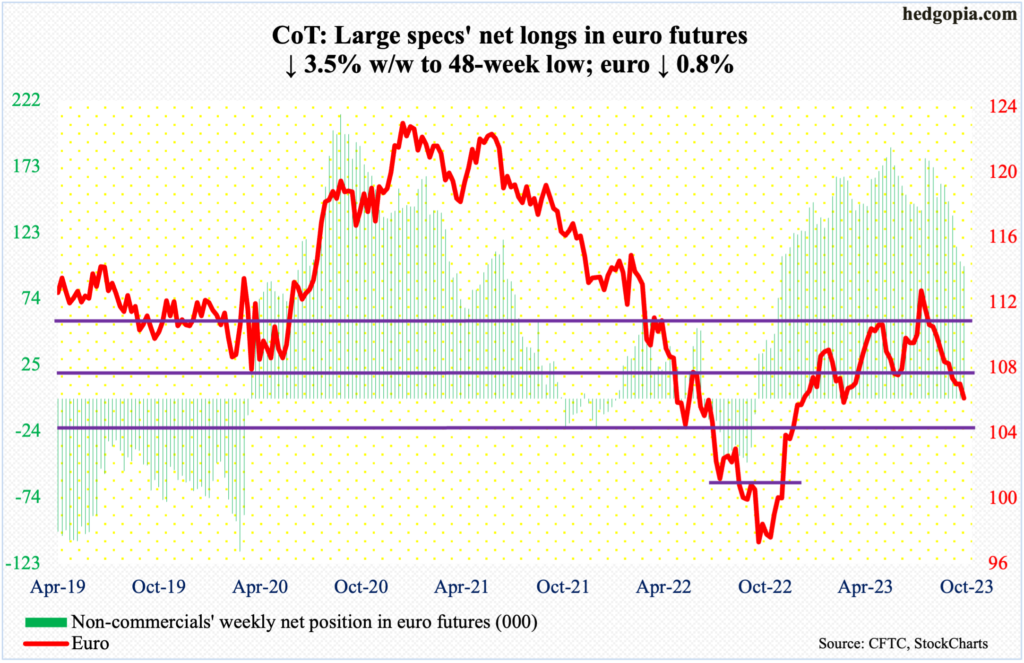
After nine consecutive down weeks, the euro was essentially unchanged last week, forming a weekly doji. This week, the downward trend continued, down 0.8 percent to $1.0574 and through support at $1.0630s.
Both the daily and weekly remain grossly oversold, with the daily RSI having dipped to mid-20s mid-week. Wednesday’s low of $1.0488 was bought. Euro bulls’ test now obviously lies at $1.0630s, a takeout of which will open the door toward the 50- and 200-day, which at $1.0831 and $1.0823 respectively are on the verge of a death cross.
Gold: Currently net long 115.8k, down 19.3k.
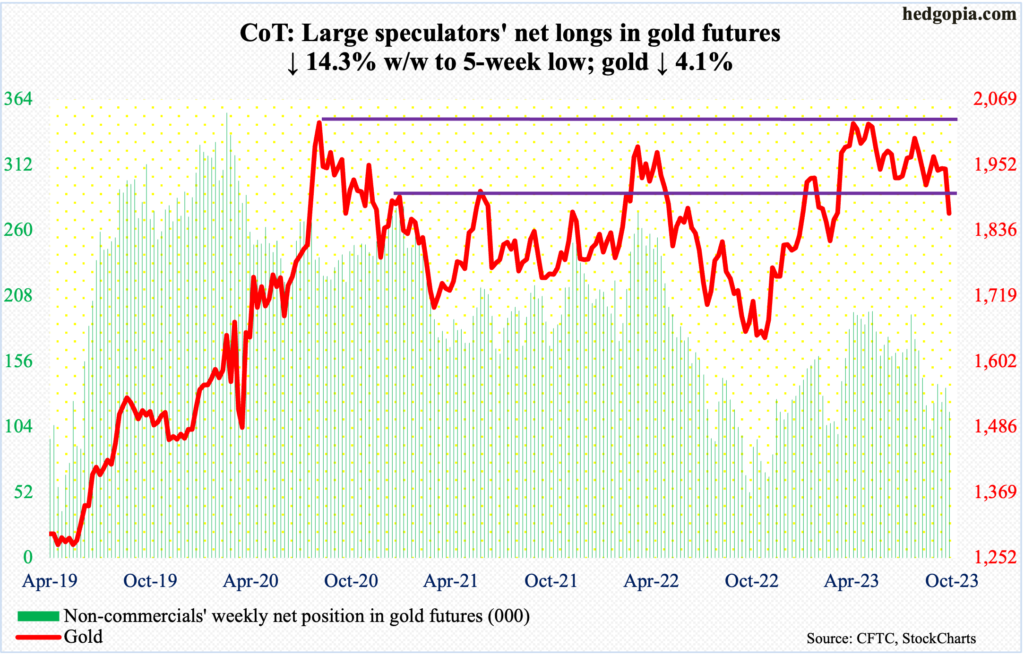
Gold broke down. After holding the line at $1,920s for three months, the metal dropped in all five sessions this week to slice through that support, ending the week down 4.1 percent to $1,866/ounce. It is now under both the 50- and 200-day (respectively at $1,947 and $1,936).
Earlier in May this year, gold headed lower as soon as $2,085 was ticked on the 4th. In the past, $2,089 was tagged in August 2020 – an all-time high – and $2,079 in March 2022. This was an important failure, and this week’s breakdown is a testament to that.
Now that the bears have succeeded in pushing the yellow metal under $1,920s, they are probably eyeing $1,840s, which for gold bugs is a must-hold.
Nasdaq 100 index (mini): Currently net long 846, down 2.3k.
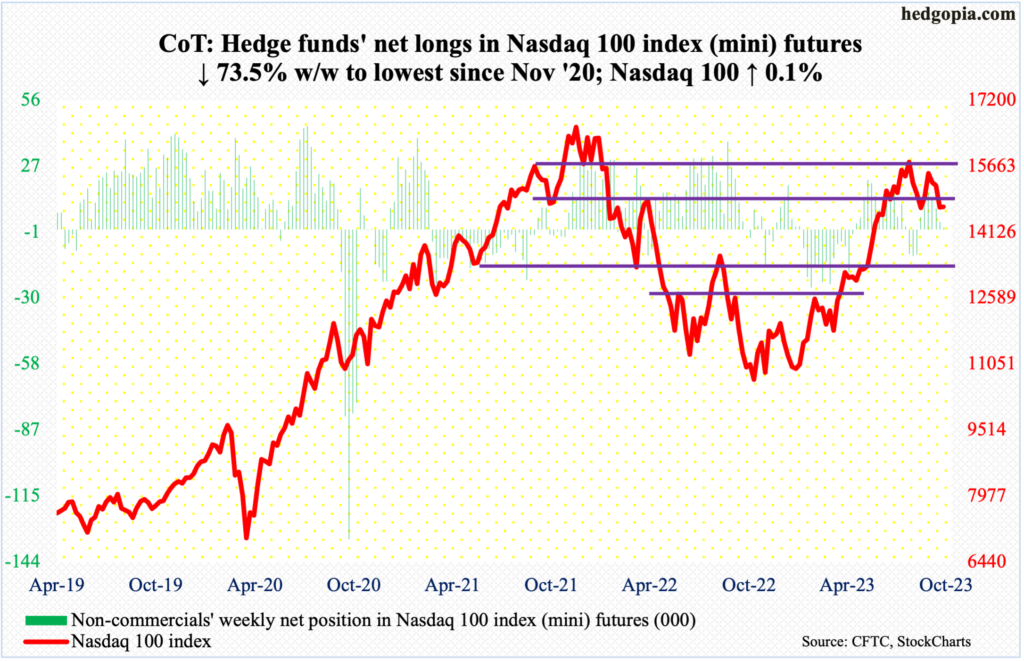
At Friday’s high, the Nasdaq 100 was up 1.4 percent for the week, and at Wednesday’s low was down 1.8 percent. When it was all said and done, it edged up 0.1 percent for the week to 14715, forming a weekly spinning top, which showed up after three down weeks in succession.
The tech-heavy index has trended lower since tagging 15932 on July 19th. Trendline resistance from that high lies at 15300s. Before that, a gap-down from September 21st gets filled at 14960s, with the 50-day at 15180.
Russell 2000 mini-index: Currently net short 61.6k, down 2k.
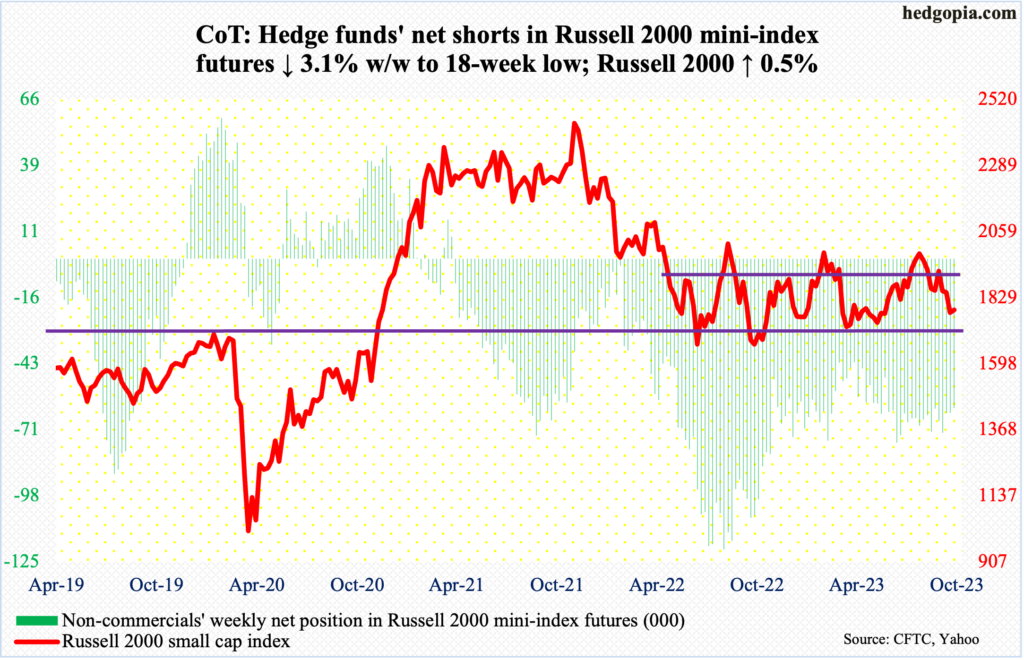
Small-cap bulls should be happy with how the week turned out. Down 0.8 percent at Tuesday’s low (1762), it ended up 0.5 percent to 1785. Bids showed up Tuesday at a rising trendline from last October’s low.
All this followed last week’s breakdown in which the Russell 2000 breached the neckline of a head-and-shoulders pattern at 1800, with the head made up of the July 31st high (2004) and the shoulders forming mid-June and early this month; 1800 is also where the midpoint of a range between 1700 and 1900 the small cap index has been in since January last year sits.
If the head-and-shoulders pattern completes, small-cap bears will be eyeing 1600. This may have to wait for now. Once 1800 is retaken, it becomes easier to rally back toward the top of the above-mentioned range.
US Dollar Index: Currently net long 16.8k, up 1.1k.
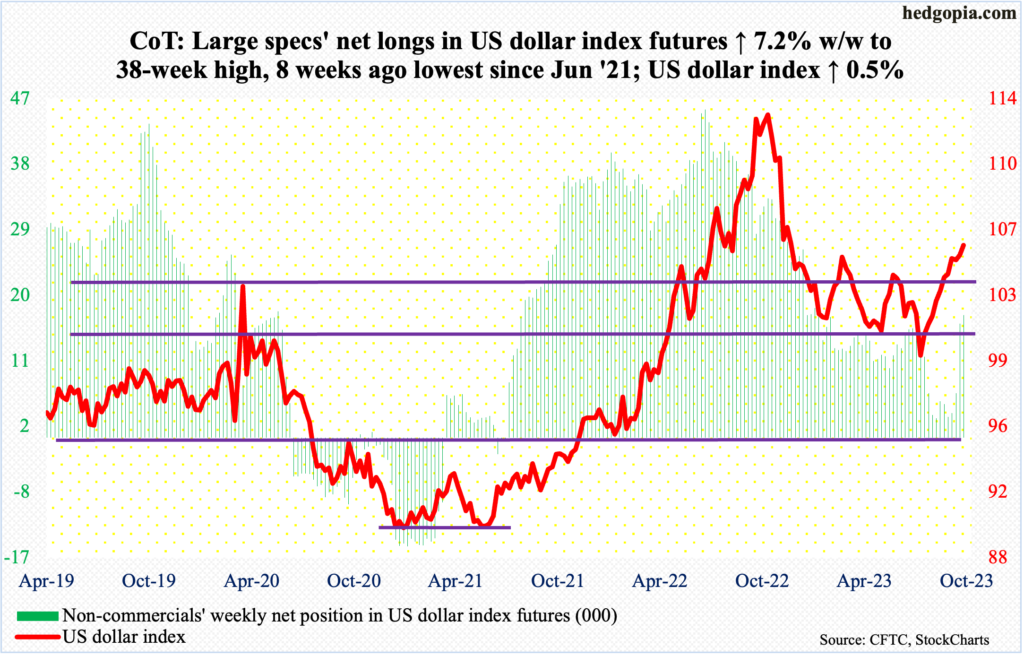
Non-commercials took their holdings of net longs in US dollar index futures to a 38-week high. Earlier, in the week to August 8th, they had reduced their holdings to the lowest since June 2021.
The US dollar index bottomed at 99.22 on July 18th, having peaked last September at 114.75. This week, it rose 0.5 percent to 105.82. Having said that, dollar bulls failed to hang on to Thursday’s high of 106.47.
The mini-reversal will have legs should dollar bears succeed in reclaiming 105.10s.
VIX: Currently net short 52.8k, up 24k.
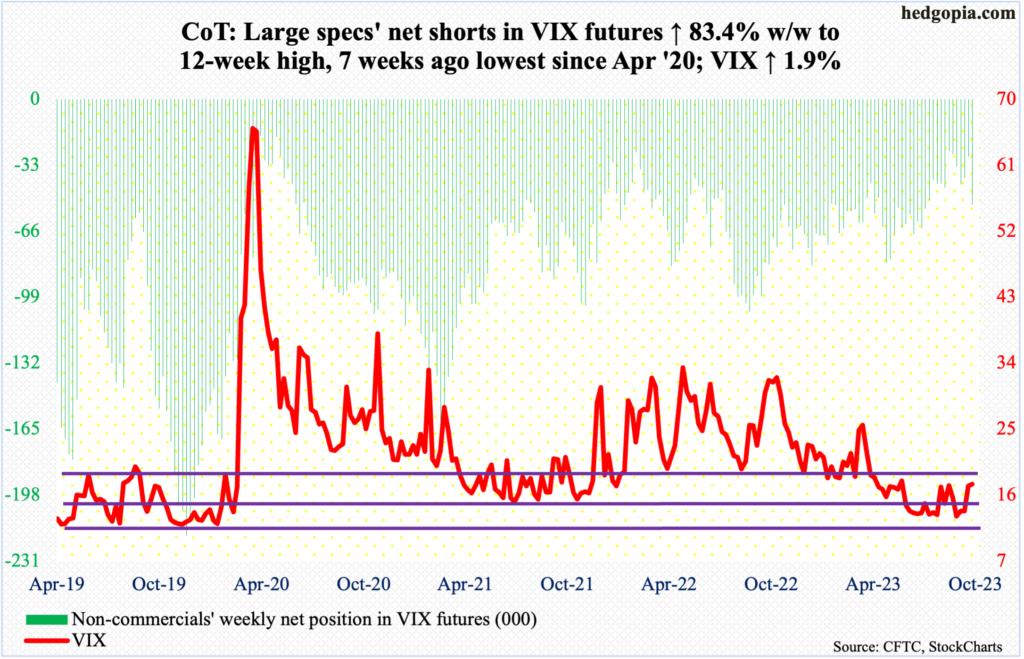
It was a topsy-turvy week for volatility in which VIX rallied 1.9 percent to 17.52, with a high of 19.71 on Wednesday and a low of 15.83 on Friday. The volatility index closed above the 200-day (17.67) on Tuesday and Wednesday but only to close underneath by Friday.
The week finished with a weekly spinning top, with decent odds that Wednesday’s reversal will in due course prove to be a spike reversal, in which case VIX will head lower near term.
Thanks for reading!
