
Following futures positions of non-commercials are as of October 17, 2023.
10-year note: Currently net short 710.7k, down 2.2k.
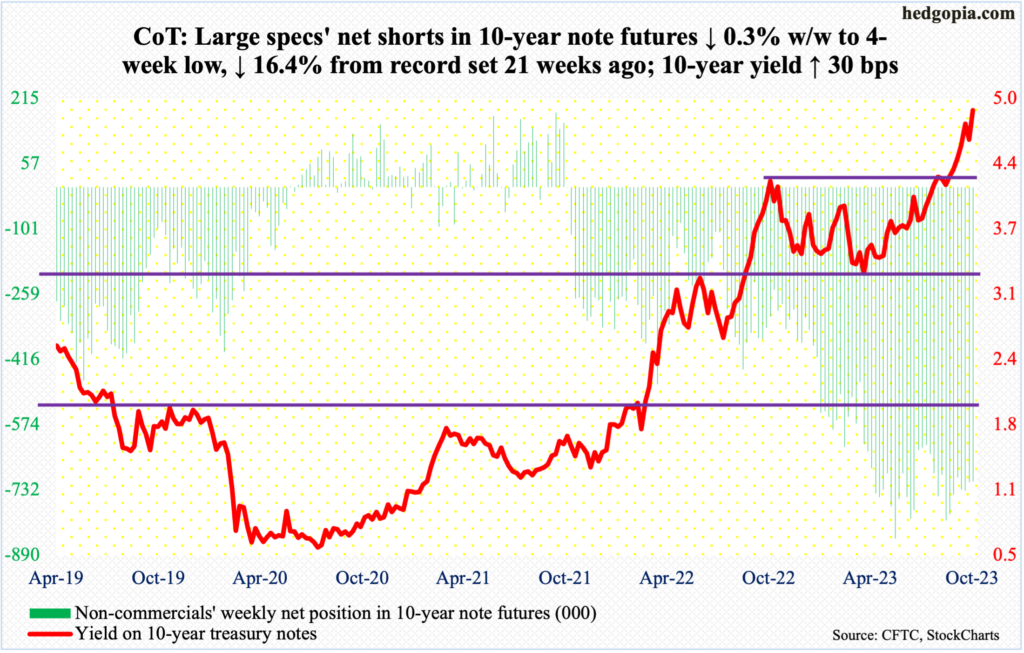
Yet another week and yet another intraday high! Thursday, the 10-year treasury yield reached the highest since July 2007 – a monthly high of 5.2 percent back then and five percent (4.996 percent, to be specific) this week.
For whatever it is worth, yields peaked at 5.32 percent in June back then, before coming under sustained pressure to eventually bottom at 0.40 percent in March 2020. In 2007, the 10-year peaked just before the worst crisis in decades consumed the global financial system.
Yields have come a long way. Early August last year, these notes were yielding 2.53 percent, and 1.13 percent in August 2021.
The latest rally in the 10-year began on September 21st when bond bears (on price) reclaimed 4.30s. Last October, yields came under pressure after reaching 4.33 percent, subsequently bottoming at 3.25 percent early April. In the second half of August (this year), the bears (on price) went after the October high at least three times – all unsuccessfully. Since last month’s breakout, the rally has taken a life of its own, taking out stops and all that.
How close are we to a breaking point? It is tough to say. But if past is prelude, such persistent rallies in yields will exact a price – sooner or later.
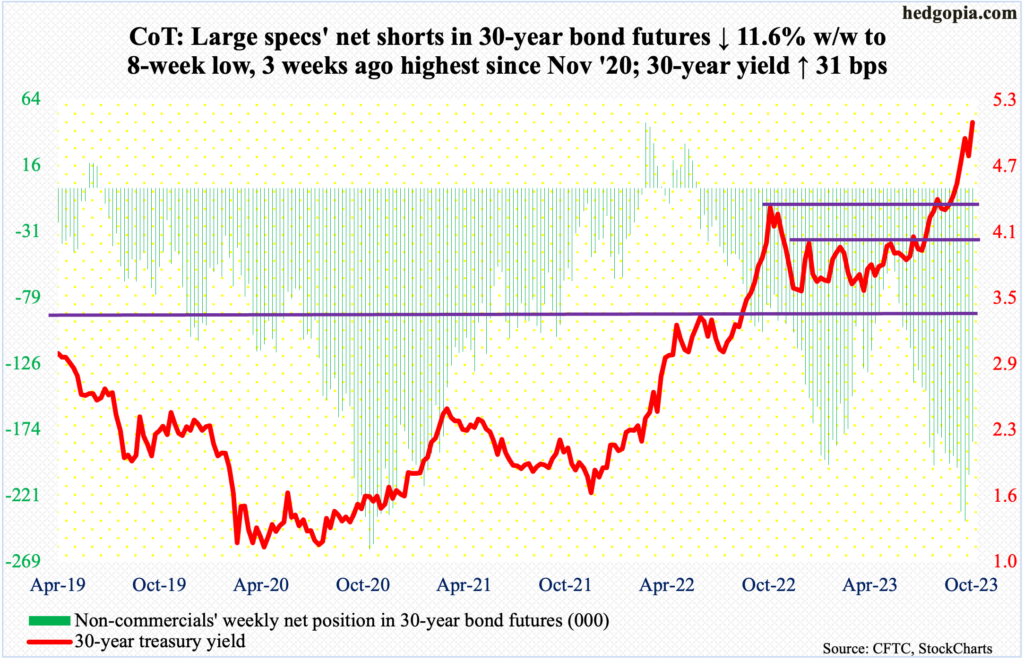
30-year bond: Currently net short 182.5k, down 24k.
Major US economic releases for next week are as follows.
New home sales (September) are due out Wednesday. August sales were down 8.7 percent month-over-month to a seasonally adjusted annual rate of 675,000 units – a five-month low.
Thursday, durable goods orders (September) and GDP (3Q23, 1st print) are on dock.
Orders for non-defense capital goods ex-aircraft – proxy for business capex plans – increased 0.4 percent year-over-year to $73.9 billion (SAAR). This set a new record.
In 2Q23, real GDP increased at an annual rate of 2.1 percent. This was the fourth consecutive quarterly expansion after two quarters of back-to-back contraction in the first half last year.
Friday brings personal income/spending (September) and the University of Michigan’s consumer sentiment index (October, final).
In the 12 months to August, headline and core PCE (personal consumption expenditures) grew 3.5 percent and 3.9 percent, in that order. They peaked last year at 7.1 percent and 5.6 percent in June and February respectively.
October’s preliminary reading showed consumer sentiment decreased 5.1 points m/m to 63, which was a seven-month low.
WTI crude oil: Currently net long 301.1k, down 58.1k.
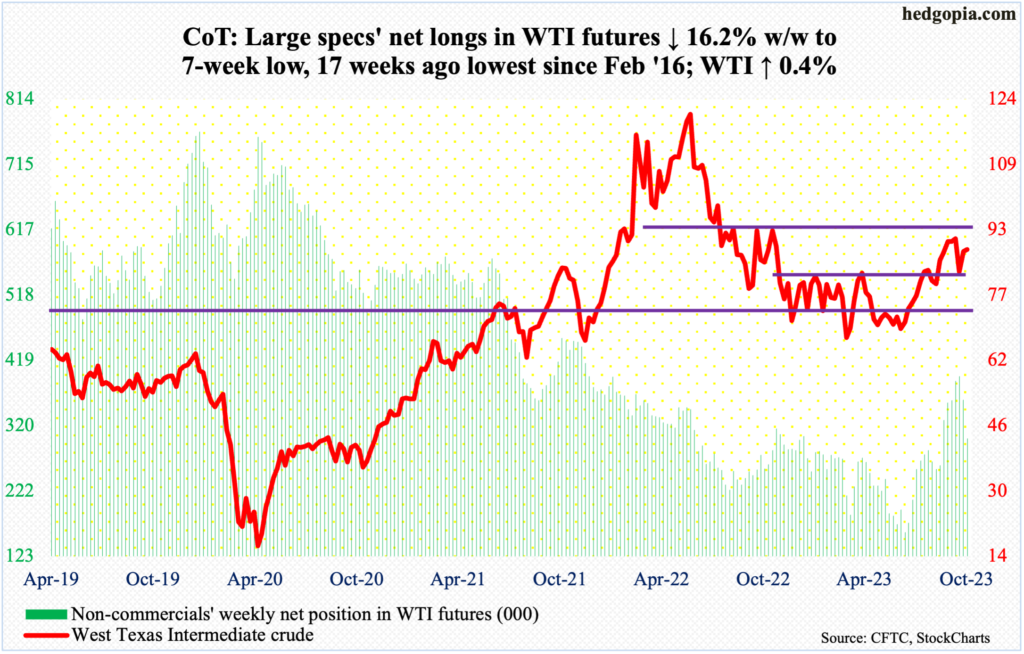
West Texas Intermediate crude had a wide range this week, with a high of $89.85 on Friday and a low of $84.39 on Tuesday, closing at $88.08 – right on short-term horizontal support. In the end, the weekly produced a spinning top, which comes after last week’s potentially hanging man.
It increasingly feels like the crude made an important high of $95.03 on September 28th, which came in a spinning top week; in fact, the week before that was a spinning top as well. It bottomed at $67.05 in late June, thus has come a long way. There is decent resistance at $93-$94.
In late August, WTI broke out of a 10-month range between $71-$72 and $81-$82. The breakout was successfully tested on the 6th. Odds favor another retest ahead.
In the meantime, as per the EIA, US crude production in the week to October 13th was unchanged week-over-week at 13.2 million barrels per day, which is a record; this preceded four weeks of sideways move at 12.9 mb/d. Crude imports decreased 387,000 b/d to 5.9 mb/d. As did stocks of crude, gasoline, and distillates, which respectively declined 4.5 million barrels, 2.4 million barrels and 3.2 million barrels to 419.7 million barrels, 223.3 million barrels and 113.8 million barrels. Refinery utilization was up four-tenths of a percentage point to 86.1 percent.
E-mini S&P 500: Currently net short 63.2k, down 31.3k.
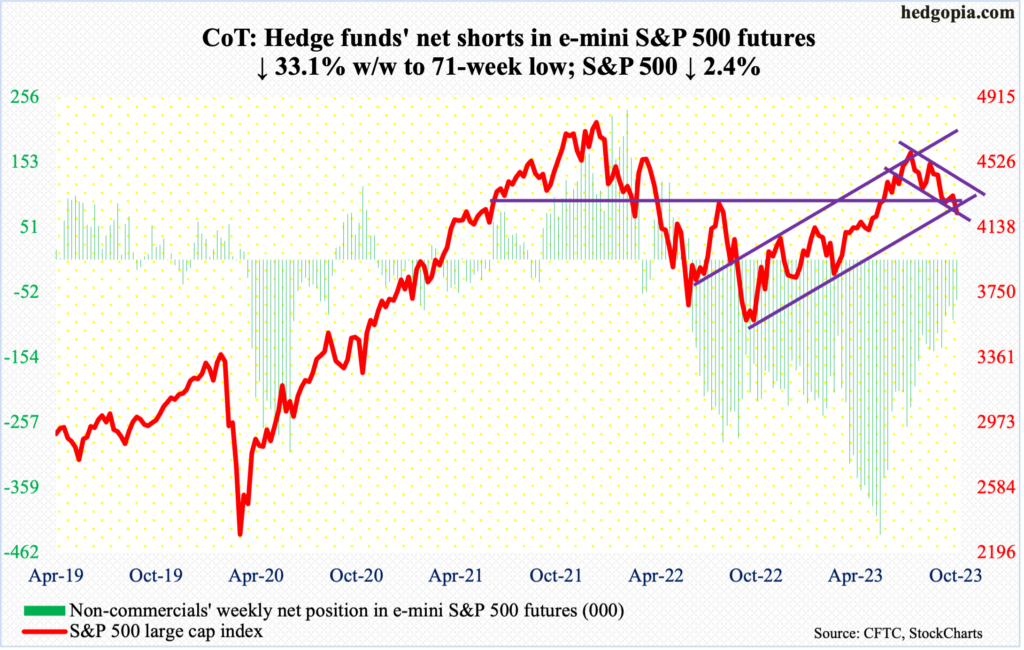
On the 6th, from an intraday low of 4220, the S&P 500 lifted off just above the 200-day. The subsequent rally stopped this Tuesday as the large cap index tagged 4394 and retreated. A gap from September 21st would have gotten filled at 4400. The rejection came just under the 50-day. The index (4224) has gone back and forth between the two averages since mid-September. On Friday, the 200-day (4233) was breached – albeit slightly.
With this, lateral support at 4320s has been decidedly breached, although the index currently sits on dual channel support – one rising from last October when the S&P 500 bottomed at 3492 and one falling from this July when it peaked at 4607.
If the bears prevail – they likely will at least near term – they would love to test bulls’ mettle at 4160s (more on this here).
Euro: Currently net long 82.4k, up 6.9k.
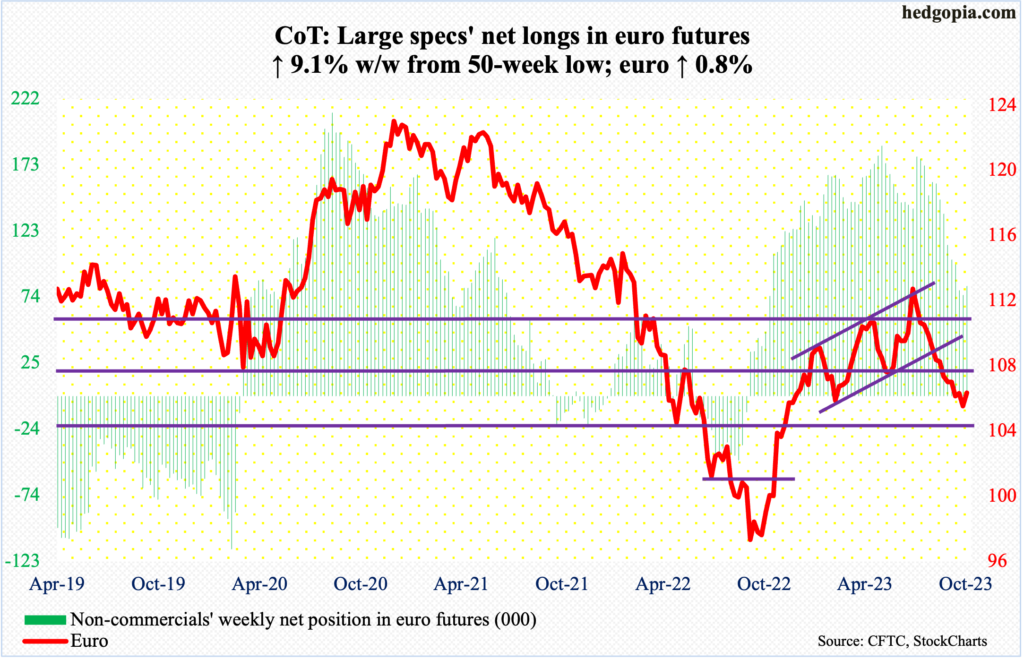
The euro is trying to bottom – duration and magnitude notwithstanding.
This week, it rose 0.8 percent to $1.0594. This followed a shooting star last week and a couple of weekly hammers and a long-legged doji before that.
The currency dropped from an intraday high of $1.1270 on July 18th to a low of $1.0448 on the 3rd this month. Lateral support at $1.04-$1.05 goes back to at least March 2015. This support is unlikely to yield right here and now.
For over a year now, $1.0630s has been a point of interest for both bulls and bears; the level was lost on September 25th. Reclaiming of this price level will have swung the odds in bulls’ favor.
Gold: Currently net long 112.7k, up 41.3k.
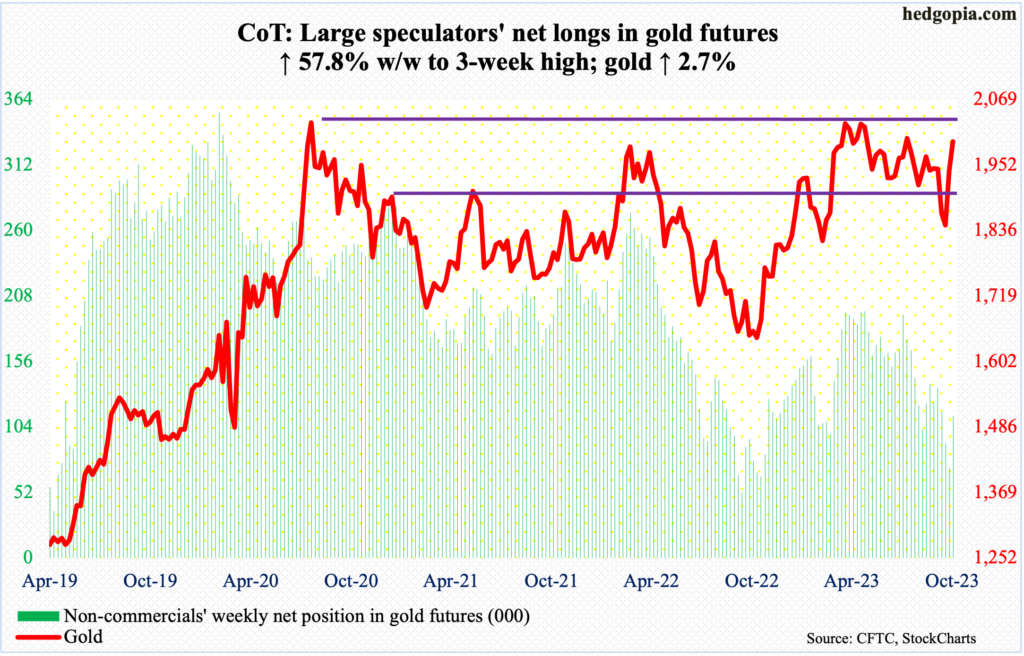
After reaching a 49-week low last week, non-commercials’ net longs in gold futures rose by a decent amount this week. The metal has rallied strongly since ticking $1,824 on the 6th this month. On Friday, gold tagged $2,009, closing the session/week at $1,994/ounce.
On the back of geopolitical tensions in the Middle East, gold witnessed a couple of strong weeks – up 2.7 percent this week and 5.2 percent last week. With this, the yellow metal has broken out of a falling trendline from May 4th when it touched $2,085, before turning back lower. This is an important level, as this was the third time since August 2020 – the other being March last year – gold has failed at $2,080s. Gold bugs have another opportunity to go and hammer on this.
Nasdaq 100 index (mini): Currently net long 14.3k, up 6.5k.
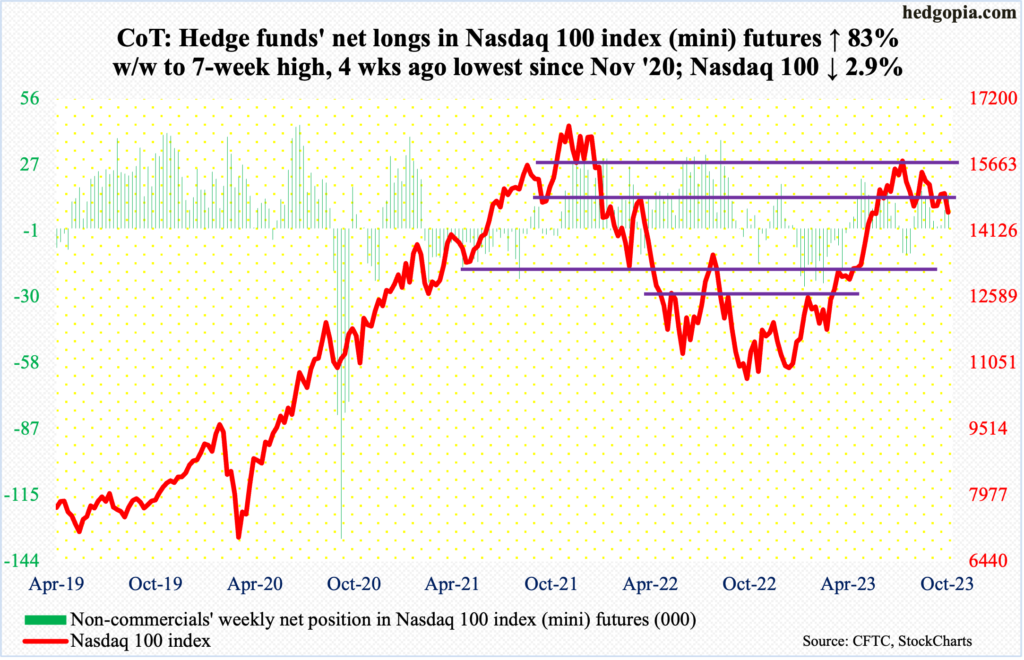
In November 2021, the Nasdaq 100 peaked at 16765, before coming under pressure the following 11 months and then bottom last October at 10441. From that low, the tech-heavy index rallied to 15932, which was posted July 19th. It has since headed lower along a falling trendline. This week, Monday’s high of 15210 just about tested this resistance – unsuccessfully. In each of the next four sessions, the Nasdaq 100 made lower highs, finishing the week at 14561, losing 2.9 percent – the first down week in four.
It ended the week right on short-term lateral support. The September 27th low of 14433 is worth watching. The 200-day is at 13844.
Russell 2000 mini-index: Currently net short 45.5k, down 21.2k.
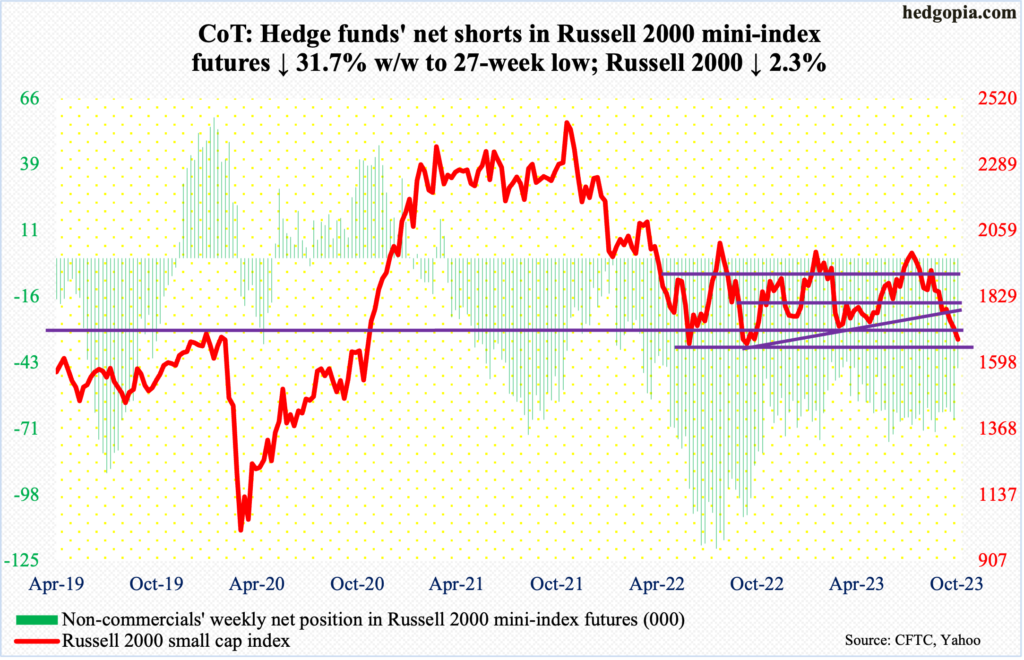
For the second week in a row, the Russell 2000’s rally fell just shy of 1800. Tuesday, it tagged 1780 intraday and that was it. By Friday, it closed at 1681.
The small cap index four weeks ago breached the neckline of a head-and-shoulders pattern at 1800, which also constitutes the midpoint of a range between 1700 and 1900 intact since January last year.
If the head-and-shoulders pattern completes, downside risk lies at 1600. Now that 1700 is gone, small-cap bears need to reclaim 1640s – the lows of June and October last year – before 1600 comes into sight.
US Dollar Index: Currently net long 19.2k, down 310.
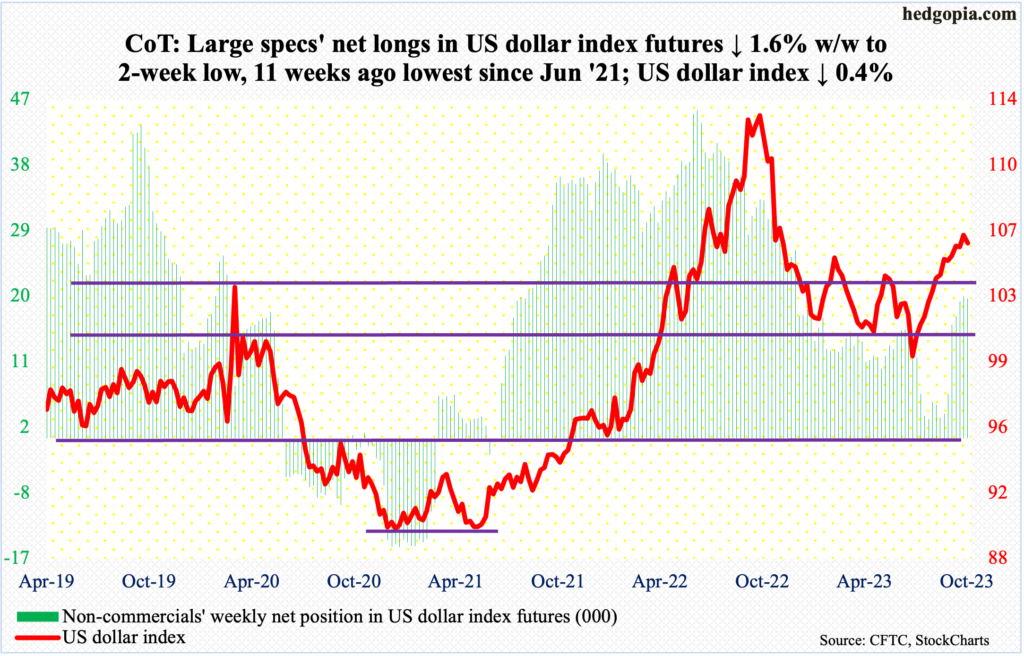
The US dollar index shed 0.4 percent this week to 105.99. This was preceded by last week’s what looks more like a hanging man (bearish) than a hammer (bullish). This was preceded by a weekly shooting star.
The index has lost momentum after dollar bulls were unable to hang on to the October 3rd high of 107.05. Earlier, the index bottomed at 99.22 on July 18th, having peaked last September at 114.75.
Once short-term horizontal support at 105.10s – followed by the 50-day at 104.93 – gets comprised, bears are likely to get active.
VIX: Currently net short 22.9k, up 8.3k.
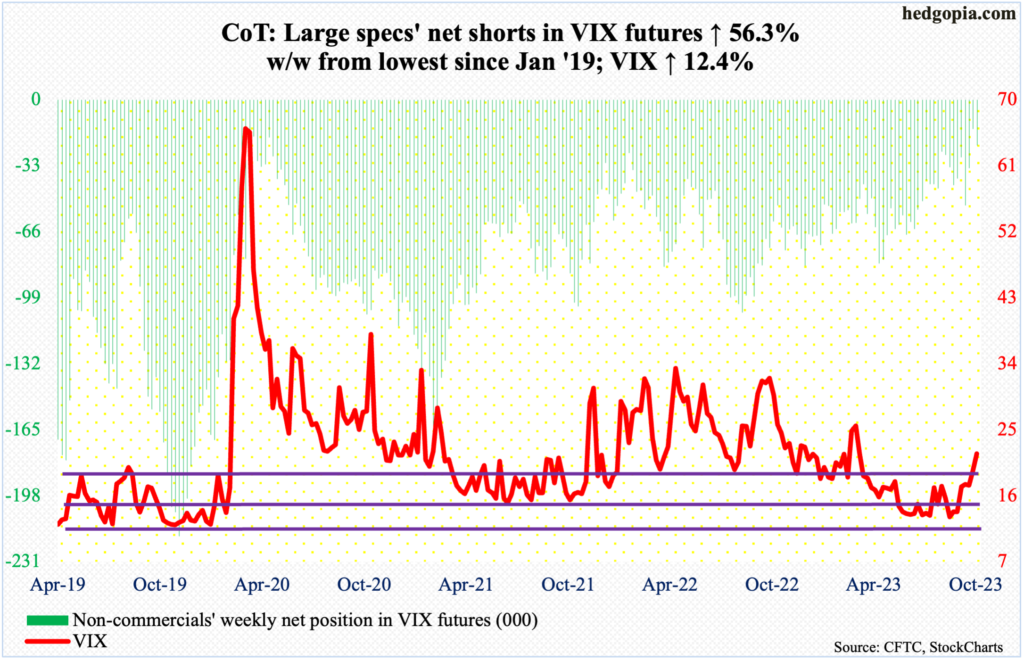
VIX will soon get extended on the daily, but it is yet to give out signs of fatigue. In fact, the volatility index reached the highest since March this year; Friday’s close of 21.71 was near the session high 21.83.
The path of least resistance is up – until VIX flashes a spike-reversal warning.
Thanks for reading!
