
Following futures positions of non-commercials are as of November 14, 2023.
10-year note: Currently net short 661.8k, up 57.3k.
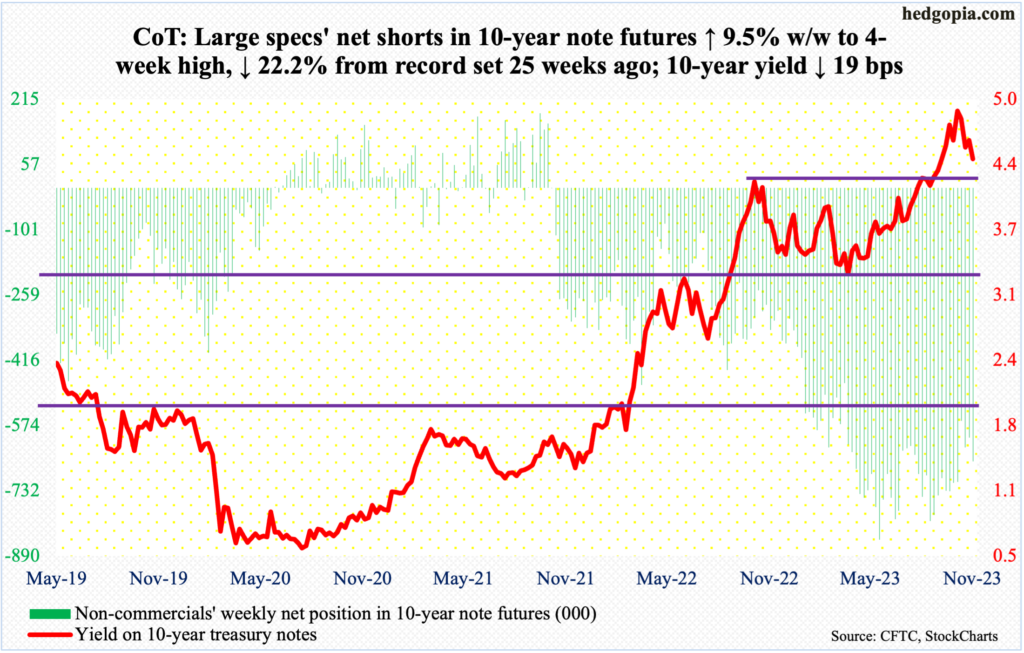
After six months of uninterrupted rally, the 10-year treasury yield is on pace to a down month. So far this month, it is down 43 basis points to 4.44 percent. Earlier, yields began to rally after touching 3.25 percent in April.
The 10-year peaked at five percent. For three consecutive sessions last month, it tried to unsuccessfully take out that level, with the high of 4.997 percent recorded on the 23rd. This was the highest print since July 2007; rates peaked at 5.32 percent in June back then, before coming under sustained pressure to eventually bottom at 0.40 percent in March 2020. In 2007, the 10-year peaked just before the onset of the global financial crisis.
Last Friday, the 10-year touched 4.40 percent intraday. This may – or not – amount to a breakout retest of 4.30s. Yields broke out of that level on September 21st. For now, it is unlikely this level gets breached, as the daily seems to be itching to rally. In due course, though, the 10-year has a lot lower to go.
Early August last year, these notes were yielding 2.53 percent, and 1.13 percent in August 2021.
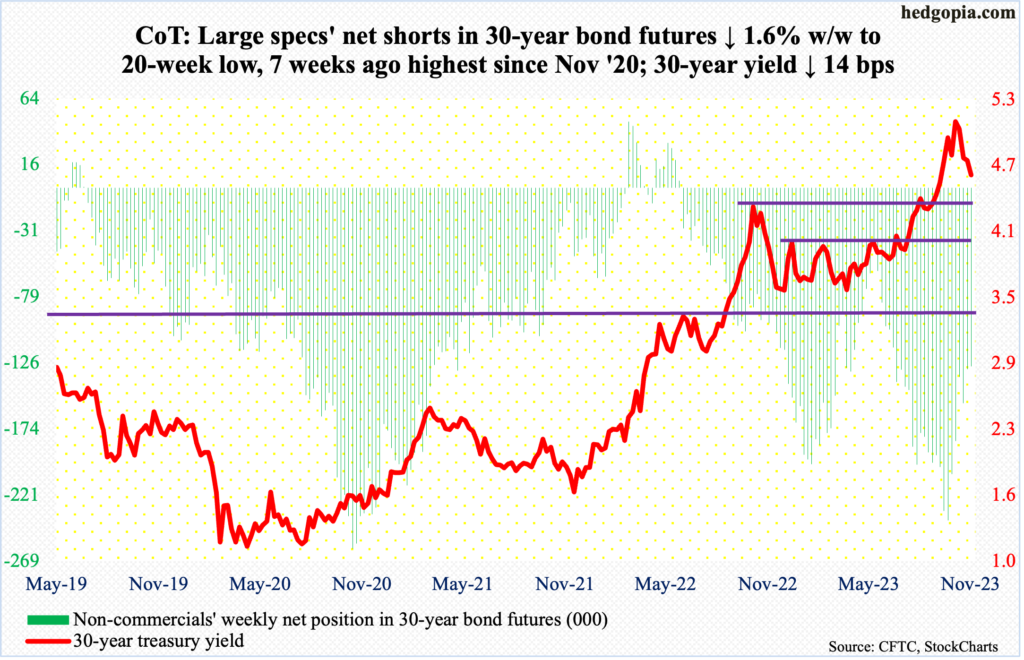
30-year bond: Currently net short 128.7k, down 2.1k.
Major US economic releases for next week are as follows. Markets are closed Thursday for observance of Thanksgiving Day!
Existing home sales (October) are due out Tuesday. September sales dropped two percent month-over-month to a seasonally adjusted annual rate of 3.96 million – a 13-year low. From a year ago, sales plunged 15.4 percent.
Wednesday brings durable goods orders (October) and the University of Michigan’s consumer sentiment index (November, final).
In September, orders for non-defense capital goods ex-aircraft – proxy for business capex plans – increased 0.5 percent m/m to $74.3 billion (SAAR), which set a new record.
November’s preliminary estimate showed consumer sentiment declined 3.4 points m/m to 60.4 – a six-month low. After tumbling to a record low 50 in June last year, sentiment rose as high as 71.5 this July become coming under renewed pressure.
WTI crude oil: Currently net long 194.8k, down 19.6k.
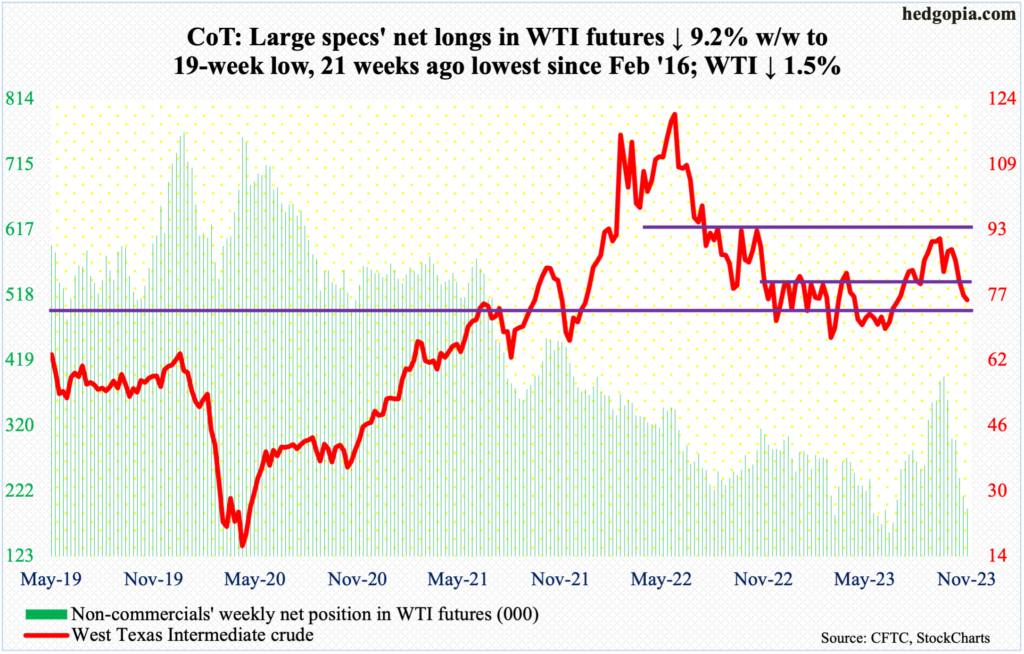
West Texas Intermediate crude suffered its fourth consecutive weekly drop – fifth in the last seven – down 1.5 percent to $76.04/barrel this week. From the September 28th high of $95.03, it is now down 20 percent. In fact, through Thursday’s intraday low of $72.37, it gave back 23.8 percent.
Oddly enough, the crude peaked a week ahead of the October 7th adverse developments in the Middle East. Rally attempts after that peaked on the 20th at $89.85, as risks of the Israel-Hamas war spreading regionally subsided. Subsequently, WTI breached the 50-day moving average and then the 200-day, with the latter at $78.11.
The good thing from oil bulls’ perspective is that Thursday’s low elicited bids at support. Since last December, WTI has essentially gone back and forth between $71-$72 and $81-$82. This week, a spinning top was formed on the weekly. A relief rally looks imminent.
In the meantime, as per the EIA, US crude production in the week to November 10th remained unchanged for six weeks in a row at a record 13.2 million barrels per day; this preceded four weeks of flat output at 12.9 mb/d. Crude imports decreased 21,000 b/d to 6.4 mb/d. As did stocks of gasoline and distillates, which respectively declined 1.5 million barrels and 1.4 million barrels to 215.7 million barrels and 106.6 million barrels. Crude inventory, on the other hand, grew 3.6 million barrels to 439.4 million barrels. Refinery utilization was up nine-tenths of a percentage point to 86.1 percent.
E-mini S&P 500: Currently net short 52.8k, down 588.
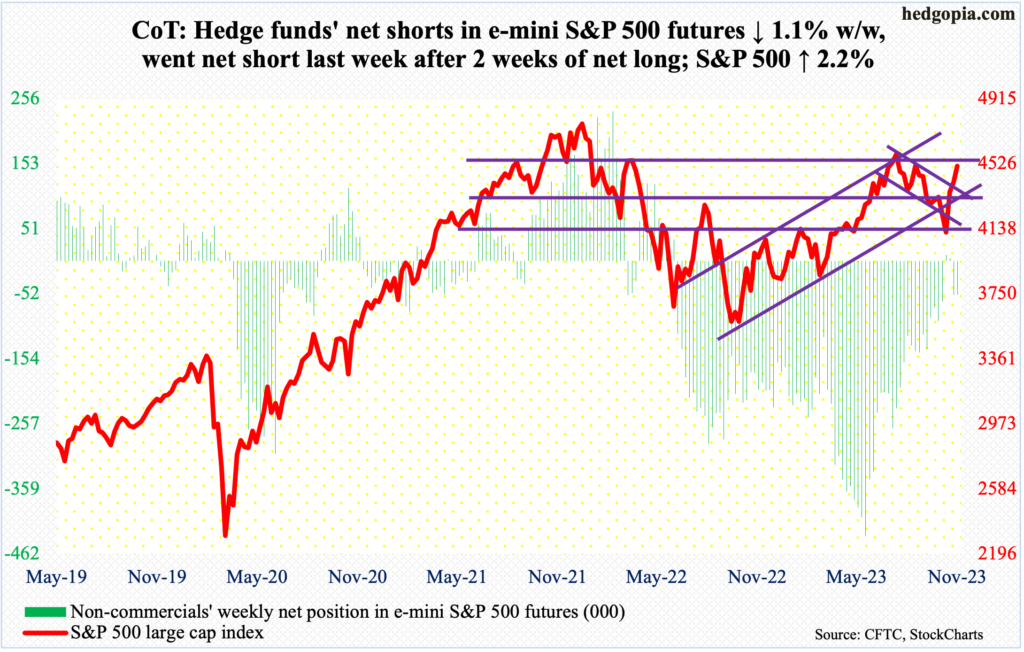
Last week, non-commercials switched back to net short after merely two weeks of staying net long. This week, their holdings were only down 1.1 percent. They have kept their bearish bias essentially unchanged despite two sessions of massive rallies in the cash.
The S&P 500 jumped 1.6 percent last Friday and 1.9 percent this Tuesday. For the week, the large cap index rallied 2.2 percent. This was the third up week in succession, up a cumulative 9.6 percent.
If momentum persists, there is straight-line resistance at 4540s. The index closed Friday at 4514. In due course, though, there are gaps that need to be filled, with this week’s filling just under 4400.
Euro: Currently net long 108.9k, up 19.9k.
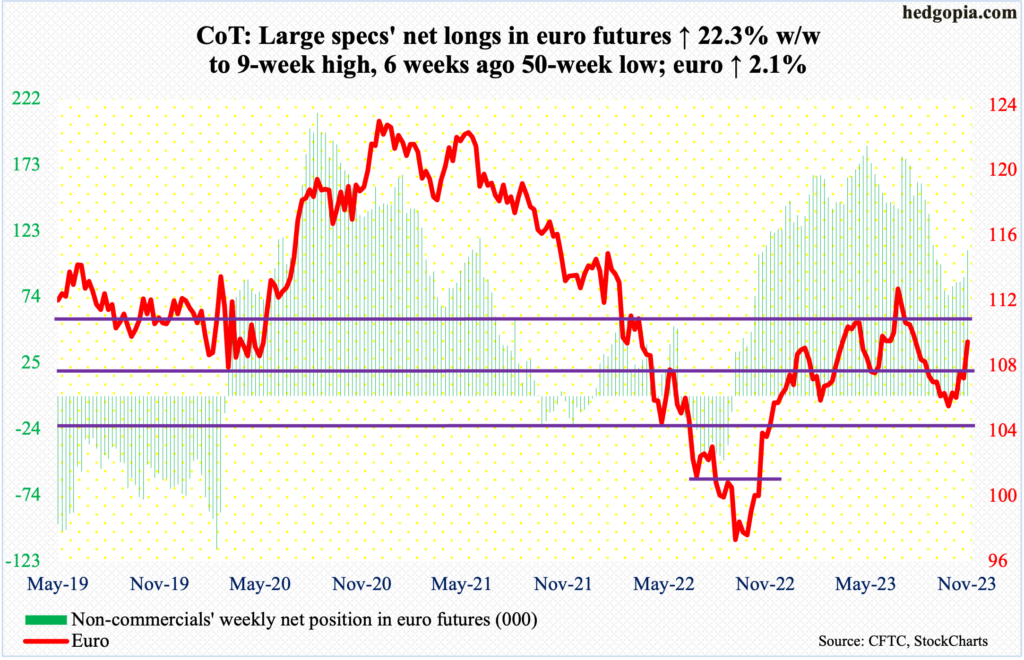
The euro jumped 2.1 percent this week to $1.0908, rallying past the 200-day at $1.0804. Momentum is strong, with the daily RSI at 70.21; this is the second time this month the metric entered the 70s. The last time the RSI was in the 70 zone was July, when soon after the currency peaked at $1.1270.
The currency then dropped 7.3 percent between the July 18th high and the October 3rd low of $1.0448, with the latter a successful test of straight-line support at $1.04-$1.05 that goes back to at least March 2015.
This time around, there are no signs of distribution just yet, although the daily is looking extended.
Gold: Currently net long 155.4k, down 10.8k.
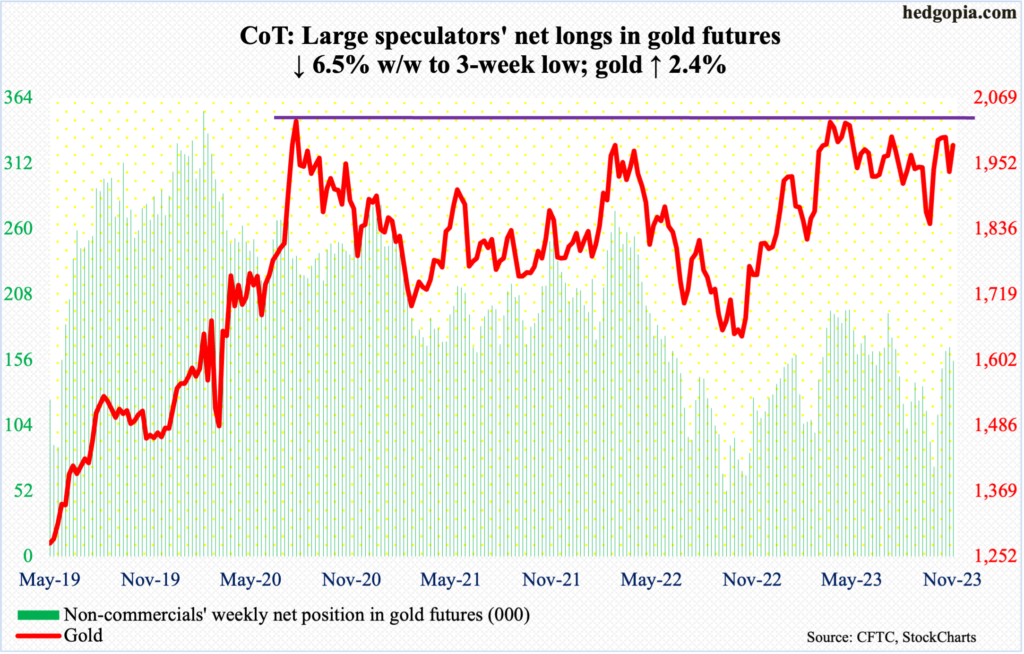
Gold bugs defended the 50-day ($1,941) last Friday as well as in the first two sessions this week, leading to reclaiming of the 200-day ($1,949) by Tuesday. In the right circumstances for the bulls, a golden cross is just a matter of time.
For continued momentum, a break above $2,000 is required. This week, gold rallied 2.4 percent to $1,985/ounce. Before this, for four weeks in a row, the metal rallied past $2,000 intraweek but failed to close above.
Non-commercials are acting as if a breakout is just a matter of time. A break will open the door toward $2,080s where the metal has failed several times – in August 2020 when it reached an all-time high of $2,089, in March last year when it printed $2,079 and in May this year when $2,085 was tagged.
Nasdaq 100 index (mini): Currently net long 315, down 16k.
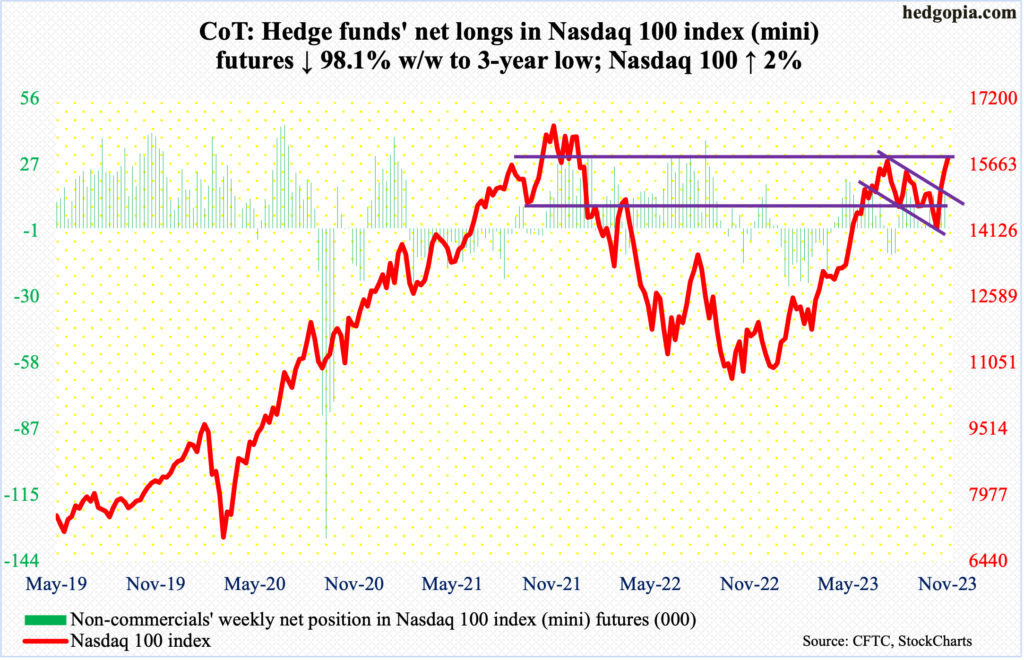
With seven and a half sessions to go, November so far has proven to be quite a comeback month for the Nasdaq 100. Month-to-date, it is up 9.9 percent. This follows three consecutive monthly declines in August through October. On July 19th, the tech-heavy index tagged 15932 before reversing. In October last year, it bottomed at 10441, having earlier reached an all-time high of 16765 in November 2021.
The July high therefore is important, and this was just about tested Tuesday when the Nasdaq 100 ticked 15905. Tech bulls were unable to surpass the hurdle right at the first go, but with a weekly close of 15838, the level remains within reach.
A decisive takeout of the July high can result in a hurried rally toward the record high of two years ago.
That said, non-commercials are acting tentative, having cut their net longs to only nominally long.
Russell 2000 mini-index: Currently net short 65.6k, down 7k.
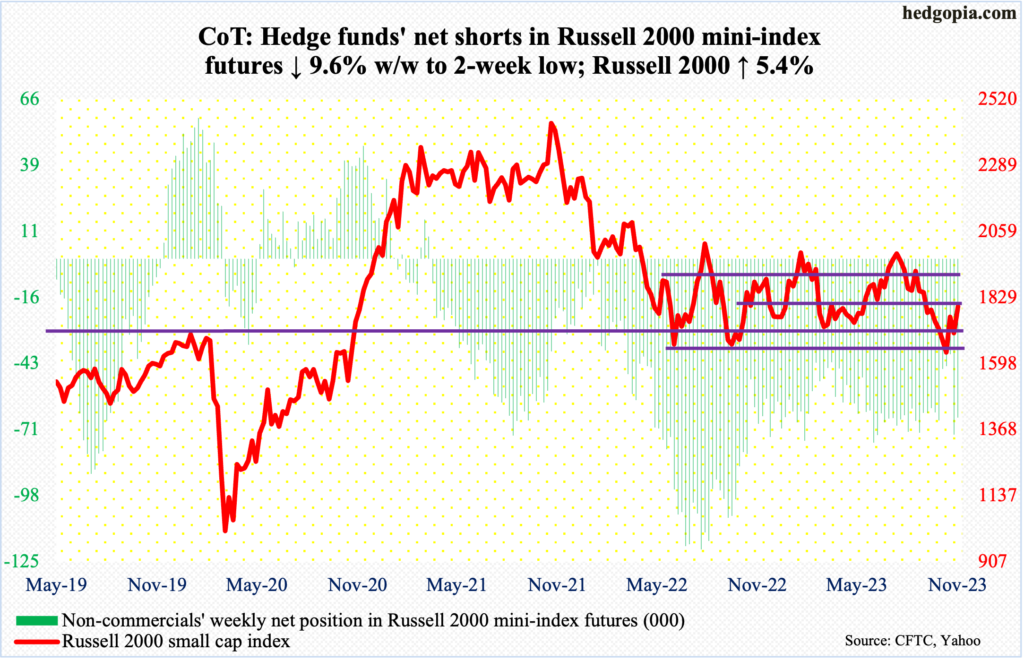
The Russell 2000 had a strong week, up 5.4 percent. The small cap index is now up in two of the last three.
Right after Tuesday’s gap-up session in which it shot up 5.4 percent, momentum continued initially Wednesday, rallying another 1.8 percent, but by the time the session was over, the intraday gains shrunk to 0.2 percent; the intraday reversal helped form a shooting star. Wednesday’s high of 1830, if it stuck, would have reclaimed 1800, which is the midpoint of a 200-point range the index has been stuck in since January last year. This is also where the 200-day (1825) currently sits.
Small-cap bulls hence managed to put their foot down at crucial support but are now struggling at resistance. Before this week’s rally to – and past – 1800, they had to defend the lows of June and October last year when the Russell 2000 bottomed at 1640s. Early this month and late last month, the index tagged 1630s and 1640s in several sessions.
When it was all said and done, the index finished the week at 1798. From the bulls’ perspective, the sooner 1800 gets reclaimed, the better. Else, Tuesday’s gap-up gets filled at 1710, which essentially will be a retest of the range bottom.
US Dollar Index: Currently net long 19.7k, up 263.
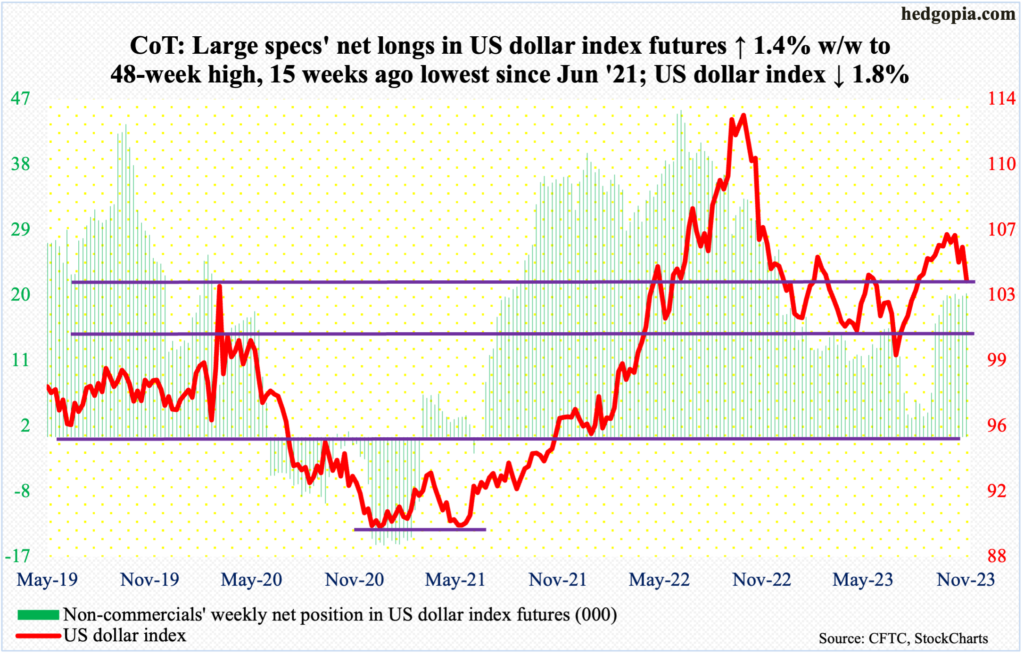
The US dollar index is clinging on to a make-or-break 103-104, which goes back to at least December 2016. Down 1.8 percent this week, it closed at 103.79. Just below lies the 200-day at 103.42, so it is unlikely this dual support gives way right away.
Previously, the index bottomed at 99.22 on July 18th, having peaked in September last year at 114.75.
Both early this month and early October, the index attracted offers at 107, or just north of it. The subsequent weakness culminated in a 1.5-percent post-CPI tumble this Tuesday. The daily is getting oversold. A relief is possible. What transpires at 104.60s will be important.
VIX: Currently net short 42.9k, up 9.9k.
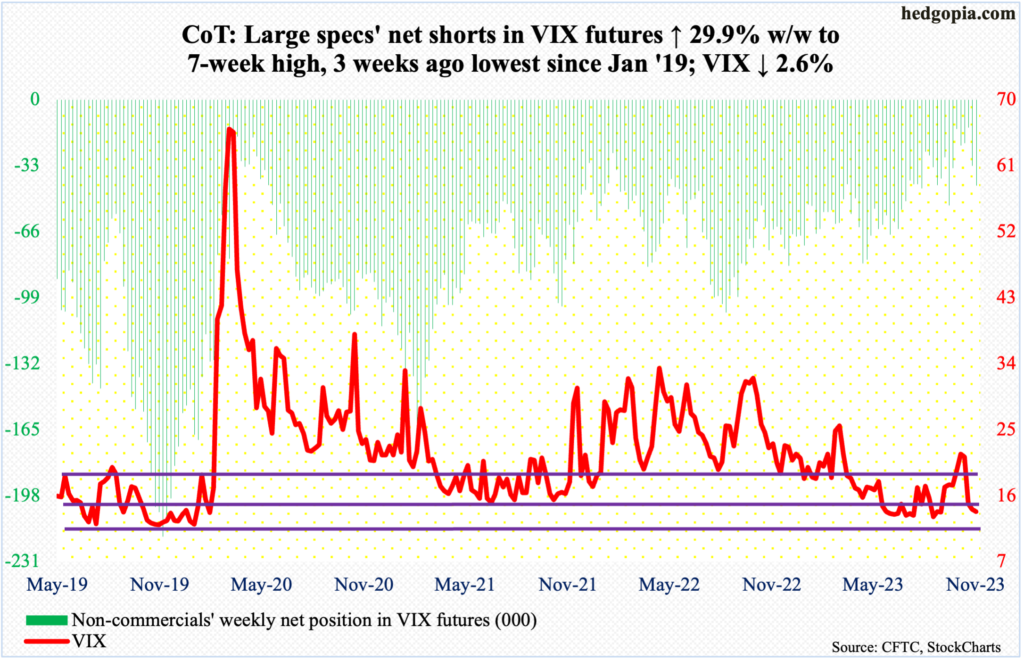
Three weeks ago, VIX formed a massive bearish marubozu on the weekly, closing at 14.91. Two weeks later, the volatility index closed this week at 13.80.
Prior to a rally in VIX in September and October, it routinely found support at 13, or just south of it, in June through September. That is the risk for volatility bulls for now. Else, the daily is way oversold.
Thanks for reading!
