
Following futures positions of non-commercials are as of December 26, 2023.
10-year note: Currently net short 805k, up 117.4k.
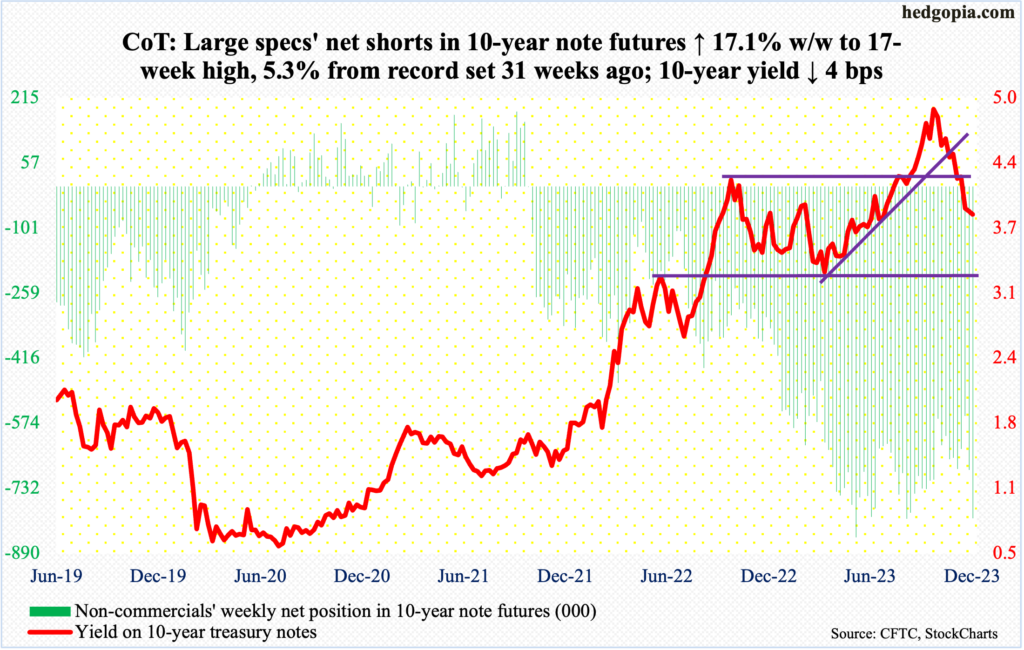
Non-commercials are not pulling back. Far from it! Their holdings of net shorts in 10-year note futures went up another 17.1 percent this week, coming on the heels of last week’s 23.5-percent gain, to 804,984 contracts, which is within spitting distance of the record 850,421 contracts posted in the week to May 30th.
In the week to December 12th, these traders held 556,931 contracts. This was the week the FOMC met. In the very next day (13th), the Federal Reserve unexpectedly made a dovish turn, and the 10-year yield gave back 32 basis points.
The 10-year earlier peaked on October 23rd at five percent, having rallied from 3.25 percent in April (and 2.53 percent in August last year and 1.13 percent in August before that). On the 12th, these notes were yielding 4.21 percent and kept going lower, reaching 3.92 percent as of December 19th, which is when non-commercials aggressively added to their net shorts. This occurred again this week as the 10-year closed at 3.89 percent on Tuesday.
These traders are obviously using the drop in yields as an opportunity to add to net shorts, betting that the rates could not go any lower. If it is a tactical play, they probably will be proven right. The 10-year did tag 3.79 percent on Wednesday but looks ready for a relief rally, with the week ending at 3.87 percent. Immediate resistance lies at 4.1 percent, with the 200-day moving average at 4.04 percent.
But if non-commercials are in it for the long haul strategically, then for them to be right, inflation will have to make a resurgence next year, thus throwing a monkey wrench into the December 13th Fed pivot. Else, they will be forced to cover at some point, setting in motion a self-fulfilling prophecy of lower rates leading to even lower rates.
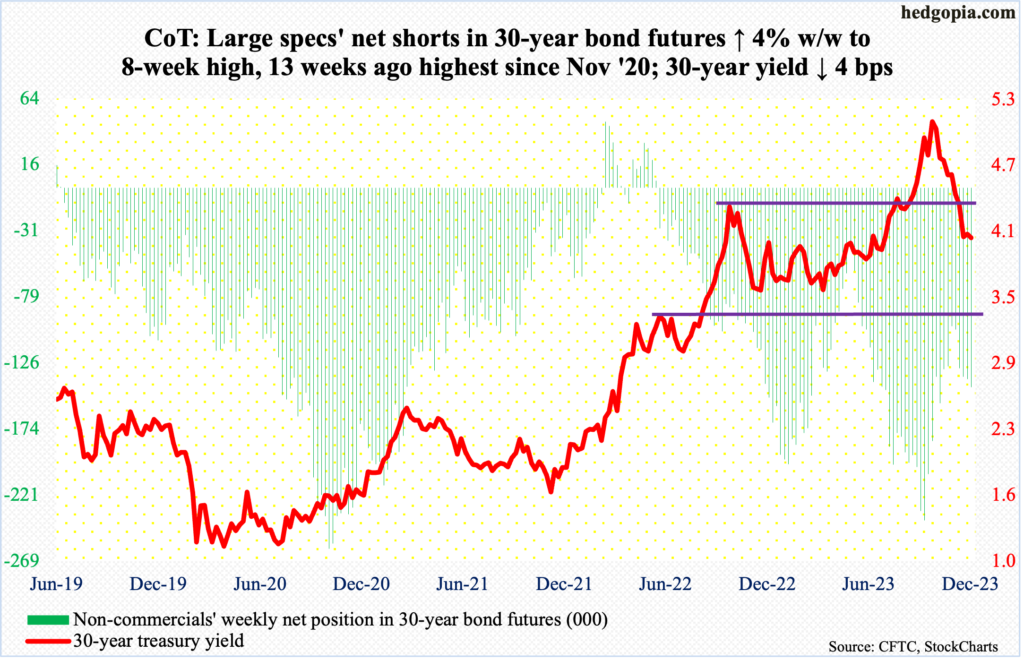
30-year bond: Currently net short 143.5k, up 5.5k.
Major US economic releases for next week are as follows. Markets are closed Monday for observance of Happy New Year 2024!
JOLTs job openings (November) and the ISM manufacturing index (December) are due out Wednesday.
In October, non-farm job openings declined 617,000 month-over-month to 8.7 million. Openings are down 3.3 million from the all-time high of 12 million posted in March 2022.
Manufacturing activity was unchanged m/m at 46.7 percent in November.
Friday brings payrolls (December), the ISM services index (December) and durable goods orders (November, revised).
In the first 11 months this year, an average 232,000 non-farm jobs have been created each month. This is slower than last year’s monthly average of 399,000 and 606,000 before that in 2021.
November non-manufacturing activity rose nine-tenths of a percentage point m/m to 52.7 percent. This is the 11th month in a row of 50-plus reading.
Orders for non-defense capital goods ex-aircraft – proxy for business capex plans – increased 0.8 percent m/m to a seasonally adjusted annual rate of $74 billion, setting a new record.
WTI crude oil: Currently net long 208.5k, up 18k.
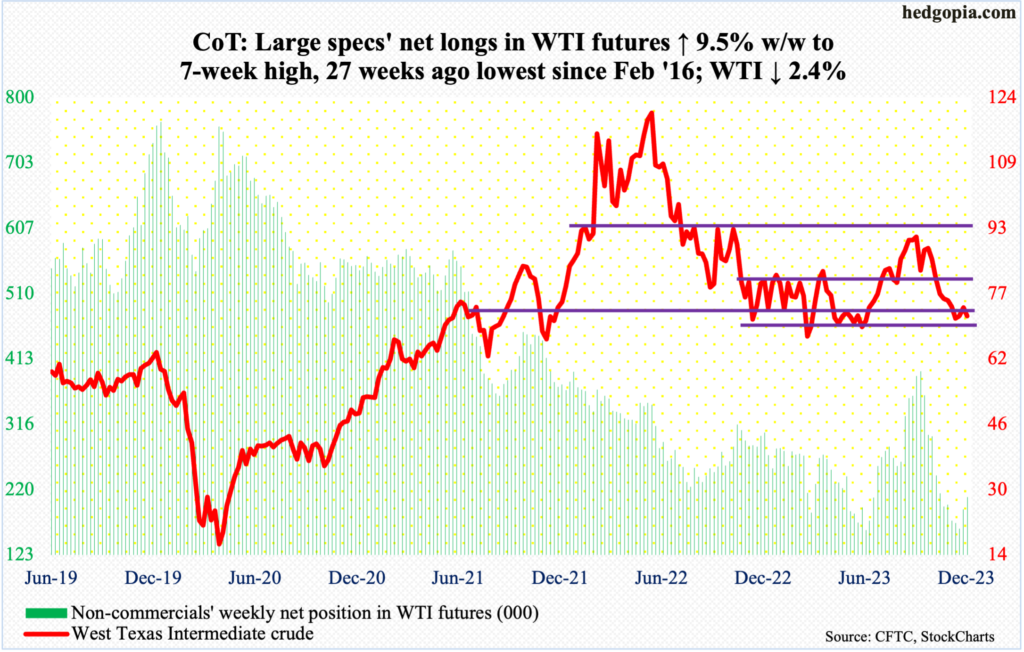
West Texas Intermediate crude is back on the lower end of a one-year range between $71-$72 and $81-$82. This week, it shed 2.6 percent to $71.65/barrel. The crude has been under pressure since ticking $95.03 on September 28th. The rally off the December 13th low of $67.71 stopped Tuesday as it reached $76.18.
Inability to even go test the 200- and 50-day ($77.67 and $76.65 respectively) probably opens the door to a test of the low on the 13th.
In the meantime, as per the EIA, US crude production in the week to December 22nd was unchanged week-over-week at a record 13.3 million barrels per day. Crude imports decreased 474,000 b/d to 6.3 mb/d. As did stocks of crude and gasoline, which respectively declined 7.1 million barrels and 669,000 barrels to 436.6 million barrels and 226.1 million barrels. Inventory of distillates, however, rose 741,000 barrels to 115.8 million barrels. Refinery utilization was up nine-tenths of a percentage point to 93.3 percent.
E-mini S&P 500: Currently net short 192.5k, down 2.9k.
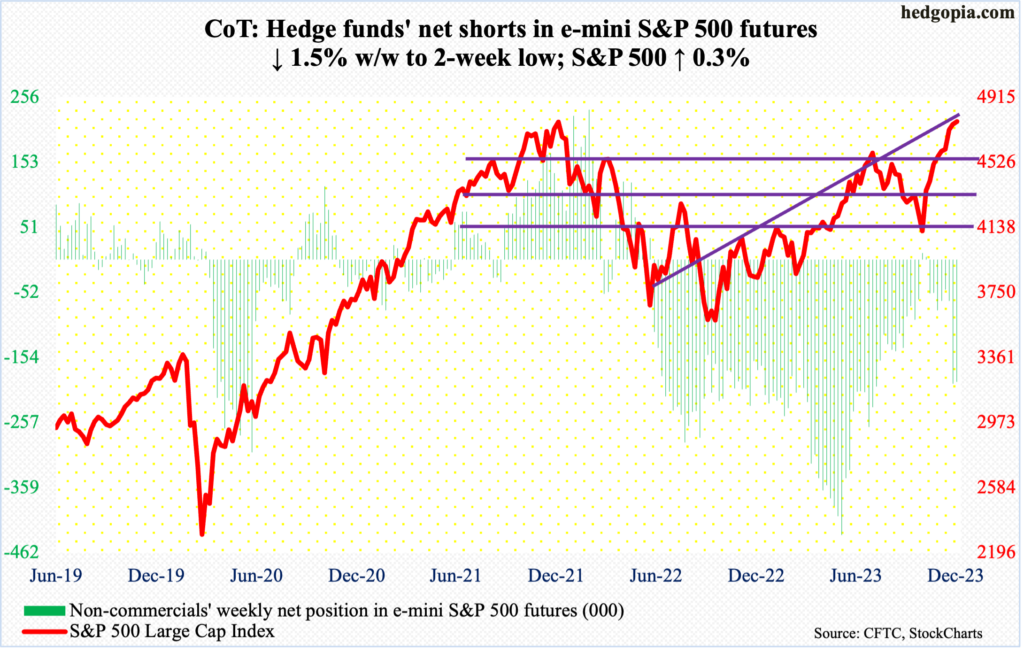
Ticking 4793, equity bulls on Thursday came within less than 26 points of the January 2022 record of 4819 but could not quite pull it off. By Friday, the S&P 500 moved further away from the nearly-two-year peak, losing 0.3 percent to 4770.
From bulls’ perspective, the good thing is that bids showed up Friday near the 10-day – the session low of 4752 versus the average at 4754. Nevertheless, it increasingly feels like the large cap index is ready to roll over, as signs of fatigue are showing up amidst massively overbought conditions.
A major breakout retest lies ahead just north of 4600, which is where the S&P 500 peaked in July at 4607 before unraveling to give back 500 points in three months.
In the meantime, non-commercials going into next year are sticking with their decent-size bearish exposure.
Euro: Currently net long 117.4k, up 2.8k.
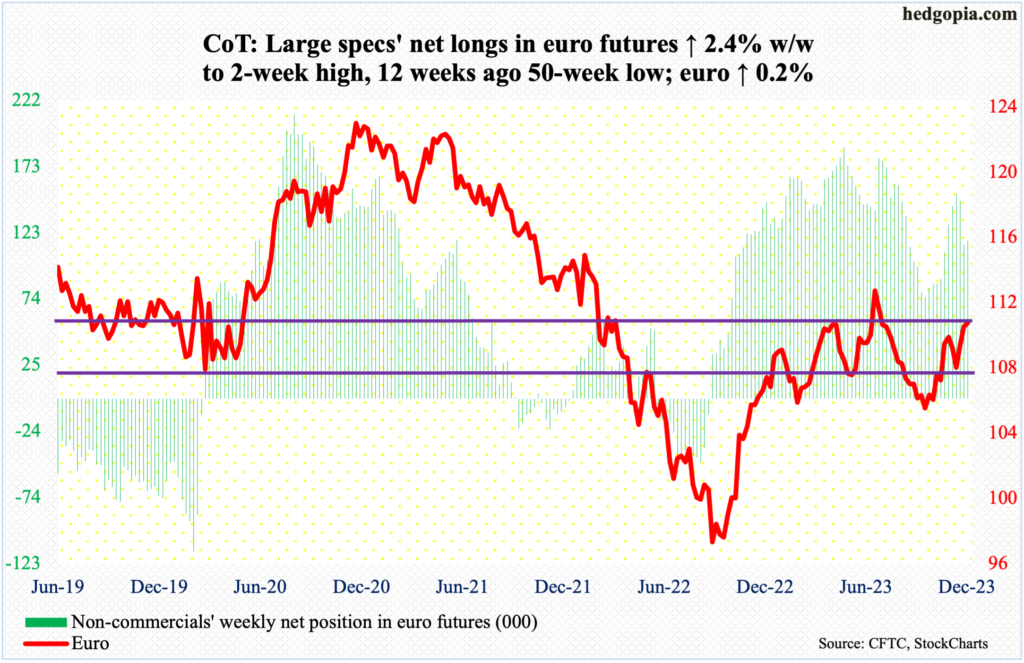
Euro bulls rallied the currency to a five-month high this week before sellers took over. Wednesday’s gap-up intraday high of $1.1125 was a decent attempt by the bulls to recapture $1.10 but in the end, they came up short, closing the week at $1.1036. Odds favor a breach in the sessions ahead.
The 50- and 200-day – both rising – lie at $1.0814 and $1.0841 respectively.
Gold: Currently net long 207.7k, up 6.4k.
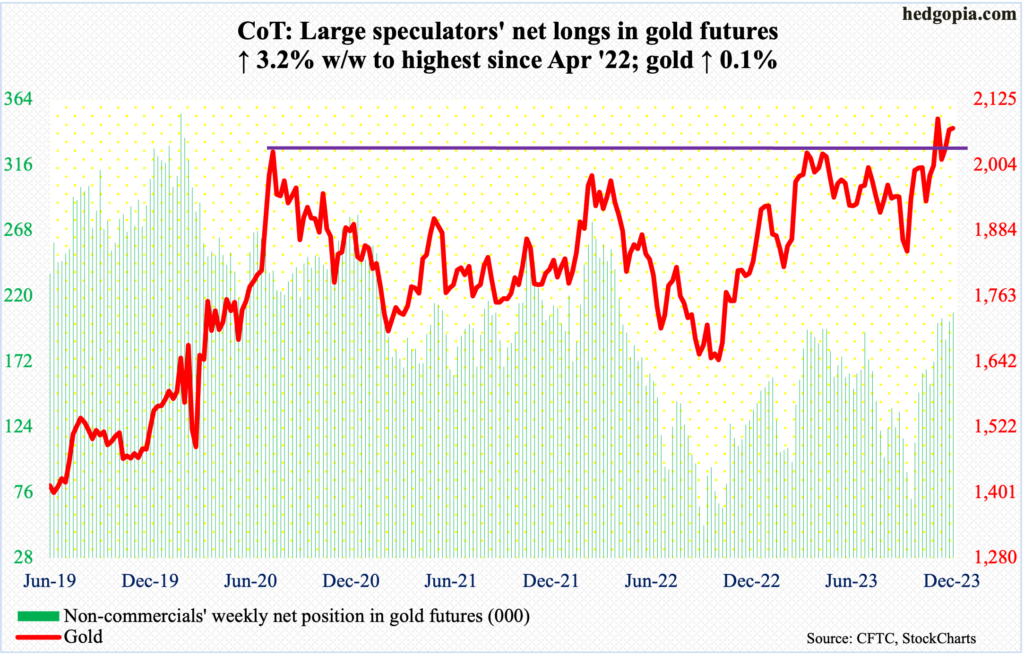
Once again, gold bugs went after $2,080s and once again their effort failed to bear fruits.
Early this month, no sooner did gold break out of $2,080s than it quickly met with a nasty reversal. This level has a lot of memory attached to it. In August 2020, the metal posted a new all-time high of $2,089 and retreated. This occurred again in March last year when it printed $2,079 and in May this year when $2,085 was tagged.
On Wednesday and Thursday, gold touched $2,096 and $2,098 intraday, but only to finish the week at $2,072, forming a weekly shooting star. For December, a massive monthly spinning top formed.
Despite all these developments, gold remains in the periphery of the said level. Right here and now, the path of least resistance is down on the daily, with the 50-day at $2,014 and decent horizontal support at $2,000.
Nasdaq 100 index (mini): Currently net long 28k, up 5.8k.
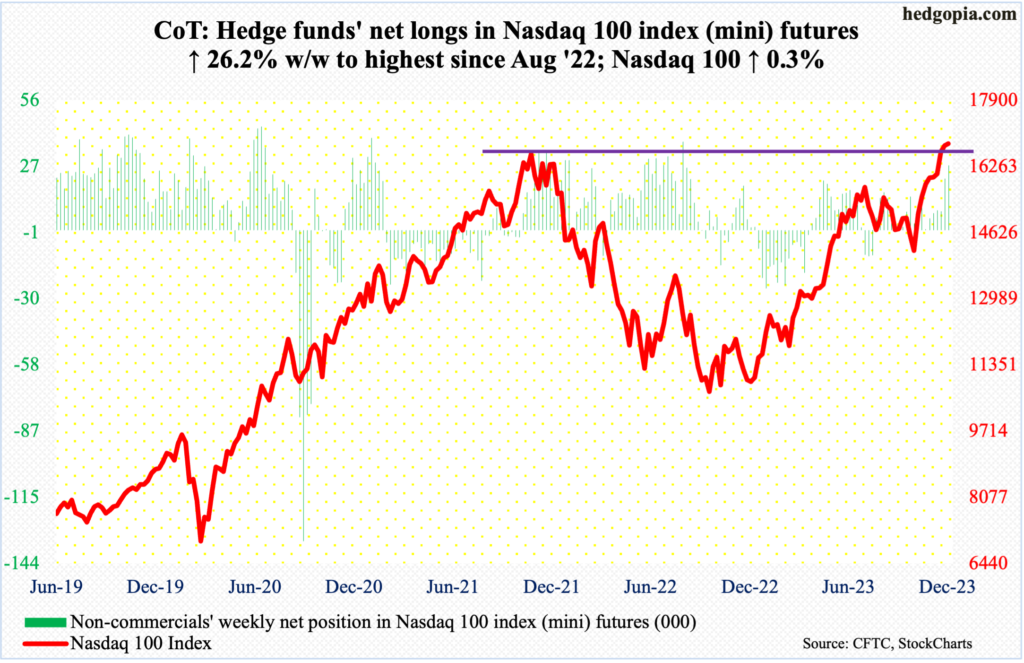
Yet another intraday high this week for the Nasdaq 100, but the finish left much to be desired. On Thursday, the index rallied as high as 16969 but only to close at 16898. On Friday, it dropped 0.4 percent to 16826.
As was the case with the S&P 500, the 10-day provided support on Friday; the session low of 16758 also tested the November 2021 record of 16765, which was surpassed last week. This likely gets breached next year.
The Nasdaq 100 has rallied for nine weeks straight, pushing the weekly RSI into the low-70s. The daily RSI, which persistently remained in the 70s for most of the past month and a half, is beginning to head lower, ending the week at 68.47.
In the likely event of a drawdown, nearest support lies at 16100s.
Russell 2000 mini-index: Currently net short 12.4k, down 17.6k.
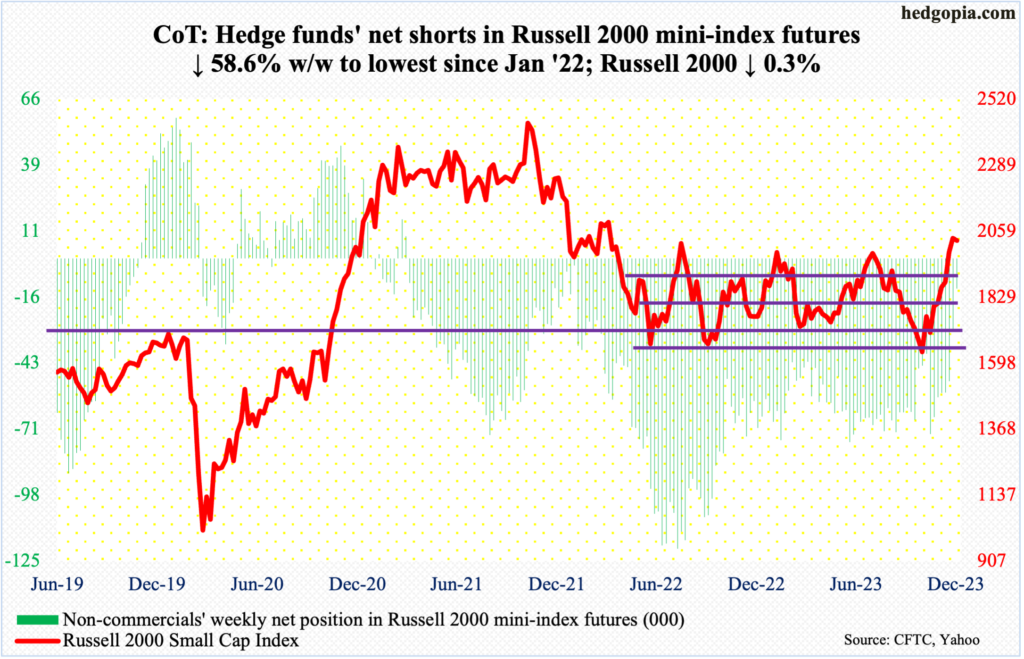
After a ferocious November and December, the Russell 2000 failed to end the week in the green. By Wednesday, the small cap index had rallied to 2072, but this only attracted a flood of sell orders. When it was all said and done, the week ended down 0.3 percent to 2027, forming a weekly shooting star. This was the first down week in seven and second in nine.
Earlier, on the 13th (this month), the Russell 2000 broke out of a 200-point range between 1900 and 1700, which had been in place since January last year. Even before that in October, 1640s, which were hit last year in June and October, was defended.
The Russell 2000 peaked at 2459 in November 2021 and is nowhere near that. As things stand, it is time to digest the gains of November and December. In due course, breakout retest at 1900 is the path of least resistance.
US Dollar Index: Currently net long 3.1k, down 805.
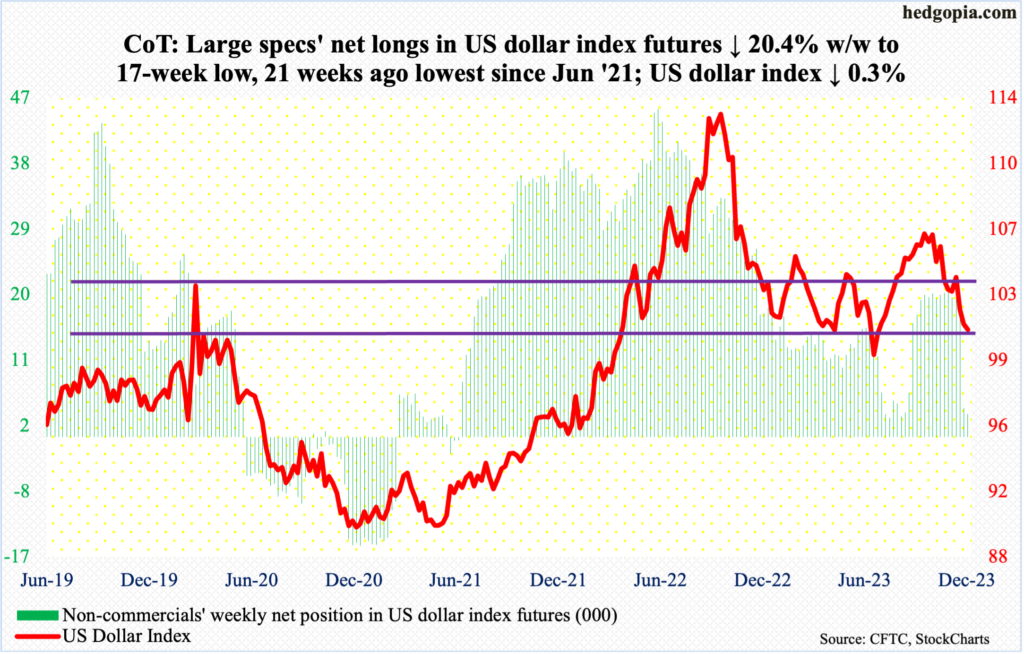
The US dollar index continued to come under pressure – its third straight down week and sixth in seven – with some signs of stability near term. It shed 0.3 percent for the week but was down as much as one percent at Thursday’s low of 100.32. That low was bought, with further buying on Friday.
The index peaked early October at 107.05 and began to really come under pressure early November. Post-Fed pivot on the 13th, it sliced through horizontal support at 103-104 as well as the 200-day.
Given that breakdown, dollar bulls should find this week’s defense of the 100-101 level encouraging. The daily is itching to rally.
VIX: Currently net short 56.2k, up 26k.
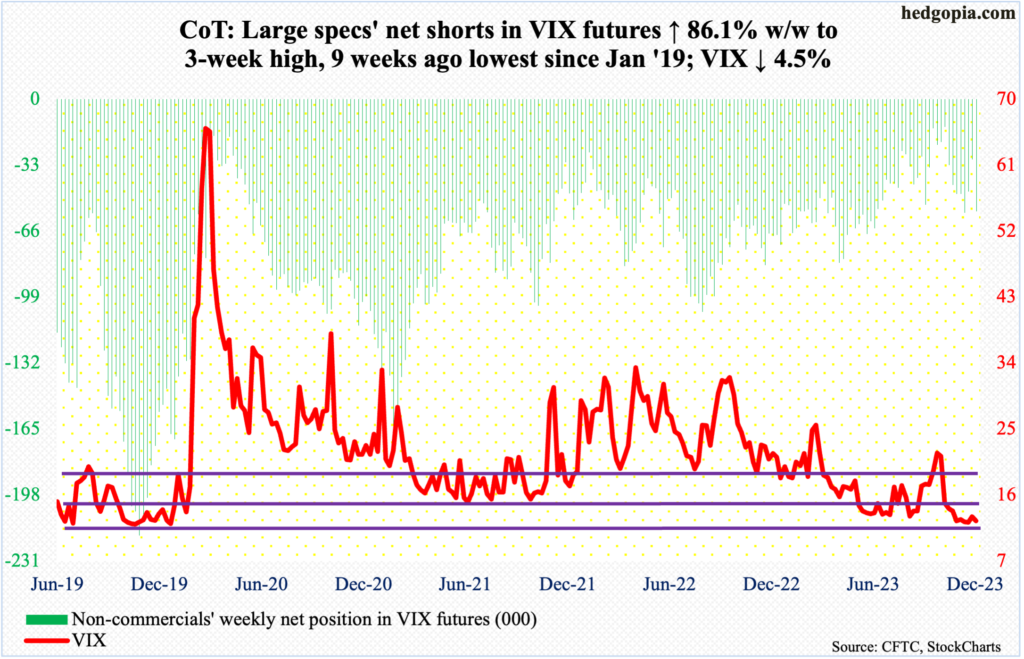
VIX gave back 0.58 points this week to 12.45 but continued to hug the 12 handle. This was the fifth week in the last seven that the volatility index closed north of 12, with the lone exception being last week when it closed at 13.03.
The weekly has room to rally.
Thanks for reading!
