
Following futures positions of non-commercials are as of January 30, 2024.
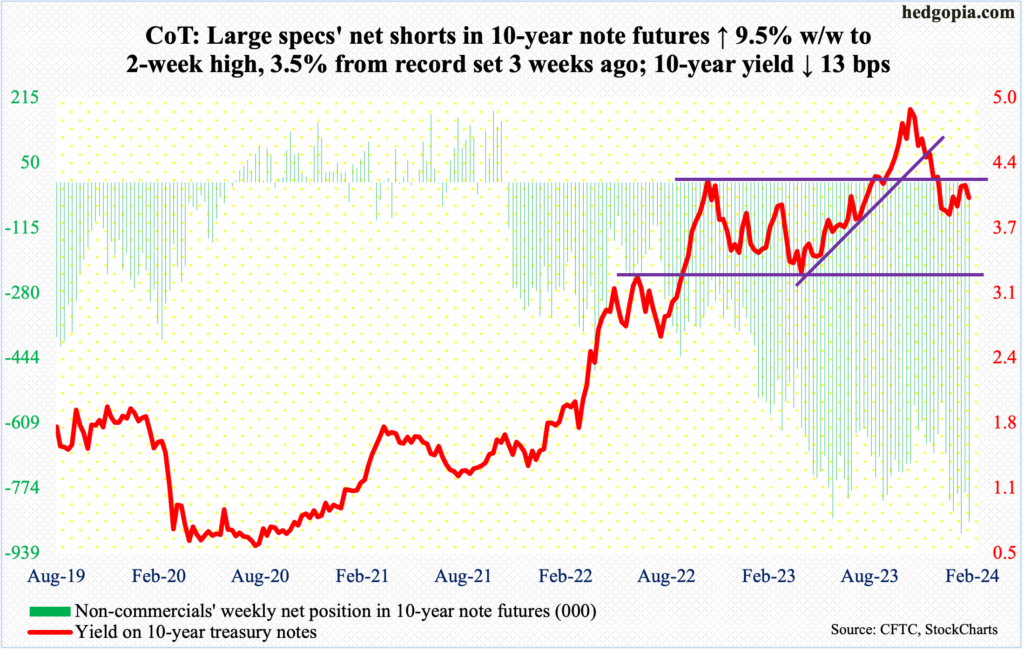
10-year note: Currently net short 859k, up 74.3k.
January produced a blockbuster payrolls report. The economy added 353,000 non-farm jobs and the prior months were revised higher. This only confirms the recent trend of better-than-expected numbers, including the fourth-quarter real GDP and December’s retail sales.
Taking this into account, it begs the question if it is right to argue that the monetary policy is restrictive enough, which the Federal Reserve contends it is. Indeed, the fed funds rate has been raised from a range of zero to 25 basis points in March 2022 to the current range of 525 basis points to 550 basis points, with the last increase having taken place last July. The benchmark rates have come a long way in a relatively short period of time. Yet, the economy for the most part is hanging in there.
Rather astoundingly, futures traders continue to expect six 25-basis-point cuts this year, ending 2024 at 375 basis points to 400 basis points. Friday’s jobs report did not change their outlook, never mind the fact that the FOMC dot plot has signaled three cuts this year (more on this here).
Unless these traders are in the know about something damaging that is simmering in the banking sector, which in due course can force the Federal Reserve’s hands to aggressively ease, it is a money-losing proposition to expect six cuts this year.
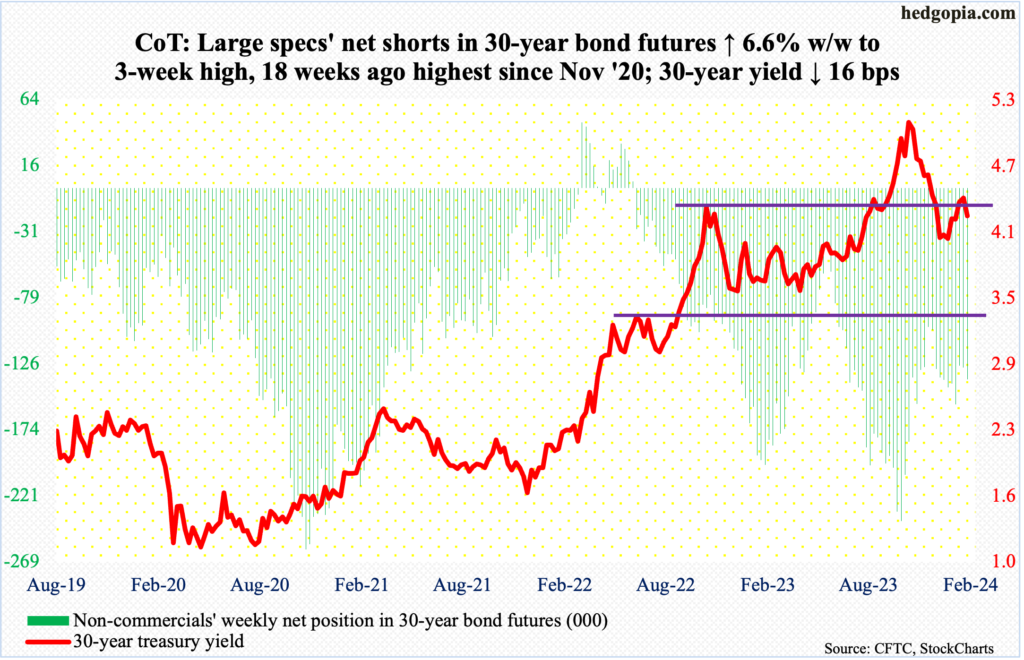
30-year bond: Currently net short 137.5k, up 8.5k.
Major US economic releases for next week are as follows.
The ISM services index (January) is due out Monday. Non-manufacturing activity in December dropped 2.1 percentage points month-over-month to 50.6 percent – a seven-month low.
Wednesday brings consumer credit (December). In November, it grew 2.8 percent year-over-year to a seasonally adjusted $5 trillion – a new record. This was made up of revolving credit, up 9.5 percent from a year ago to $1.3 trillion – also a new record – and non-revolving, up 0.6 percent y/y to $3.7 trillion, which was within spitting distance of last July’s record $3.71 trillion.
WTI crude oil: Currently net long 240.1k, up 18.8k.
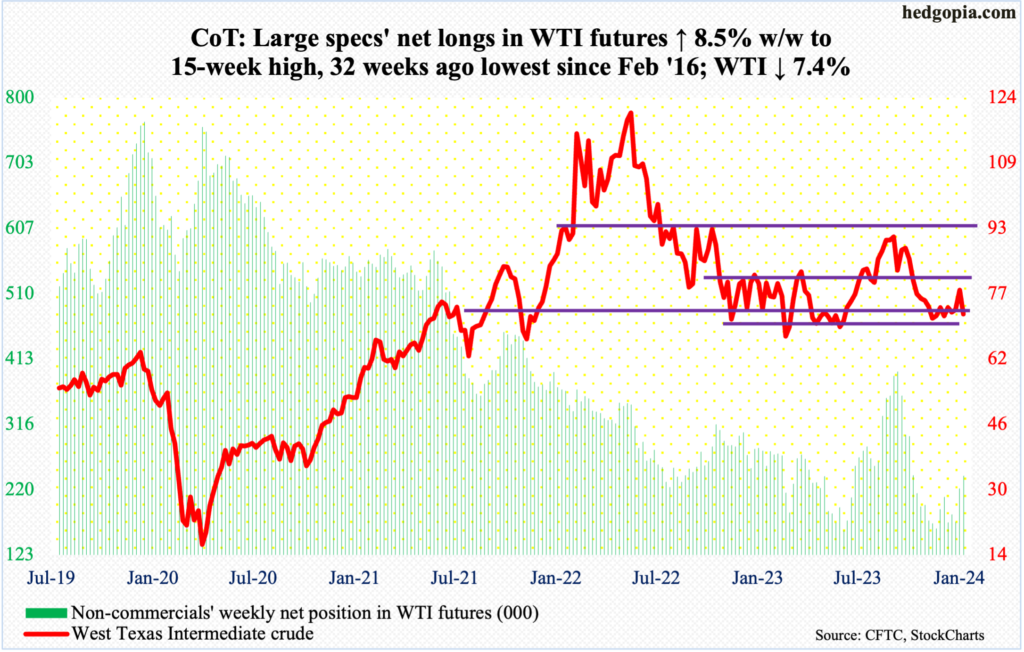
West Texas Intermediate crude tried to begin the week with a decent rally, touching $79.29 intraday, but only to reverse and close Monday’s session at $76.78. The rejection came just before genuinely testing the upper bound of a 14-month range between $71-$72 and $81-$82. The 200-day moving average lies at $77.42. By Friday, the crude was down in four of the five sessions – past the 50-day at $73.51, closing the week down 7.4 percent to $72.28/barrel with a weekly bearish engulfing candle.
WTI peaked last September at $95.03, having rallied from last June’s low of $67.05. On December 13th, it ticked $67.71 intraday before bottoming. This price point – $67 – is crucial.
In the meantime, as per the EIA, US crude production in the week to January 26th jumped 700,000 barrels per day week-over-week to 13 million b/d. Crude imports increased 25,000 b/d to 5.6 mb/d. Stocks of crude and gasoline rose as well – up 1.2 million barrels each to 421.9 million barrels and 254.1 million barrels. Distillate inventory, on the other hand, declined 2.5 million barrels to 130.8 million barrels. Refinery utilization dropped 2.6 percentage points to 82.9 percent.
E-mini S&P 500: Currently net short 226k, up 36.5k.
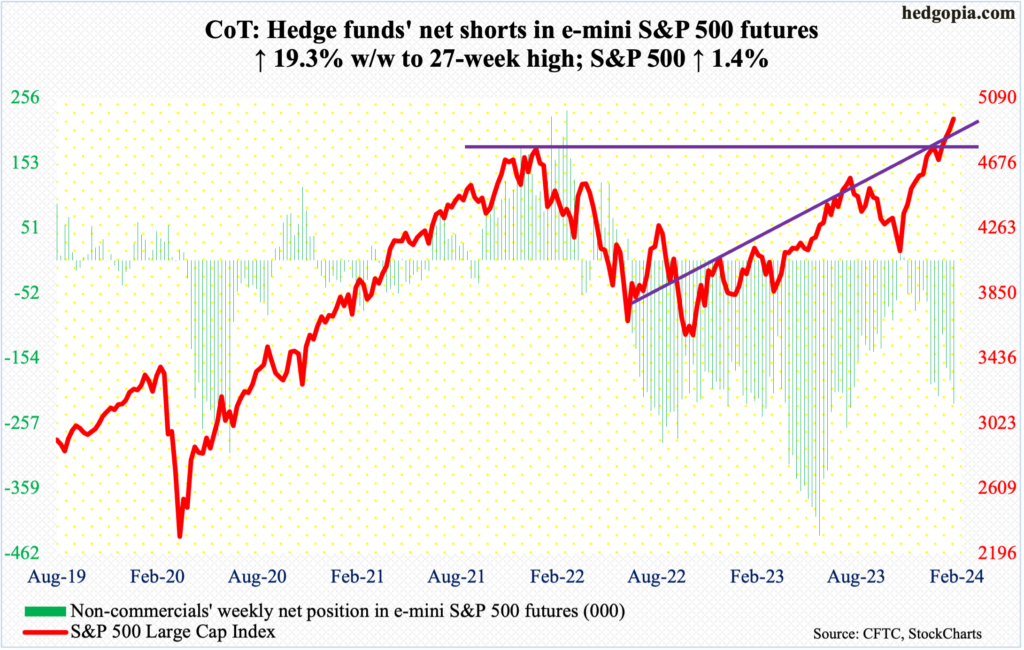
Another up week! Four in a row; it was the 13th up week in 14. Until Wednesday’s FOMC meeting-induced selling, the S&P 500 was down 0.9 percent for the week. Then it rallied 2.3 percent in the remaining two sessions to reverse the week higher 1.4 percent.
All in all, breadth was narrow, with the percentage of S&P 500 stocks above the 50-day down 10.2 percentage points w/w to 66.4 percent. The bulls will take this regardless. The large cap index posted yet another intraday high of 4975, closing the week at 4959.
The S&P 500 has been rallying since late October last year when it bottomed at 4104. It is up north of 21 percent. Even some ardent bulls are saying, ‘this is crazy!’ The latest move higher came on January 19th when the index busted through 4800, which had held it down since late December, which also meant the January 2022 high of 4819 was eclipsed.
In the meantime, Investors Intelligence’s bullish percent this week jumped 4.8 percentage points w/w to 57.7 percent. While it can be argued that sentiment is yet to hit 60 percent, the fact remains that this week’s reading reached the highest since mid-July 2021. There is a limit to how much a rubber band can be stretched.
In the event of a pullback, short-term support lies at 4900, followed by the important 4800-4810s.
Euro: Currently net long 88.8k, up 447.
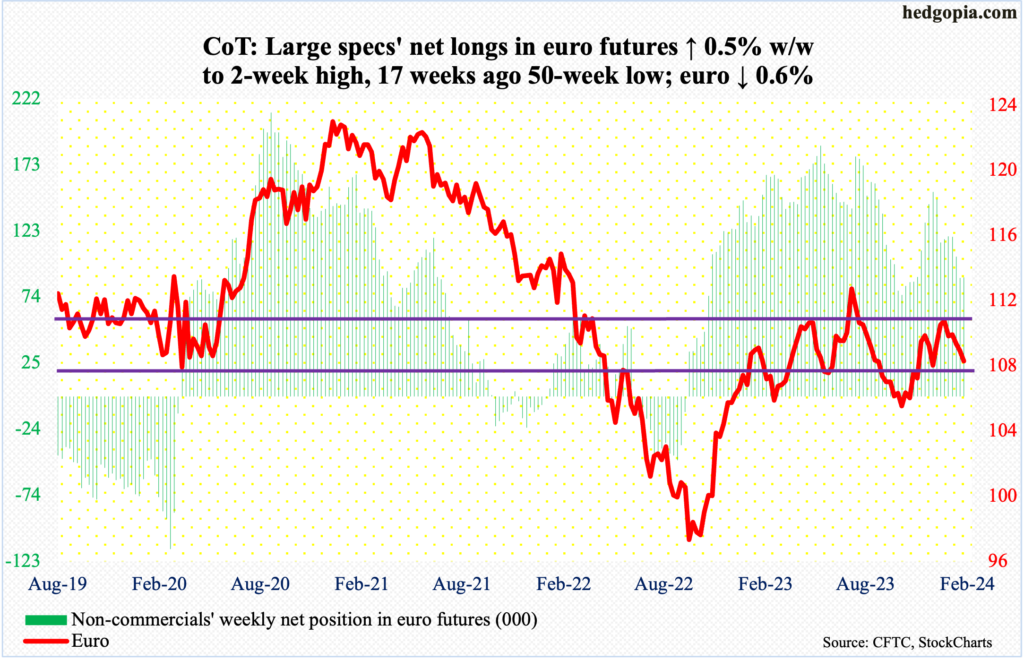
Horizontal support at $1.0820s was breached on Friday, as the euro ended the week down 0.6 percent to $1.0788. Since peaking at $1.1125 on December 27th, there have been five weeks, and the currency was down in four of them, with the only up week barely up.
If the weekly prevails, the euro can continue lower, as the overbought condition it was in continues to get unwound. The daily is deeply oversold but is struggling to mount a rally. The daily RSI had an opportunity to reclaim the median but reversed lower to close the week at 39.56.
Gold: Currently net long 147.8k, down 21.7k.
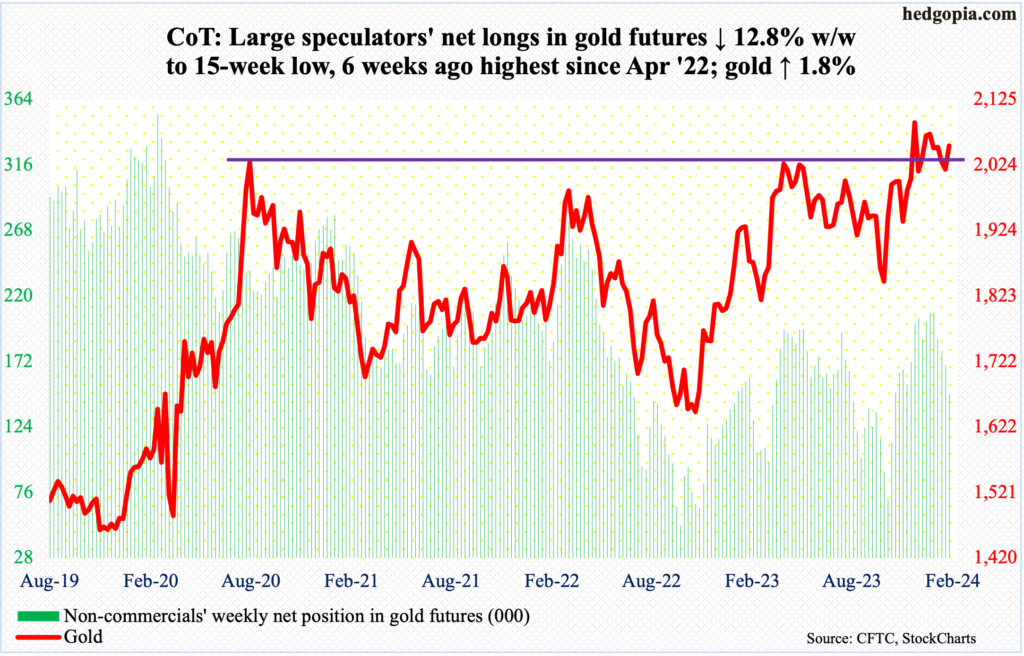
Gold gapped up on Tuesday, reclaiming the 50-day. It remains above the average at $2,039. The downside, once again, is that gold bugs failed to hang on to all of the gains. By Thursday, the metal rallied as high as $2,083 but closed the week at $2,054/ounce, up 1.8 percent.
Non-commercials, in the meantime, continue to cut net longs in gold futures, which are at a 15-week low. These traders began to reduce their long exposure after the yellow metal failed to reclaim $2,080s.
Gold rose as high as $2,152 on December 4th but reversed to close the session at $2,042. Resistance at $2,080s has proven tough to crack. In August 2020, the metal posted a new all-time high of $2,089 and retreated. The reversal occurred again in March 2022 when it printed $2,079 and in May last year when $2,085 was tagged, followed by rejection in late December and early January. We can now add to this Thursday’s rejection. This opens the door to lower prints in the sessions ahead.
Nasdaq (mini): Currently net long 39.3k, up 6.2k.
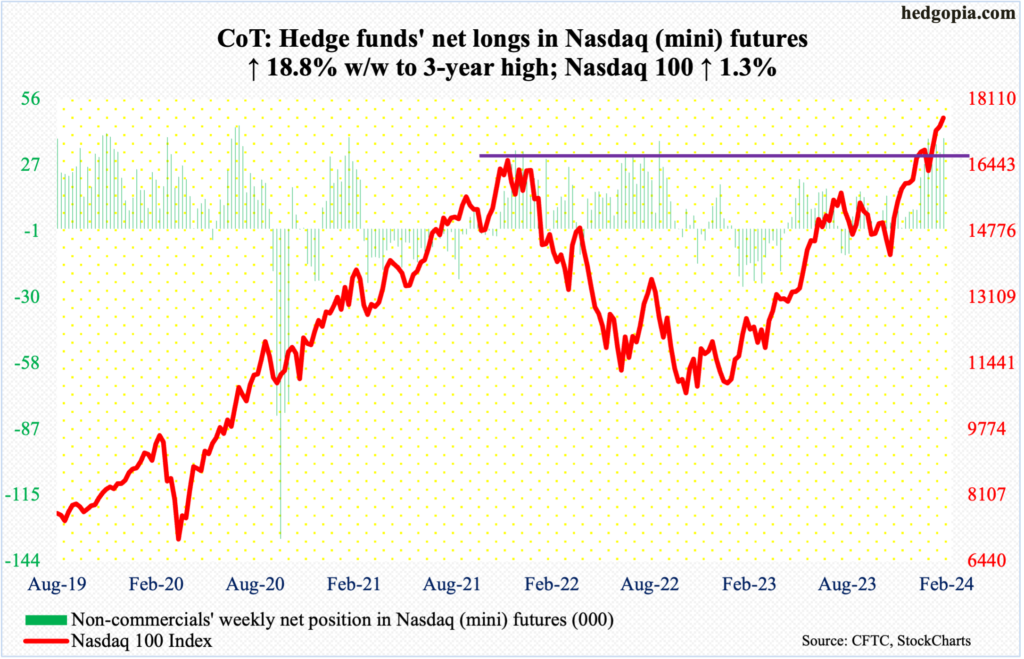
Of the five majors reporting this week (more on this here), post-earnings reaction was negative for Apple (AAPL), Microsoft (MSFT) and Google owner Alphabet (GOOG) and positive for Amazon (AMZN) and Facebook owner Meta (META). Yet, the Nasdaq 100 ended up 1.3 percent for the week. As a matter of fact, the tech-heavy index was down 1.7 percent until Wednesday, before rallying three percent on Thursday and Friday to end the week at 17643.
Friday’s high of 17682 surpassed last week’s high of 17665 by a tad. More importantly, last week’s spinning top has been followed by a potentially bearish hanging man, which, if true, can signal an important reversal. Fingers crossed!
Russell 2000 mini-index: Currently net short 10.5k, up 4.3k.
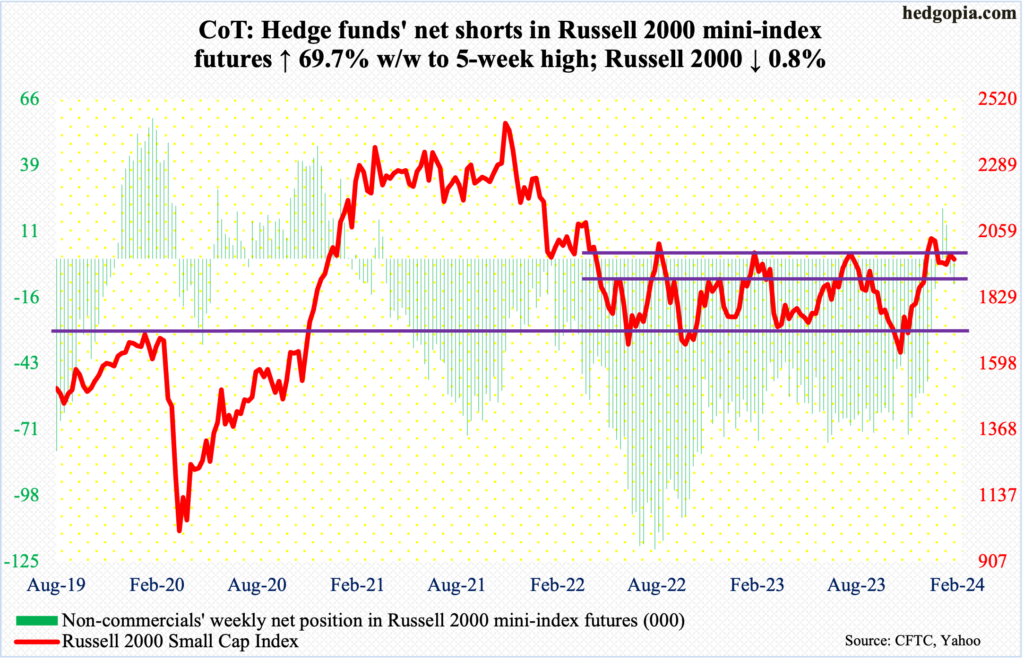
The Russell 2000 diverged with both the S&P 500 and Nasdaq 100 in a big way. The small cap index dropped 0.8 percent for the week, while the other two indices were solidly in the plus column.
Ironically, even in the wake of Friday’s robust jobs report, the Russell 2000, which has a larger exposure to the domestic economy than its large-cap peers, failed to rally. For two weeks now, the index has struggled at 2000, and that was true this Tuesday and Wednesday.
Earlier on December 13th, the Russell 2000 broke out of a 200-point range between 1900 and 1700, which had been in place since January last year. A measured-move target of the breakout came to 2100, which was just about hit two weeks later when on December 27th it tagged 2072.
It now increasingly looks like the index once again is headed for a breakout retest at 1900, which occurred mid-January – successfully.
US Dollar Index: Currently net long 372, down 1.3k.
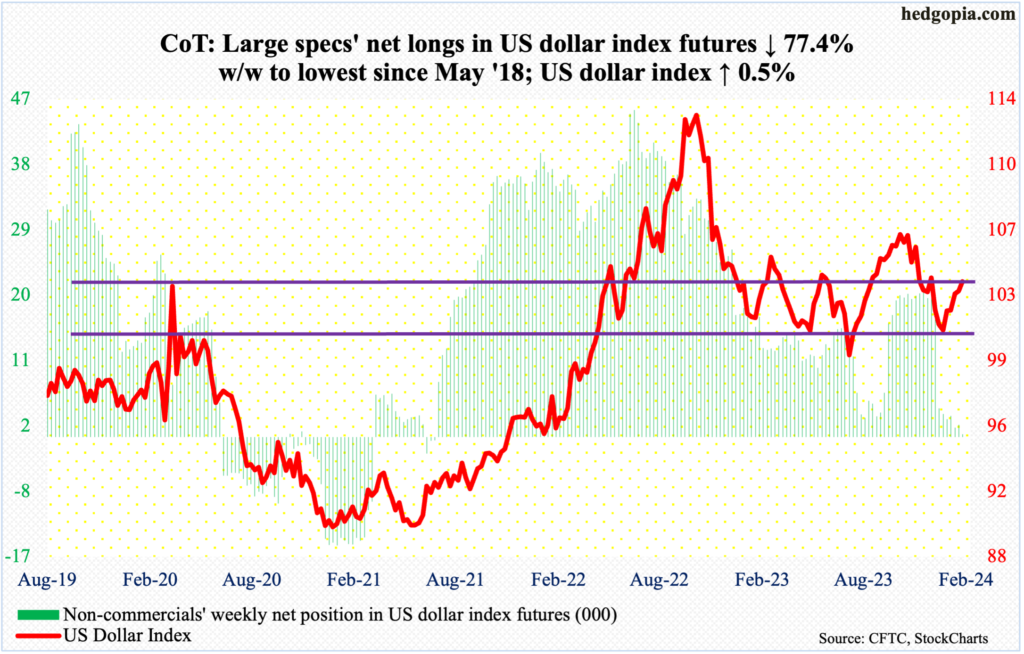
The US dollar index, up 0.5 percent this week to 103.78, has now rallied for five straight weeks. it bottomed at 100.32 on December 28th.
Before that, the index peaked on October 3rd at 107.05 and began to really come under pressure early November. Post-Fed pivot on December 13th, it sliced through horizontal support at 103-104. It has now made a return trip to that price point.
Going back all the way to 1999, 103-104 has proven to be crucial for both bulls and bears.
Perhaps importantly, the daily RSI this week turned up right at the median, even as the weekly – at 52.15 – just crossed over from below. Dollar bulls should like this. Momentum will decidedly shift upward once 103-104 gives way.
VIX: Currently net short 54.5k, up 5.3k.
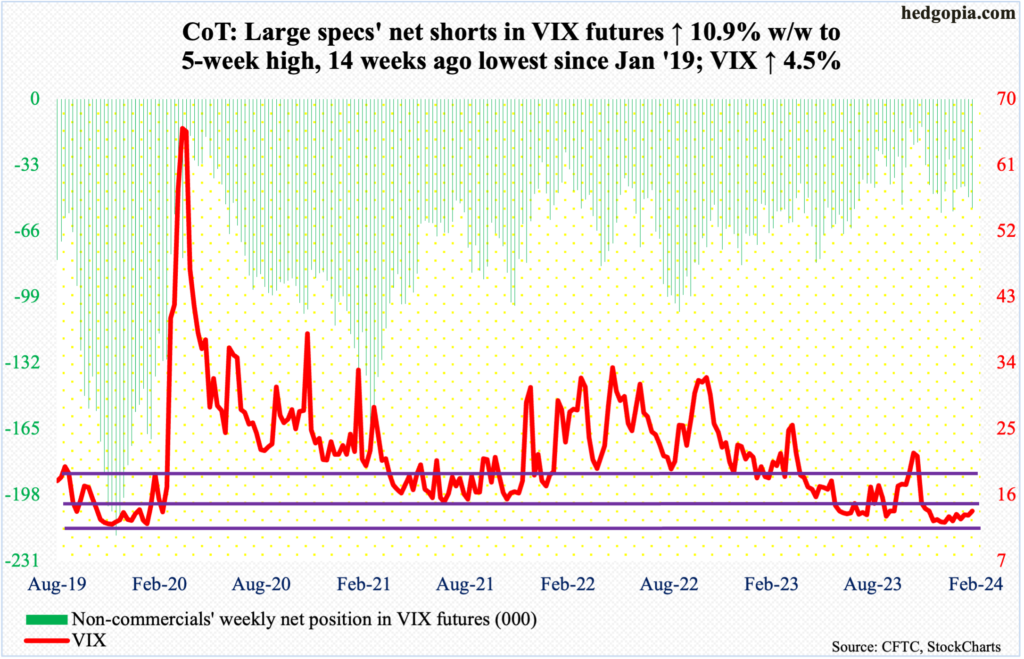
As things stand, the daily could go either way.
The streak of higher lows since December 12th when VIX tagged 11.81 intraday continued this week, with a low of 13.18 on Wednesday and a weekly close of 13.85, up 0.59 points w/w. This was the second week in the last three the volatility index has gone hand in hand with the S&P 500. This in and of itself is rare, as the two tend to go in the opposite direction.
Amidst this, the 50-day (13.07) is no longer dropping, rather flattish to ever so slightly higher, even as the 200-day (15.21) is flattish to slightly lower. Just looking at the way these averages are positioned, and considering the existing pattern of higher lows, VIX is getting ready to meaningfully firm up in the weeks ahead.
Thanks for reading!
