
Following futures positions of non-commercials are as of February 6, 2024.
10-year note: Currently net short 828.5k, down 30.6k.
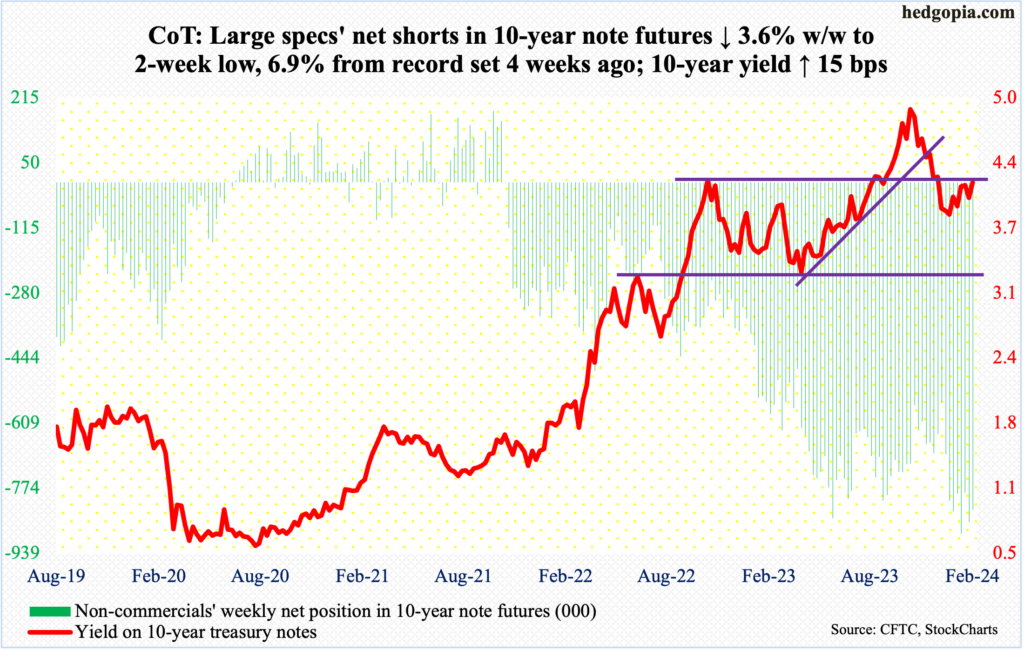
For nearly a month now, the 10-year treasury yield has struggled at 4.2 percent. This week, it rallied 15 basis points to end at 4.19 percent, giving bond bears another opportunity to break through.
On December 12th, a day before the FOMC made a now-famous dovish pivot, these notes yielded 4.21 percent, before dropping all the way to 3.79 percent by the 27th that month. On the 1st this month, yields again dropped to 3.82 percent before rallying.
Earlier, the 10-year reached five percent (4.997 percent, to be precise) on October 23rd and headed lower after rallying hard from the intraday low of 3.25 percent last April.
Non-commercials, with massive holdings of net shorts in 10-year-note futures, act as if the takeout of 4.2 percent is just a matter of time. Fingers crossed!
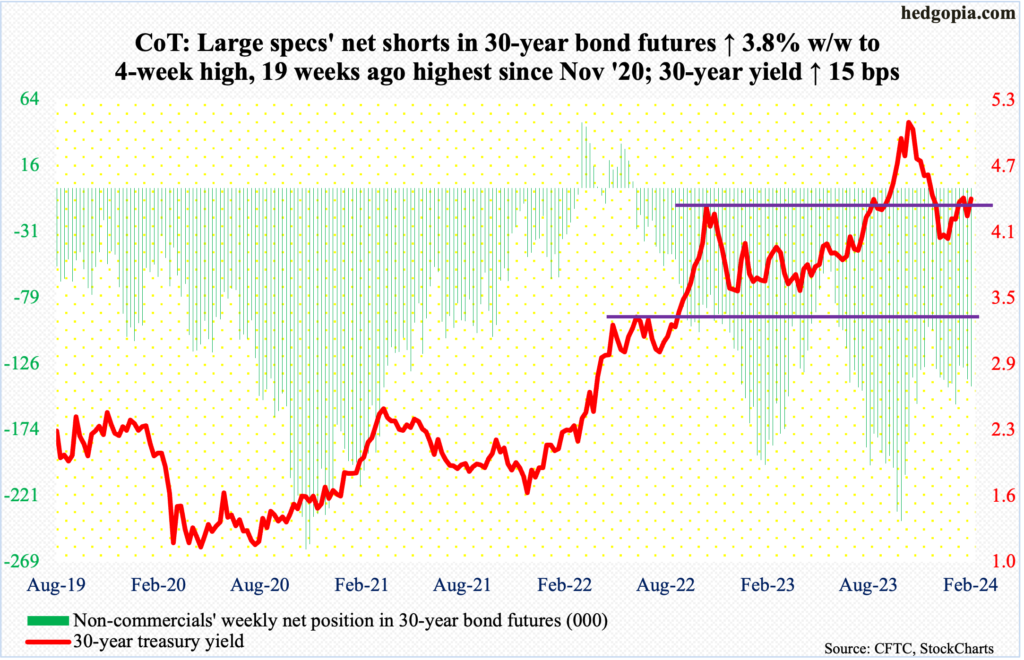
30-year bond: Currently net short 142.8k, up 5.3k.
Major US economic releases for next week are as follows.
The NFIB optimism index (January) and the consumer price index (January) are due out Tuesday.
Small-business job openings remained unchanged m/m in December at 40. The metric peaked at 51, which was hit twice – one in September 2021 and then in May 2022.
In the 12 months to December, headline and core CPI grew 3.4 percent and 3.9 percent respectively – much slower than the four-decade highs recorded in 2022 when they respectively appreciated at an annual rate of 9.1 percent (June) and 6.6 percent (September).
Retail sales (January), industrial production (January) and the NAHB housing market index (February) are scheduled for Thursday.
Retail sales grew 0.6 percent m/m in December to a seasonally adjusted annual rate of $709.9 billion – a new record.
December capacity utilization fell 0.05 percent m/m to 78.6 percent – a 27-month low. Utilization has been under pressure since reaching 80.8 percent in September 2022.
Homebuilder optimism jumped seven points m/m in January to 44, matching last September’s reading.
Friday brings housing starts (January) and the University of Michigan’s consumer sentiment index (February).
Starts decreased 4.3 percent m/m in December to 1.46 million units (SAAR) – a two-month low. Last August’s 1.31 million units was the lowest since June 2020.
In January, sentiment shot up 9.3 points m/m to 79, which is the highest since July 2021. Sentiment has come a long way from June 2022 when it hit a record low 50.
WTI crude oil: Currently net long 191.8k, down 48.2k.
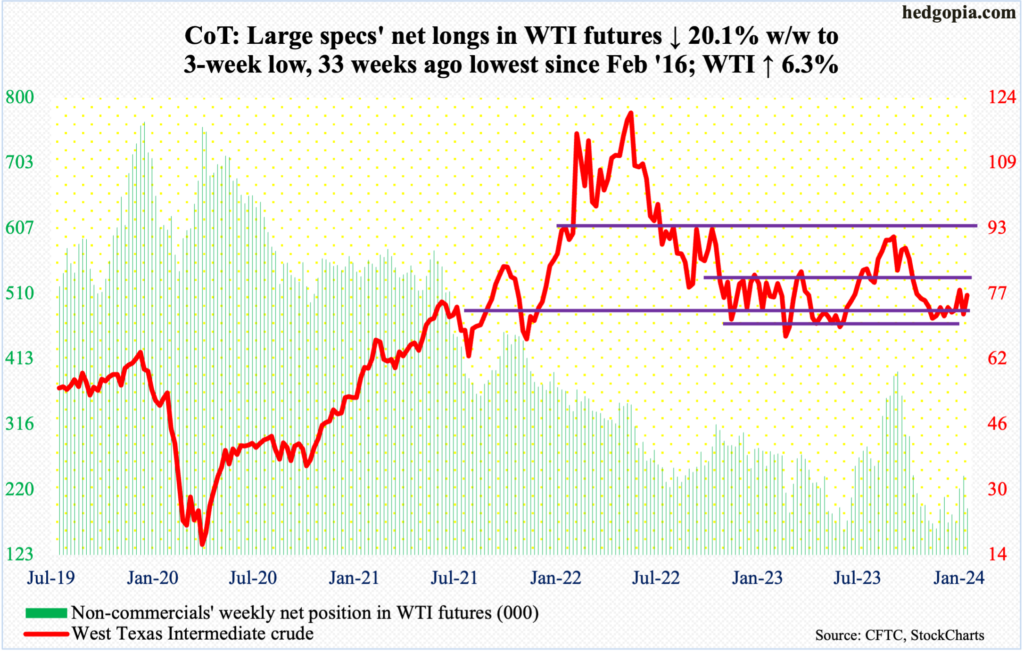
In Monday’s long-legged doji session, West Texas Intermediate crude tagged $71.41 intraday to reverse to end at $72.78, up slightly. This was a successful test of the lower bound of a 14-month range between $71-$72 and $81-$82. By Friday, the 200-day moving average ($77.34) was tested with the crude rising to $77.29 intraday and closing at $76.84, up 6.4 percent for the week.
There is room for the crude to continue higher on the daily. If the 200-day gets taken out and oil bulls manage to also reclaim 80, where the crude has struggled the past three months, the door opens up to at least the upper bound of the range.
In the meantime, as per the EIA, US crude production in the week to February 2nd increased 300,000 barrels per day week-over-week to 13.3 million b/d. This level was first hit in the week to December 15th, then a couple of more times after that in that month and in January. Crude imports increased 1.3 mb/d to 6.9 mb/d. Crude stocks also rose, up 5.5 million barrels to 427.4 million barrels. Gasoline and distillate inventory, on the other hand, declined 3.1 million barrels and 3.2 million barrels respectively to 251 million barrels and 127.6 million barrels. Refinery utilization dropped five-tenths of a percentage point to 82.4 percent.
E-mini S&P 500: Currently net short 233k, up 7k.
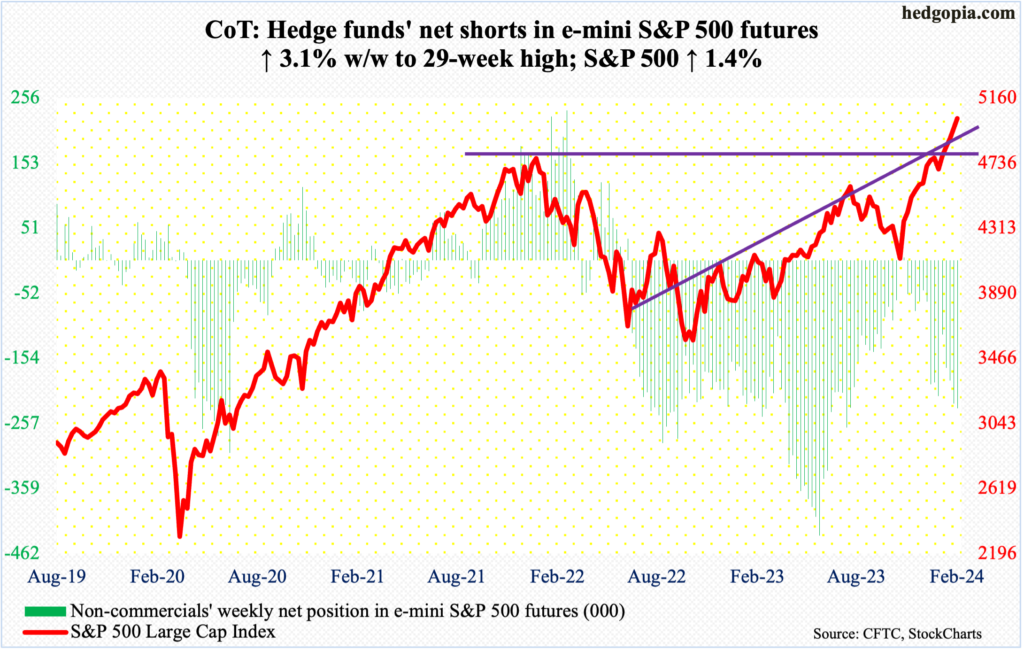
We are seven trading sessions into February, and the S&P 500 is already up 3.7 percent for the month. This follows an up 1.6 percent in January. The January barometer, which posits that ‘as goes January, so goes the year,’ bodes well this year. The maxim does have a strong record, including last year (more on this here).
That said, it also does not hurt keeping in mind the fact that the large cap index has had a phenomenal time since bottoming late October last year. From that low, it is already up 22.6 percent. It has now rallied in 14 of the last 15 weeks, with the last five in a row.
One after another metric is crying ‘overbought’. In fairness, it has been this way for a while now. Just because things are overbought does not mean a reversal has to occur right away. The weekly RSI, for instance, ended this week at 74.74; the last time this indicator was at least as extended was in December 2019-January 2020. Back then, the index peaked February 19th at 3394 and proceeded to tumble 35 percent in the next five weeks. The Covid-19 was the catalyst for the selloff back then. Yes, equities are grossly extended, but unless a catalyst for a selloff emerges, it is the bulls’ ball to lose.
Euro: Currently net long 62.2k, down 26.6k.
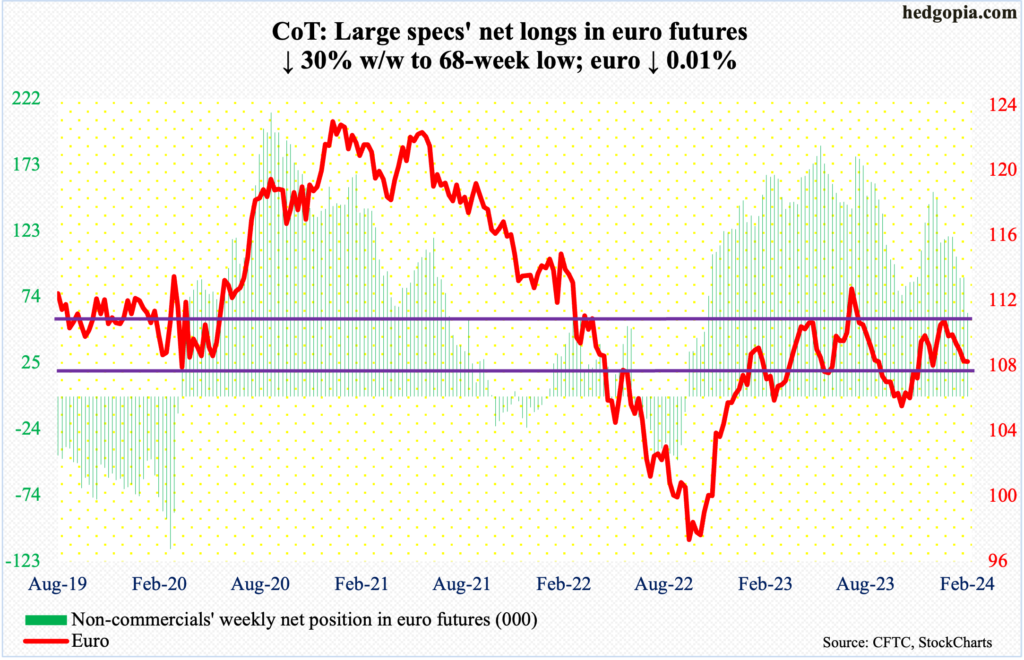
The euro traded in a tight range this week, with a high of $1.0795 on Friday and a low of $1.0741 on Tuesday, closing the week at $1.0783, down a meagre 0.05 percent. In any case, this was the fourth consecutive down week.
Since peaking at $1.1125 on December 27th, there have been six weeks, and the currency is down in five of them.
If the weekly prevails, the euro can continue lower, as the overbought condition it was in continues to get unwound. The daily is deeply oversold but has struggled. As things stand, euro bulls have an opportunity here to at least rally to the 200-day at $1.0839.
Gold: Currently net long 161.7k, up 13.9k.
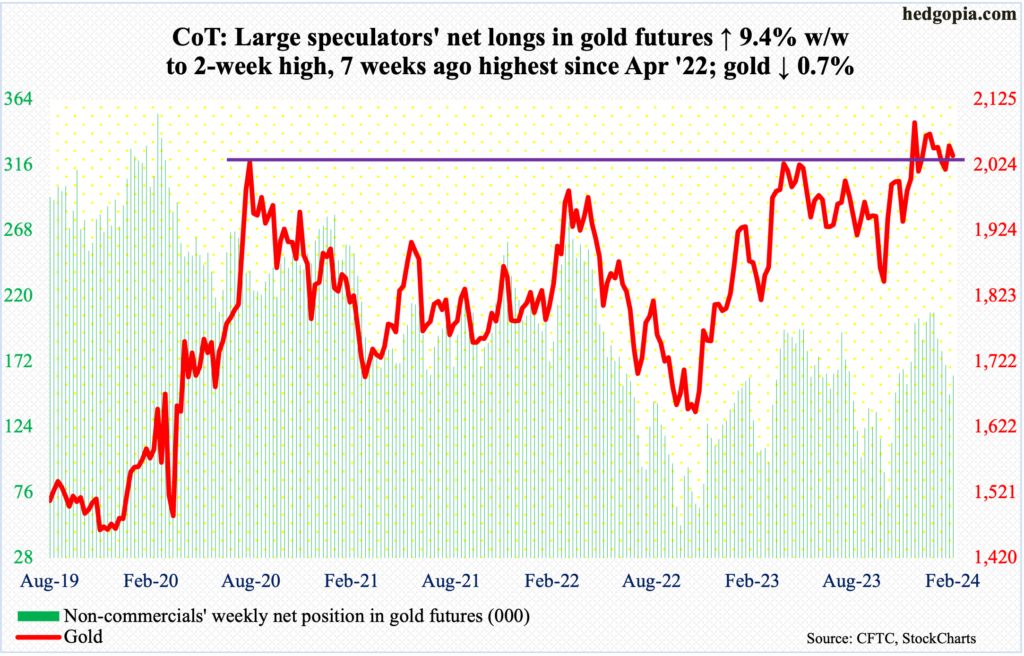
On Thursday last week, gold rallied as high as $2,083 but only to close out the week at $2,054/ounce. The metal has failed at this level several times in the past.
In August 2020, the metal posted a new all-time high of $2,089 and retreated. The reversal occurred again in March 2022 when it printed $2,079 and in May last year when $2,085 was tagged, followed by rejection in late December and early January this year. Then on December 4th last year, gold rose as high as $2,152 but reversed to close the session at $2,042.
After last week’s rejection, gold retreated this week, down 0.7 percent to $2,039. It can continue lower near term, with horizontal support just north of $2,000.
Nasdaq (mini): Currently net long 32.9k, down 6.4k.
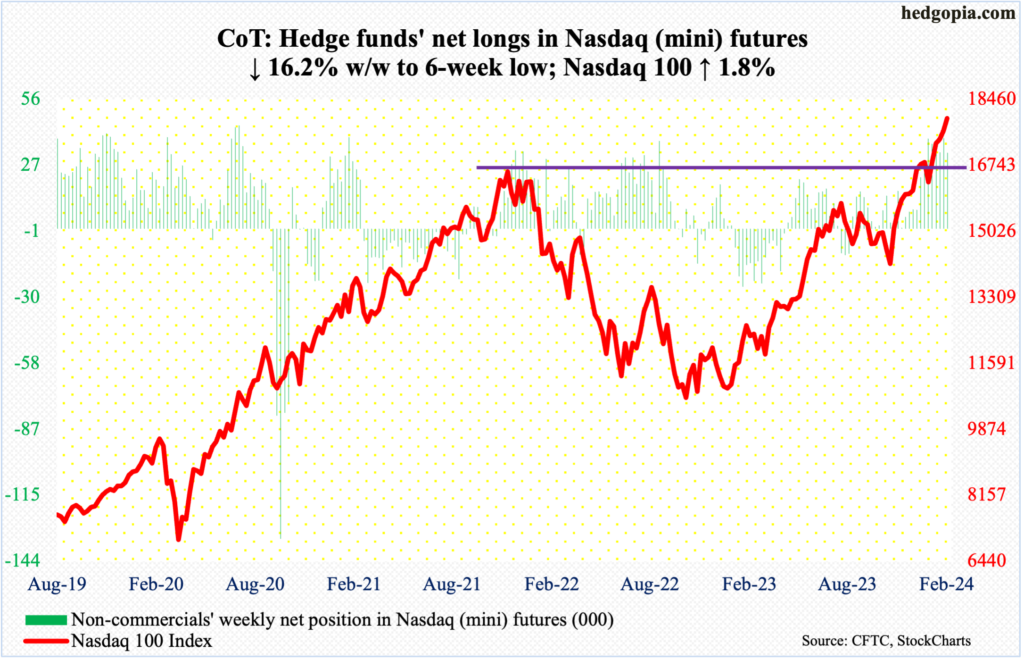
What looked like a potentially bearish hanging man last week failed to confirm. This week, the Nasdaq 100 had another strong week, up 1.8 percent to 17962, which is more than 1200 points from the prior record high of 16765 from November 2021. The prior high was surpassed on December 19th.
This week’s was a 14th up week in the last 15. Things are hot and heavy, with the weekly RSI at 74.63, which is already a level that is hard to maintain. Tech bears’ problem is that momentum has refused to break down.
Russell 2000 mini-index: Currently net short 20k, up 9.5k.
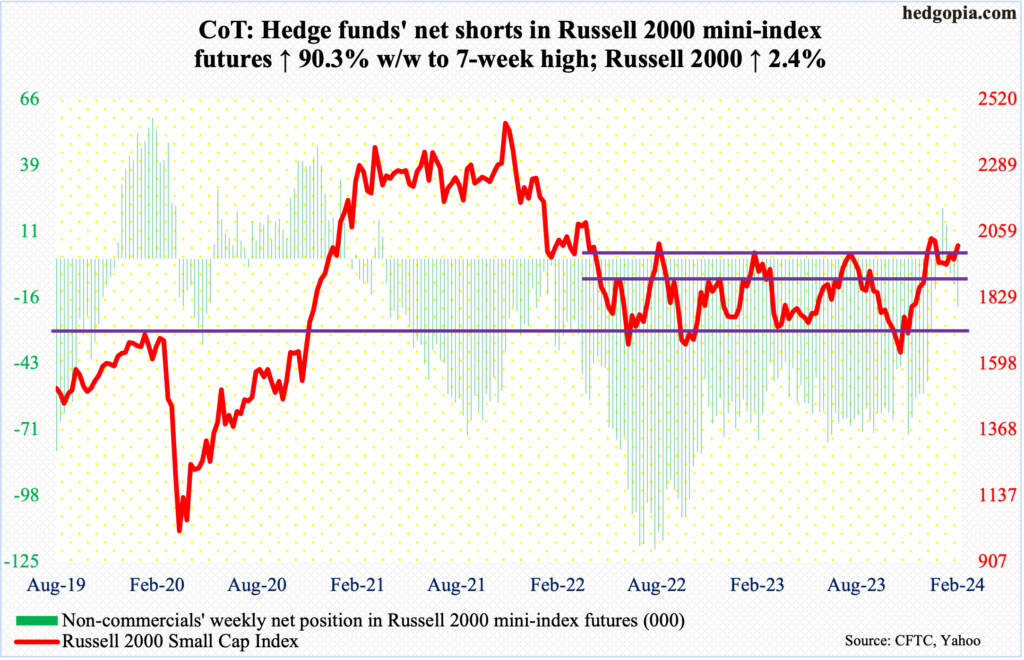
The Russell 2000 (2001) rallied 2.4 percent this week to close right at 2000, which has created problems for small-cap bulls going back to August 2022.
Earlier on December 13th, the small cap index broke out of a 200-point range between 1900 and 1700, which had been in place since January last year. A measured-move target of the breakout would amount to 2100, which was just about hit two weeks later when on December 27th it reached 2072. Near term, small-cap bulls have a shot at that high.
US Dollar Index: Currently net long 1.5k, up 1.2k.
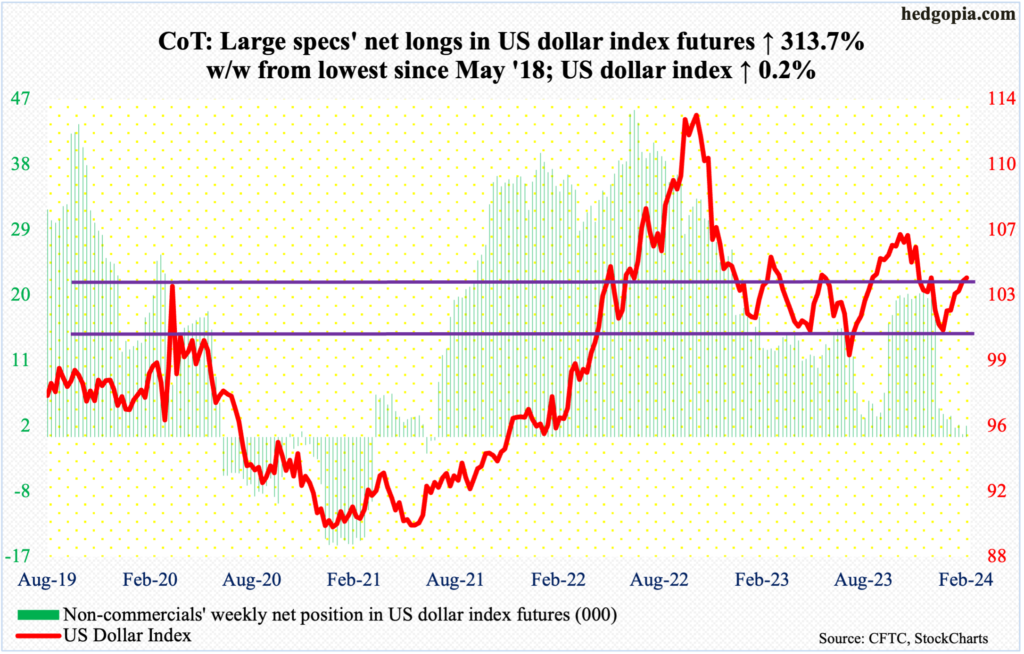
The US dollar index, up six weeks in a row after bottoming at 100.32 on December 28th, ended up 0.2 percent to 103.99, but the bulls failed to save Monday’s intraday high of 104.47. It remains above both the 200- and 50-day (respectively 103.40 and 102.80).
Earlier, the index peaked on October 3rd at 107.05 and began to really come under pressure early November. Post-Fed pivot on December 13th, it sliced through horizontal support at 103-104. It has now made a return trip to that level.
Going back all the way to 1999, 103-104 has proven to be crucial for both bulls and bears. Upward momentum will pick up steam once 103-104 gives way.
VIX: Currently net short 49k, down 5.6k.
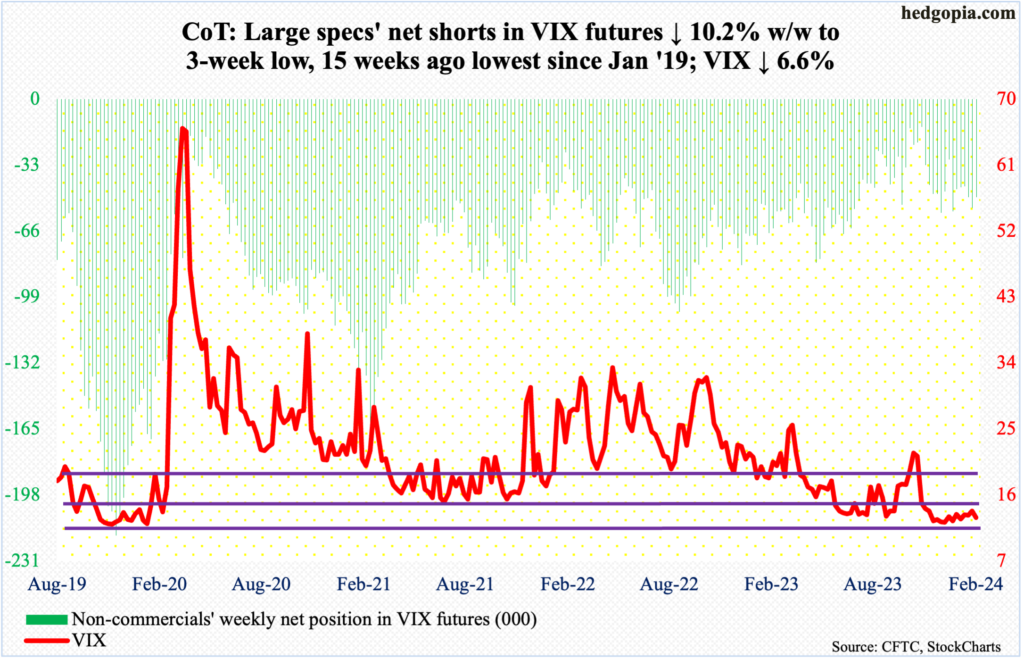
VIX gave back 0.92 points to 12.93 but maintained a streak of higher lows since December 12th when it tagged 11.81 intraday. This week’s low of 12.69 was recorded on Friday.
That said, the weekly RSI turned lower from just under the median. Near term, this can further help the volatility bears.
Thanks for reading!
