
Following futures positions of non-commercials are as of March 5, 2024.
10-year note: Currently net short 713.3k, up 47.7k.
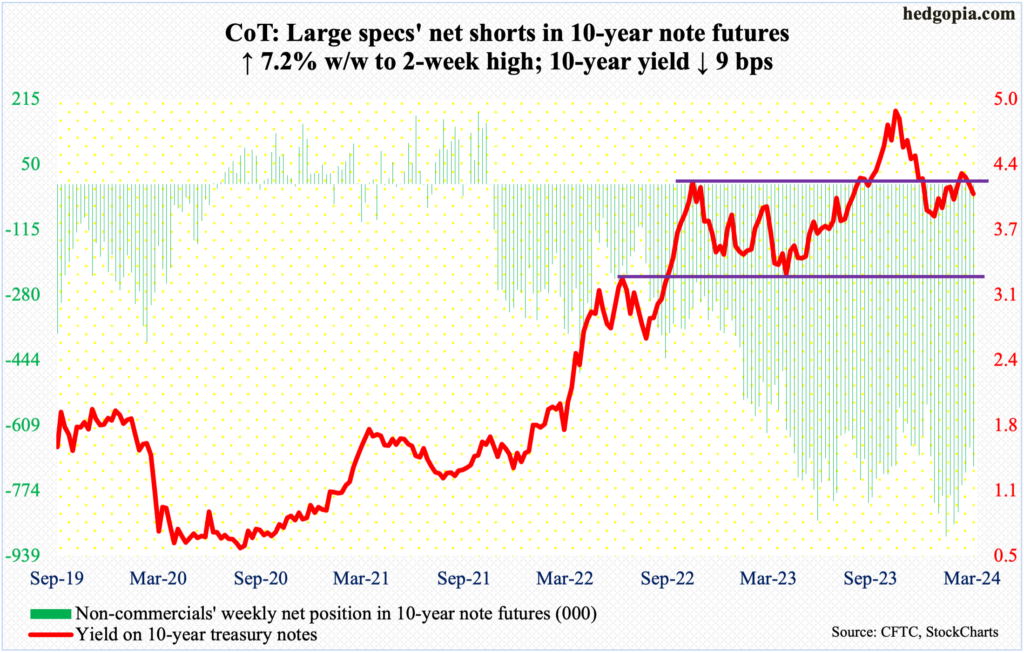
Once again, markets are demanding more versus what the Federal Reserve is willing to give. Going into this week, fed funds futures were forecasting three 25-basis-point cuts this year. At one point – until just a few weeks ago – these traders were pricing in six to seven cuts.
This Friday, post-February payrolls, which showed the economy produced better-than-expected 275,000 non-farm jobs but the prior months were revised lower, these traders raised their rates outlook to four cuts, with the first cut in June and the year ending at 425 basis points to 450 basis points.
The fed funds rate currently stands at a range of 525 basis points to 550 basis points, up from zero to 25 basis points in March 2022. The December FOMC dot plot telegraphed three cuts this year. So, after remaining way ahead of the Fed for weeks, the futures traders were finally in line with the central bank. But this changed this week. Odds favor they will once again be forced to lower expectations in the weeks ahead.
As a matter of fact, risk has risen that the March 19-20 dot plot will go back to forecasting two cuts this year – same as what the September dot plot expected.
This week, Raphael Bostic, Atlanta Fed president, said it will likely be appropriate for the Fed to approve two cuts by the end of this year. Neel Kashkari, Minneapolis Fed president, too, thinks two cuts are appropriate, or possibly just one. Bostic votes this year, Kashkari does not.
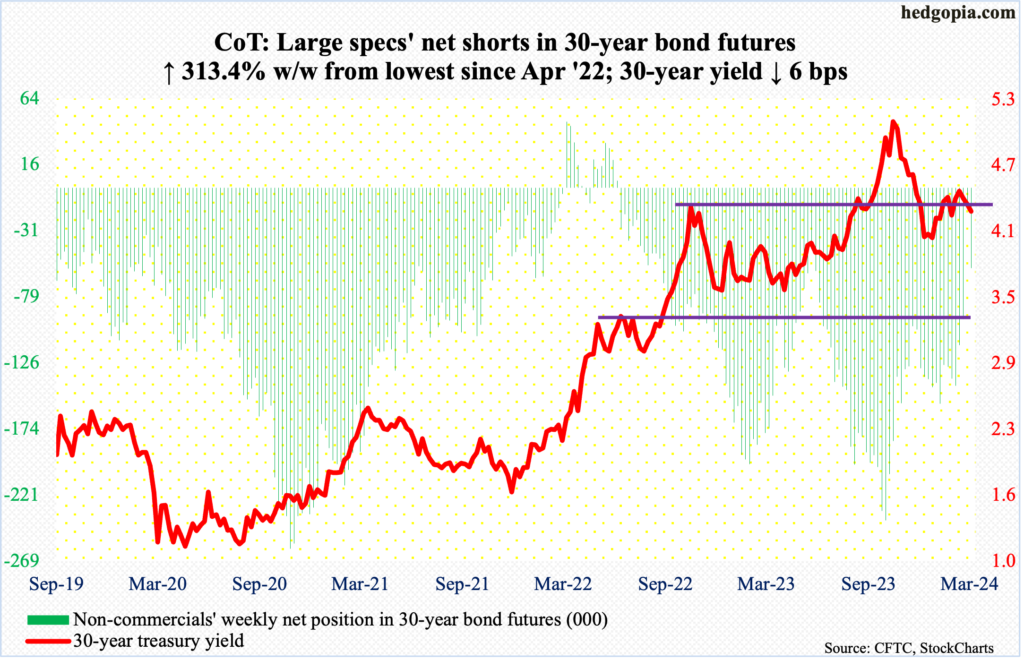
30-year bond: Currently net short 58k, up 44k.
Major US economic releases for next week are as follows.
The NFIB optimism index (February) and the consumer price index (February) are scheduled for Tuesday.
Small- business optimism declined two points month-over-month in January to 89.9 – an eight-month low. Last April’s 89 was the lowest since January 2013.
In the 12 months to January, headline and core CPI rose 3.1 percent and 3.9 percent respectively. They respectively peaked in 2022 at 9.1 percent (June) and 6.6 percent (September).
Thursday brings retail sales (February) and the producer price index (February).
Retail sales in January dropped 0.8 percent m/m to a seasonally adjusted annual rate of $700.3 billion. December’s $706.2 billion was a record.
On a 12-month basis, headline and core wholesale prices in January increased 0.9 percent and 2.6 percent, in that order.
Industrial production (February) and the University of Michigan’s consumer sentiment index (March, preliminary) are on deck for Friday.
January capacity utilization fell 0.2 percent m/m to 78.5 percent, which was the lowest since August 2021. The cycle high 80.8 percent was hit in September 2022.
Consumer sentiment dropped 2.1 points m/m in February to 76.9. January’s 79 was a 30-month high.
WTI crude oil: Currently net long 292.9k, up 18.3k.
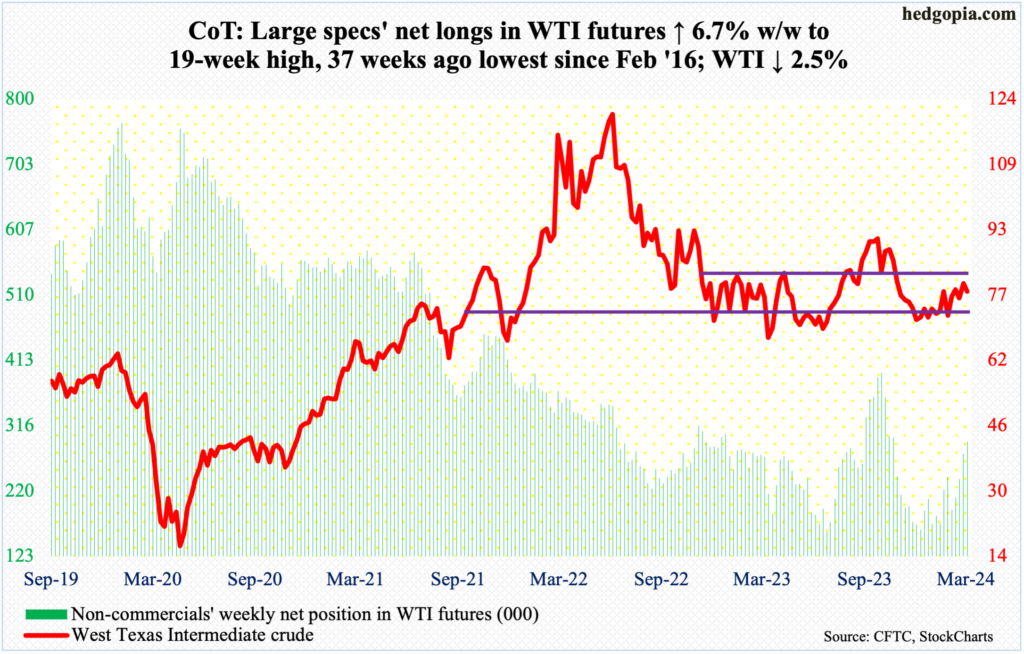
The $81-$82 resistance proved too strong for oil bulls to win over. Last week, West Texas Intermediate crude tagged $80.85, closing at $79.97. This week, it ticked $80.67 on Wednesday to end the week down 2.5 percent to $78.01/barrel.
The crude remains bound within an 18-month range between $71-$72 and $81-$82. Last week’s was the first time in over three months the top of the range was tested, and it held firm.
With this, odds have grown of continued unwinding of the overbought conditions on the daily.
In the meantime, as per the EIA, US crude production in the week to March 1st fell 100,000 barrels per day week-over-week from record 13.3 million b/d. Crude imports increased 837,000 b/d to 7.2 mb/d. As did crude inventory, which grew 1.4 million barrels to 448.5 million barrels. Stocks of gasoline and distillates, however, declined 4.5 million barrels and 4.1 million barrels respectively to 239.7 million barrels and 117 million barrels. Refinery utilization increased 3.4 percentage points to 84.9 percent.
E-mini S&P 500: Currently net short 204.4k, down 19.8k.
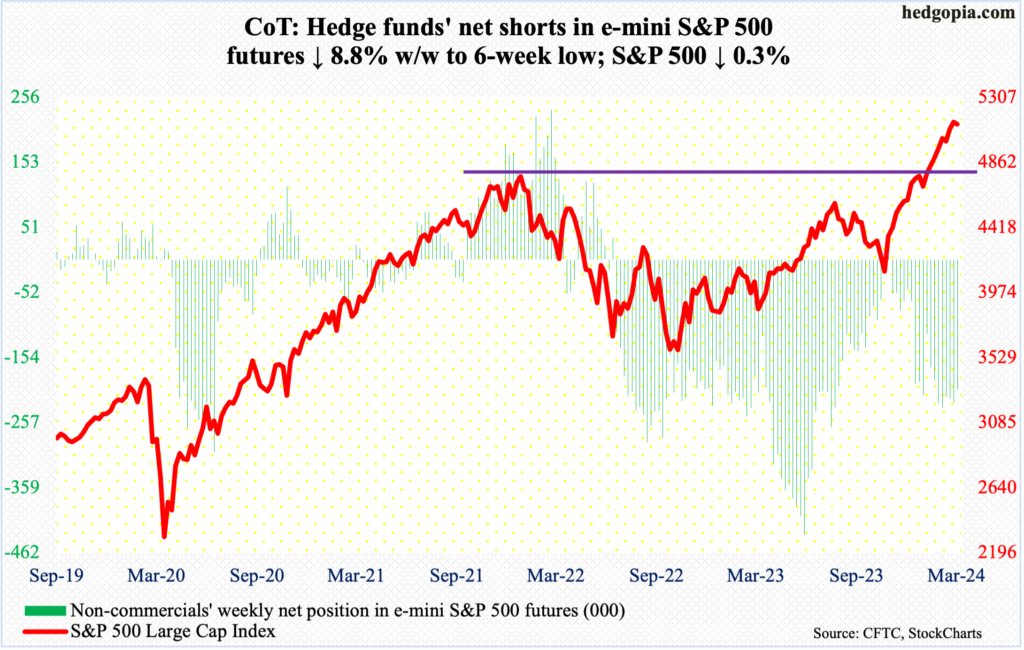
This could prove to be an important reversal. Intraday Friday, the S&P 500 was up as much as 0.6 percent but only to reverse and end the session down 0.7 percent. On the weekly, a spinning top formed, with a high of 5189 and a low of 5057, closing down 0.3 percent to 5124. This was only the third down week in 19. From last October’s low through Friday’s high, the large cap index rallied 26 percent.
If this week’s indecision candle gets confirmed, more down weeks lie ahead. Given how overbought the overall conditions are, weakness looks probable in the weeks ahead.
Nearest support lies at 5050s.
Non-commercials are staying put with their bearish bias, with net shorts just north of 200,000 contracts for six weeks in a row.
Euro: Currently net long 66.3k, up 3.5k.
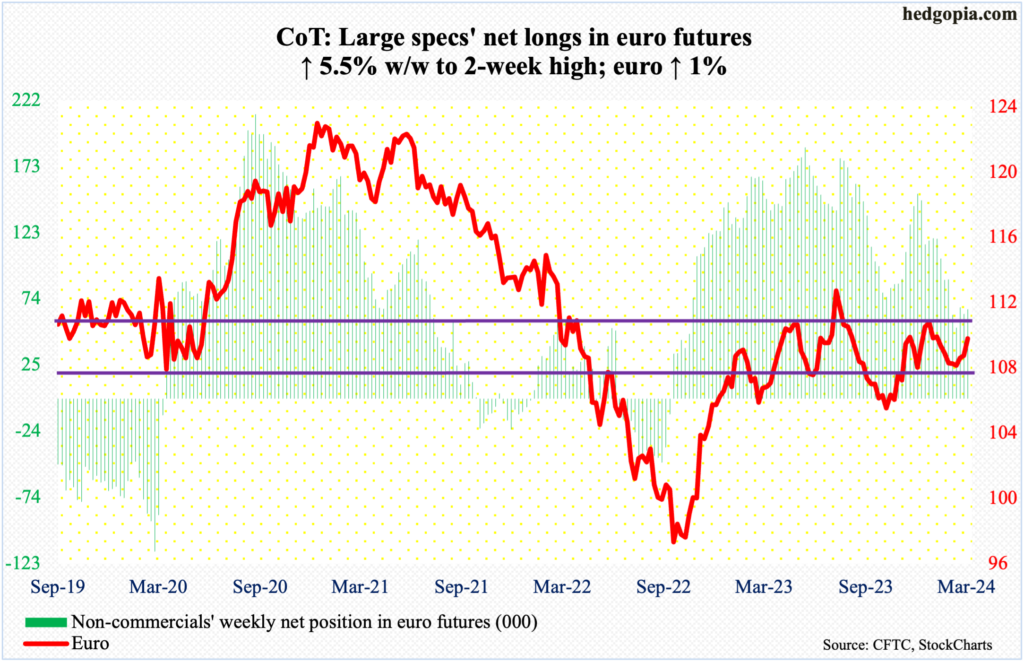
The European Central Bank indicated Thursday it was preparing for a rate cut probably in June, with a meeting scheduled for the 6th. Before that, another policy meeting is due on April 11th. So, by the June meeting, the policymakers are likely to have sufficient data to confirm the current trend of disinflation.
The euro reacted to the ECB commentary by a ton of vacillation on Thursday with a low of $1.0820 – just below the 200-day moving average at $1.0827 – and a high of $1.0949, with a close near the session high of $1.0946. Come Friday, the currency tagged $1.0981 intraday but ended the session/week at $1.0939. There is decent horizontal resistance at $1.10, which for now is likely to hold.
Medium-term, however, the path of least resistance is up.
Gold: Currently net long 191.3k, up 49.7k.
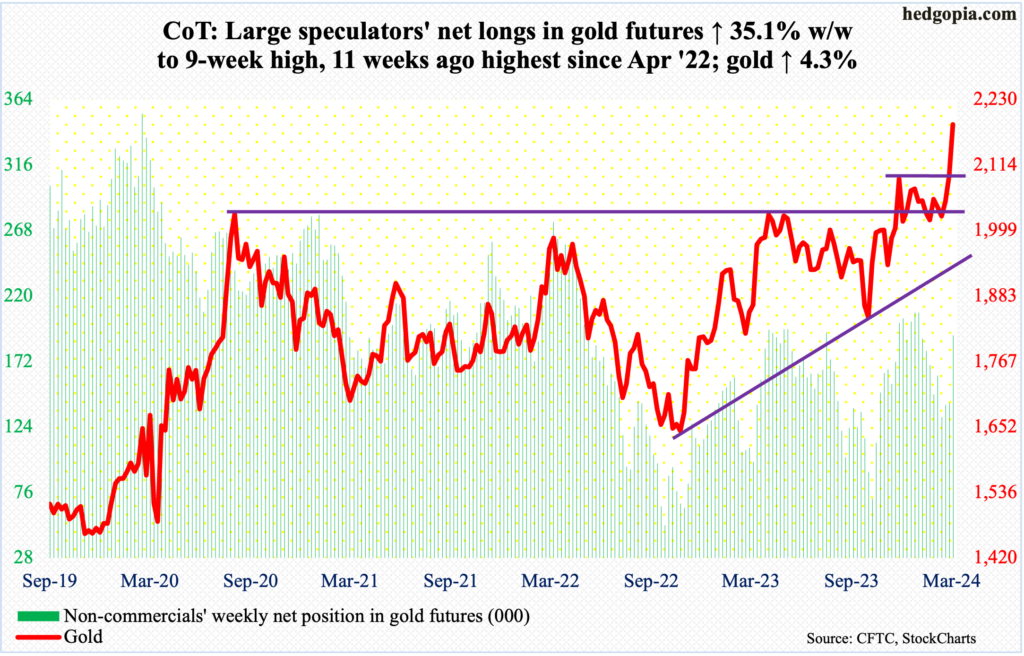
Gold bugs were able to build on last week’s action, when the metal closed at $2,096 – just above major resistance at $2,080s. This level has acted as a ceiling ever since August 2020 when gold reached $2,089 and retreated. After that, rally attempts stopped in March 2022 ($2,079), May last year ($2,085) and several times this year, not to mention last December when the metal hit a new high of $2,152.
This week, the December high was surpassed, with the yellow metal reaching $2,203 on Friday, closing at $2,186/ounce.
Gold has broken out of a long base. This is occurring at a time when equities, after massive rallies since last October’s lows, are showing signs of exhaustion.
The only thing is that gold has rallied for seven sessions in a row, with a somewhat parabolic look to it. A little backing and filling will be healthy.
Nasdaq (mini): Currently net long 635, down 9.6k.
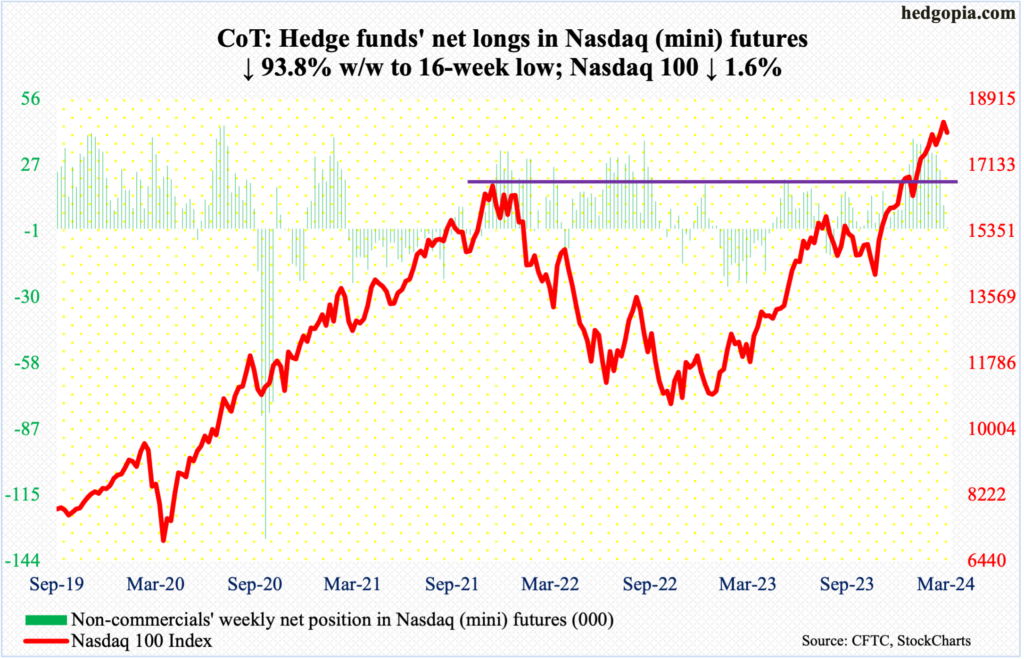
Non-commercials have been net long since mid-August last year. This week, they cut their holdings to merely 635 contracts, with a 157-week high of 39,251 contracts as of January 30th.
By intraday Friday, tech bulls were sitting pretty with the Nasdaq 100 on pace to rally 0.6 percent for the week; by the time the session closed, things looked a lot different with the index having reversed hard to close the week down 1.6 percent.
If there is any consolation for the bulls, it is that the tech-heavy index closed at 18018 – at/just above horizontal support at 18000. Prior to last week’s breakout, the index had been stopped at that level since February 9th.
That said, odds favor 18000 gets breached soon. Nvidia (NVDA), which has been a go-to stock for the bulls, reversed big on Friday, with a session high of $974 and a close of $875, forming a bearish engulfing candle and contributing to the weekly shooting star.
Russell 2000 mini-index: Currently net short 22.8k, up 4.6k.
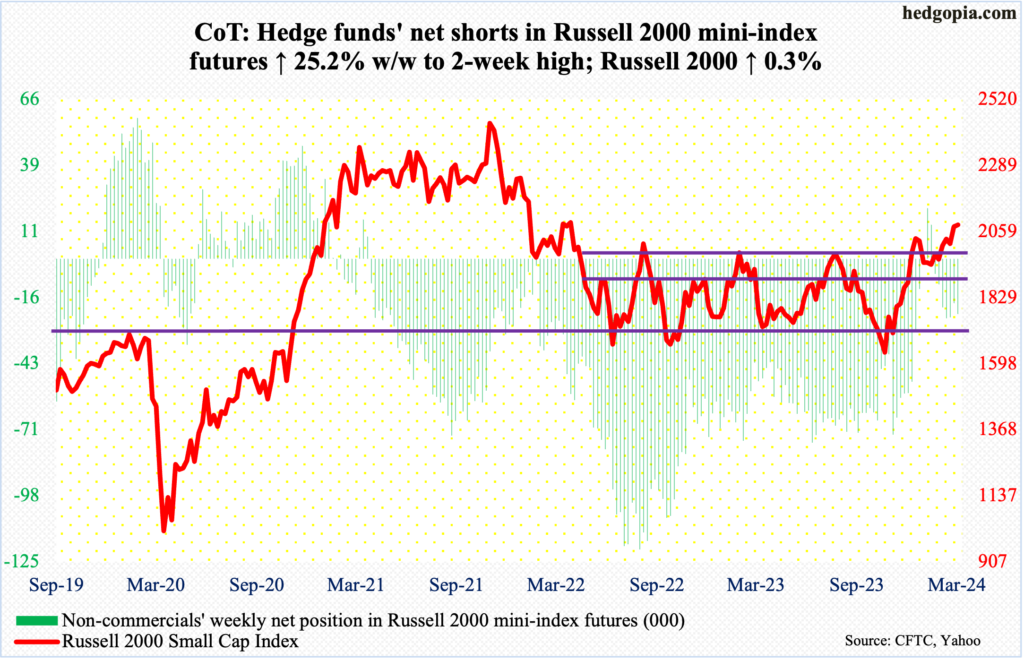
Friday’s session high of 2116 set a two-year high but this also completed a measured-move target of a 1700-1900 range breakout on December 13th. The Russell 2000 closed the week up 0.3 percent to 2079 but also formed a spinning top on the weekly.
The small cap index closed right at 2070s horizontal support. A likely breach opens the door to 2000.
US Dollar Index: Currently net long 3.1k, up 1k.
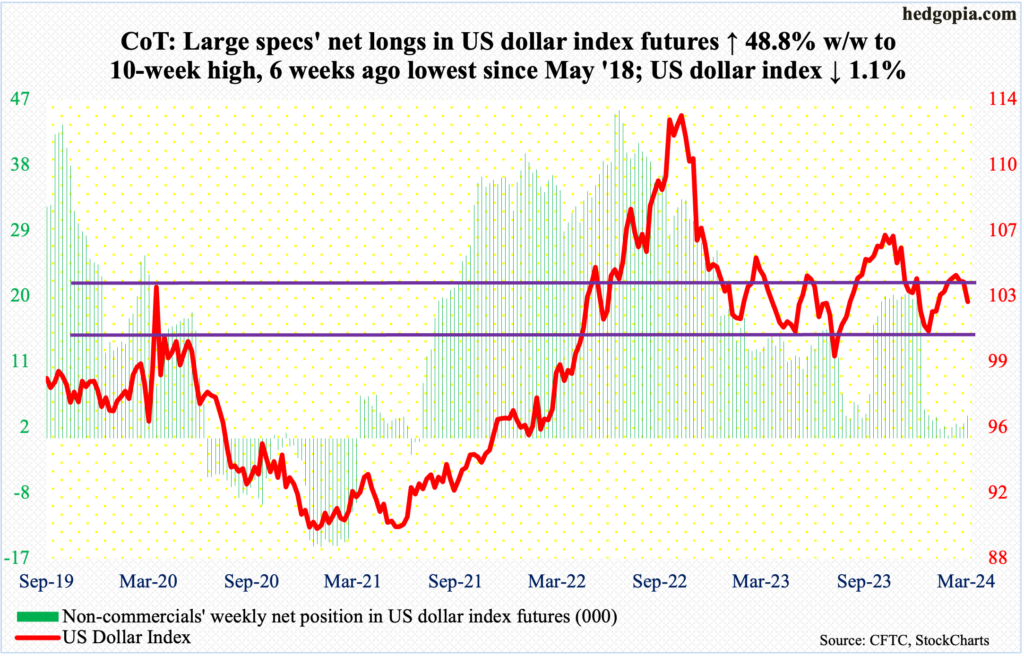
The US dollar index fell in all five sessions this week; in fact, it has now fallen for six sessions in a row. This was the third weekly loss in succession, with this week down a solid 1.1 percent to 102.69.
Prior to this, the index hit 104.88 on February 14th and retreated, having bottomed at 100.32 last December. A rising trend line from that low was breached three weeks ago.
This week’s action also represents dollar bulls’ inability to reclaim 103-104, which goes back to December 2016.
On the weekly, there is plenty of room for the index to continue lower.
VIX: Currently net short 46k, up 5.3k.
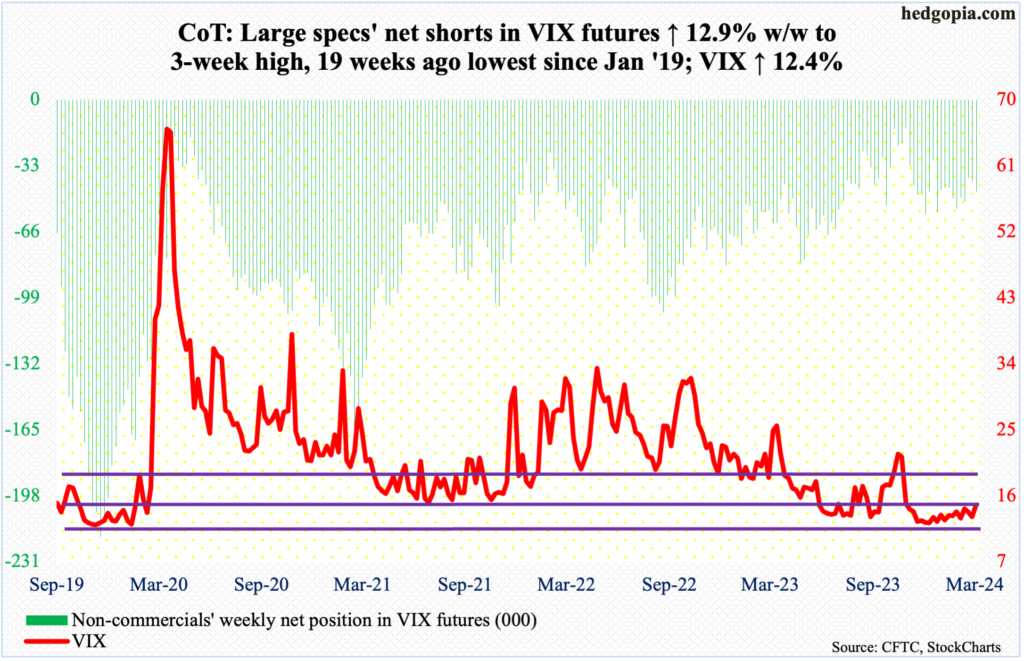
A rising trend line from December 12th when VIX bottomed at 11.81 remains intact. The 50-day is now slightly rising, with the 200-day flattish. Volatility bulls had an opportunity this week to push through horizontal resistance at 15 but could not quite pull it off, although the index rose as high as 15.53 intraday Friday but only to close at 14.74, up 1.63 points.
On the weekly, the RSI at 51.50 poked its head out of the median. This has not happened since late October when stocks bottomed. This raises the odds that the RSI continues higher in the sessions/weeks ahead. In this scenario, it is all but certain VIX will rally.
Thanks for reading!
