
Following futures positions of non-commercials are as of March 19, 2024.
10-year note: Currently net short 574k, down 29.5k.
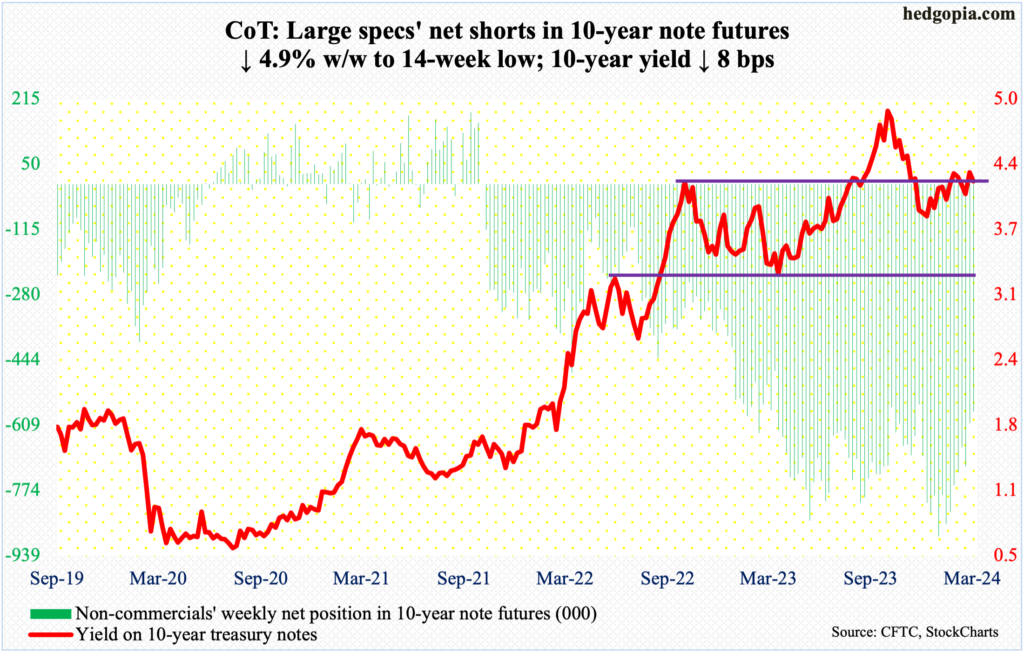
It was almost as if Jerome Powell, Federal Reserve chair, did not want equities to go lower. That is the feeling one would get witnessing how this week’s FOMC meeting evolved.
Going into the meeting, one after another economic data was coming in stronger than expected. Most prominently, both the CPI (consumer price index) and PPI (producer price index) for February printed hotter numbers.
With this as a background, markets were not sure if the FOMC dot plot would keep its December-meeting forecast of three 25-basis-point cuts this year. At the September meeting, the members were only forecasting two cuts. Markets’ obvious worry was that the dot plot would revert to the September guidance – at least.
Come Wednesday, this did not happen. The members kept their three-cut outlook, at the same time raising 2024 estimates for real GDP and inflation and lowering for the unemployment rate (more on this here).
This was a recipe for risk-on, and this is what happened. Equities rallied, raising a possibility that the prevailing frothy-looking sentiment could get frothier. Oddly, until not too long ago, Powell feared further easing of financial conditions – which is what happens when stocks rally – as that could put upward pressure on consumer spending/inflation. For now, this concern has been pushed aside. Time will tell, but this probably comes at a cost.
30-year bond: Currently net short 22.5k, down 32.1k.
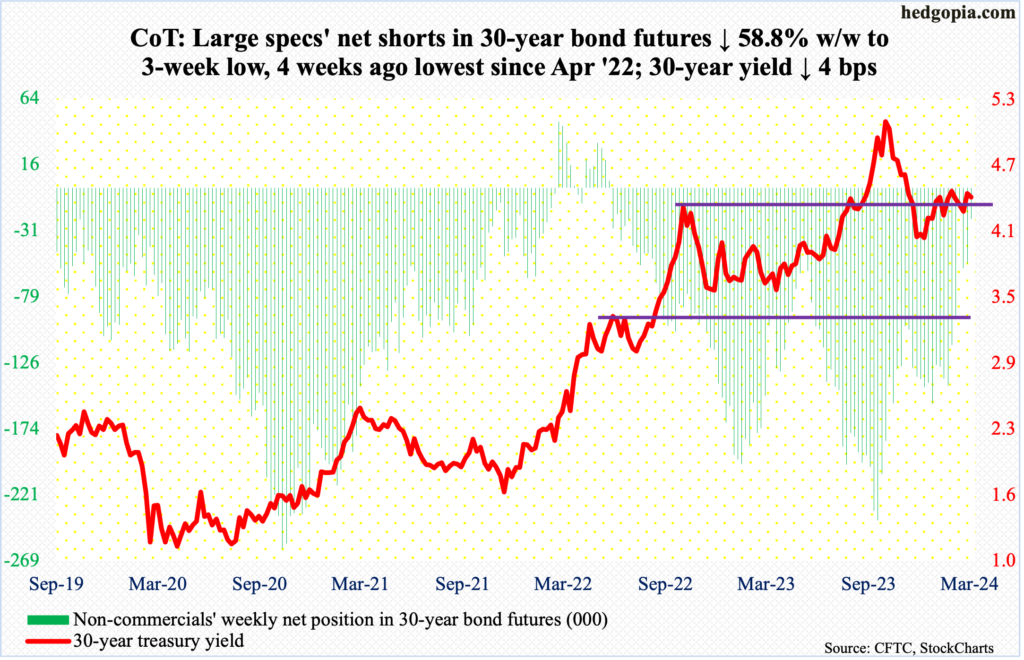
Major US economic releases for next week are as follows. Markets are closed Friday for observance of Good Friday.
New home sales (February) come out Monday. January sales were up 1.5 percent month-over-month to a seasonally adjusted annual rate of 661,000 units – a three-month high.
Durable goods orders (February) and the S&P Case-Shiller home price index (January) are due out Tuesday.
In January, orders for non-defense capital goods ex-aircraft – proxy for business capex plans – were unchanged m/m at $73.6 billion (SAAR), which is not too far away from last November’s record $74 billion.
Nationally, US home prices firmed up 5.5 percent year-over-year in December. This was a sixth consecutive month of y/y appreciation after a three-month decline from April through June of last year.
Thursday brings GDP (4Q23, 2nd revision), corporate profits (4Q23), personal income/spending (February) and University of Michigan’s consumer sentiment index (March, final).
The second estimate showed 4Q23 real GDP grew at an annual rate of 3.2 percent. After a back-to-back contraction in the first and second quarters of 2022, the economy has now grown for six quarters in a row.
In 3Q23, corporate profits adjusted for inventory valuation and capital consumption edged lower 0.6 percent to $3.28 trillion (SAAR) from last year’s record $3.3 trillion.
In the 12 months to January, headline and core PCE (personal consumption expenditures) increased 2.4 percent and 2.9 percent respectively. In 2022, the two grew at four-decade highs of 7.1 percent (June) and 5.6 percent (February), in that order.
March’s preliminary estimate showed consumer sentiment dropped four-tenths of a point m/m to 76.5. January’s 79 was the highest since July 2021.
WTI crude oil: Currently net long 337.1k, up 54.6k.
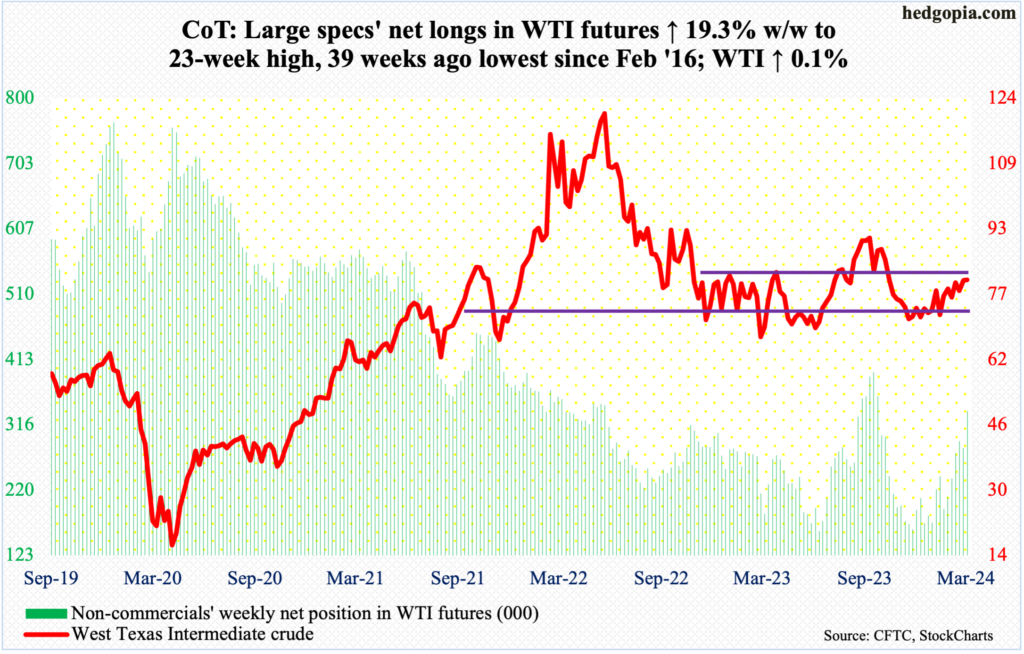
West Texas Intermediate crude formed a potentially bearish candle at crucial resistance. A weekly gravestone doji showed up this week. Tuesday, the crude tagged $83.12, which, if stuck, would have easily cleared resistance at $81-$82. For a year and a half now, WTI has played ping pong between $71-$72 and $81-$82. By Friday, the range would stay, as the crude gave back the intra-week gains to only edge up 0.1 percent to $80.63/barrel.
The path of least resistance for now is lower crude prices.
In the meantime, as per the EIA, US crude production in the week to March 15th was unchanged week-over-week at 13.1 million barrels per day; until three weeks ago, output was at a record 13.3 mb/d. Crude imports increased 787,000 b/d to 6.3 mb/d. As did stocks of distillates, which grew 624,000 barrels to 118.5 million barrels. Inventory of crude and gasoline, however, decreased two million barrels and 3.3 million barrels respectively to 445 million barrels and 230.8 million barrels. Refinery utilization increased one percentage point to 87.8 percent.
E-mini S&P 500: Currently net short 194.2k, down 45.7k.
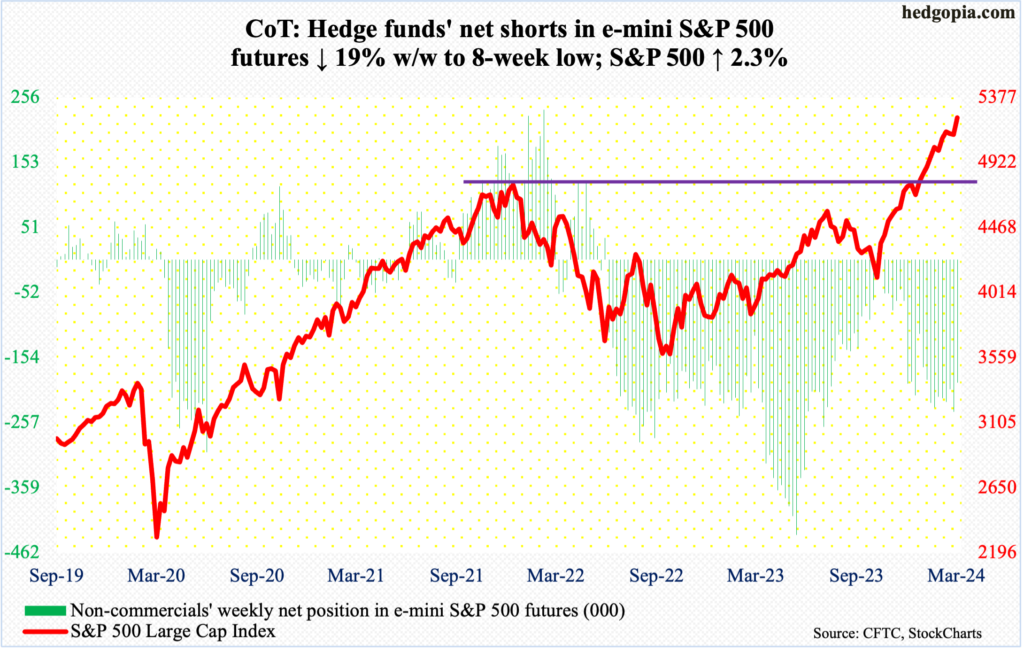
Yet again, equity bears failed to cash in on an opening the markets offered them. Leading up to this week’s FOMC meeting and after a rip-roaring rally from last October’s low, the S&P 500 suffered marginal weekly declines back-to-back, forming candles with long upper shadows (more on this here).
Undeterred, bulls this week began the first two sessions with decent gains, which got further amplified post-FOMC – on Wednesday and Thursday. For the week, the large cap index added 2.3 percent to 5234 – 17th up week in 21. From last October’s low through Thursday’s fresh high of 5261, it surged 28.2 percent!
Overbought, yes, but the upside momentum is yet to decisively break. A rising trend line from last October has been defended. For several sessions before Wednesday’s mini-breakout, bulls struggled at 5170s, which is now the one to watch if it holds.
Euro: Currently net long 48.3k, down 26.1k.
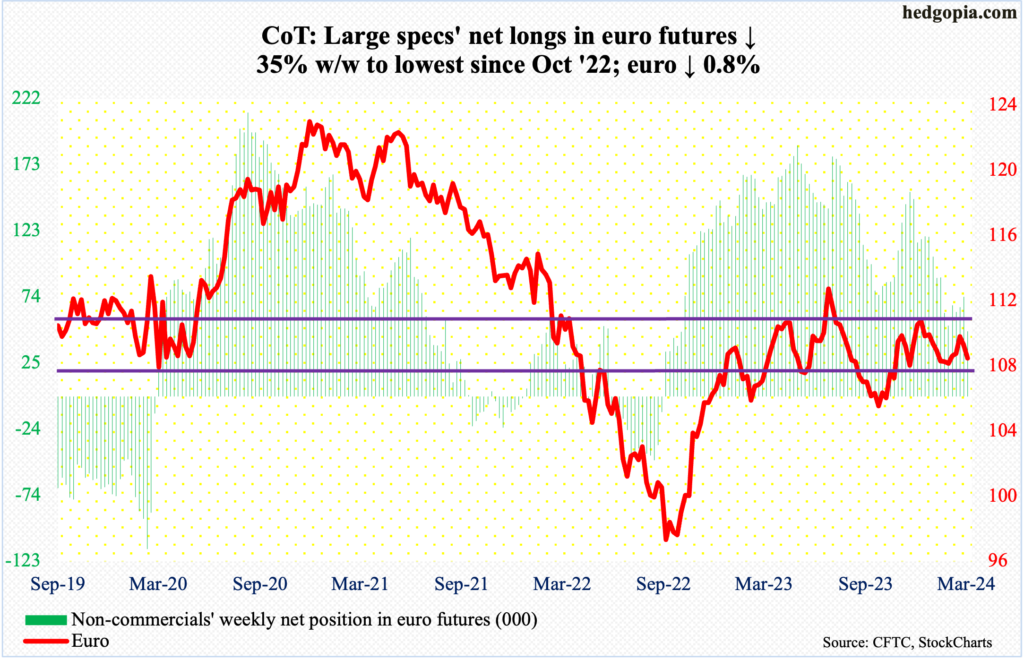
The euro suffered its back-to-back down week. It has trended lower since ticking $1.0981 on March 8th. There is decent horizontal resistance at $1.10.
This week’s high of $1.0923 was posted on Wednesday, a session in which the currency bounced off the 50- and 200-day ($1.0843 and $1.0835 respectively). By Friday, both averages were breached, with the euro dropping 0.8 percent this week to $1.0807.
The February 13th low of $1.0701 has gained in significance.
Gold: Currently net long 201.6k, unchanged.
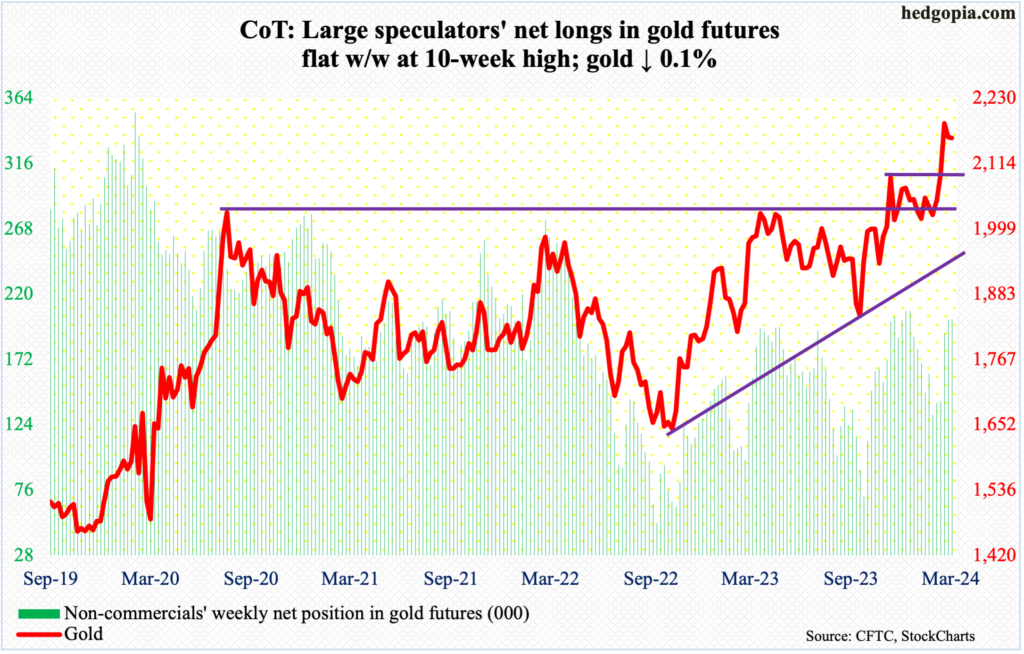
Gold was down 0.1 percent to $2,160/ounce, but that belies the intra-week volatility. Intraday Thursday, the metal rallied as high as $2,225 to surpass the March 8th high of $2,203, but only to reverse to close at $2,185, forming a spinning top. For the week, a gravestone doji developed.
Thus far, gold bugs have defended $2,150s, which was the high from early December. Odds favor this support gives way in the sessions ahead. In an ideal scenario for the bulls, gold then heads toward $2,080s for a successful breakout retest, laying the foundation for the next leg higher.
Since August 2020, when $2,080s was hit the first time, rally attempts stopped at that price point several more times, including in March 2022 ($2,079), May last year ($2,085) and a few more times this year. The 50-day at $2,075 is rising toward that level.
The yellow metal has come a long way from last October when it bottomed at $1,824 and is itching to unwind the overbought condition it is in.
Nasdaq (mini): Currently net long 11.2k, up 9.8k.
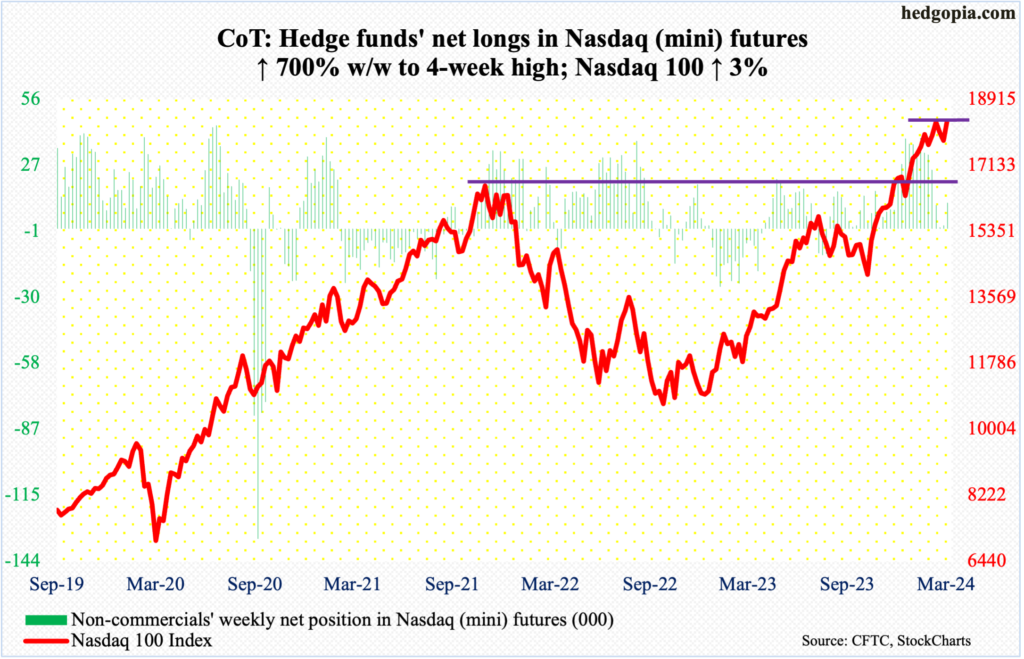
The Nasdaq 100 jumped three percent to 18339 this week, rallying back above a rising trend line from last October’s low, albeit only marginally. Last week, the trendline was slightly breached.
That said, the tech-heavy index has essentially gone sideways this month, having printed 18333 on the 1st. A new intraday high of 18465 was reached on Thursday but the session acted tentative, to say the least.
At 17719 lies the 50-day, coinciding with the daily lower Bollinger band at 17758. This is a must-save for the bulls.
Russell 2000 mini-index: Currently net short 13.5k, down 5.6k.
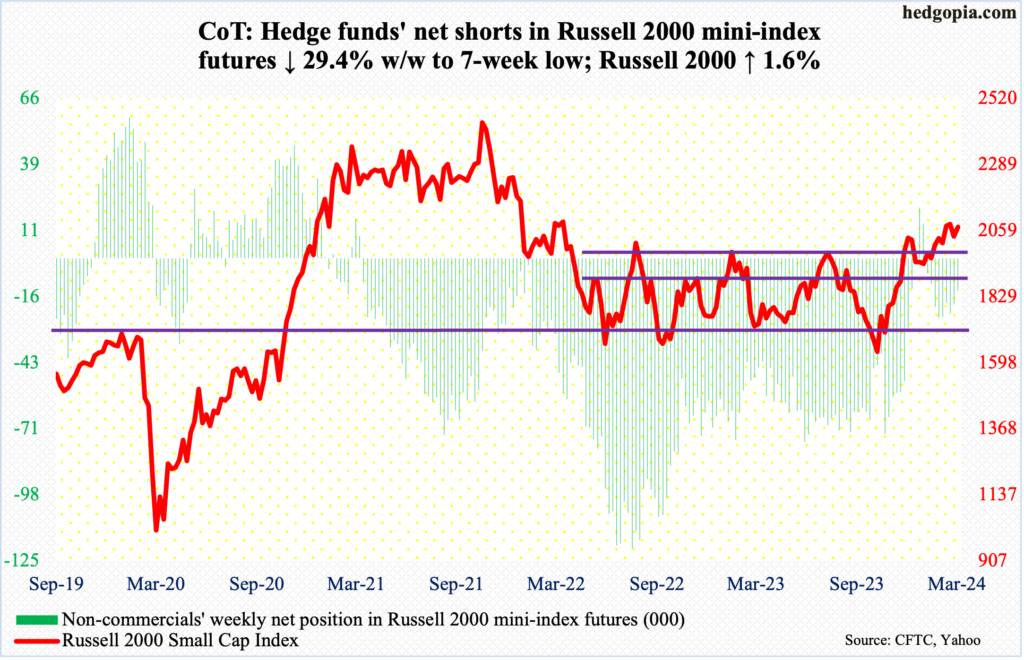
It was one of those weeks! The Russell 2000 had something to offer for both bulls and bears. The small cap index rallied 1.6 percent to 2072 but also got rejected – once again – at 2100.
On the 8th, a two-year high of 2116 completed a measured-move target of a 1700-1900 range breakout on December 13th. To boot, horizontal resistance at 2100 goes back to January 2021. This ceiling was tested again this week, with Thursday tagging 2106 and retreating.
For small-cap bulls’ consolation, 2000 continued to attract bids, as the index touched 2010 on Tuesday. Until this 100-point back-and-forth resolves one way or the other, range traders will have a field day. A likely breach ahead opens the door toward a breakout retest at 1900.
US Dollar Index: Currently net long 679, down 5.5k.
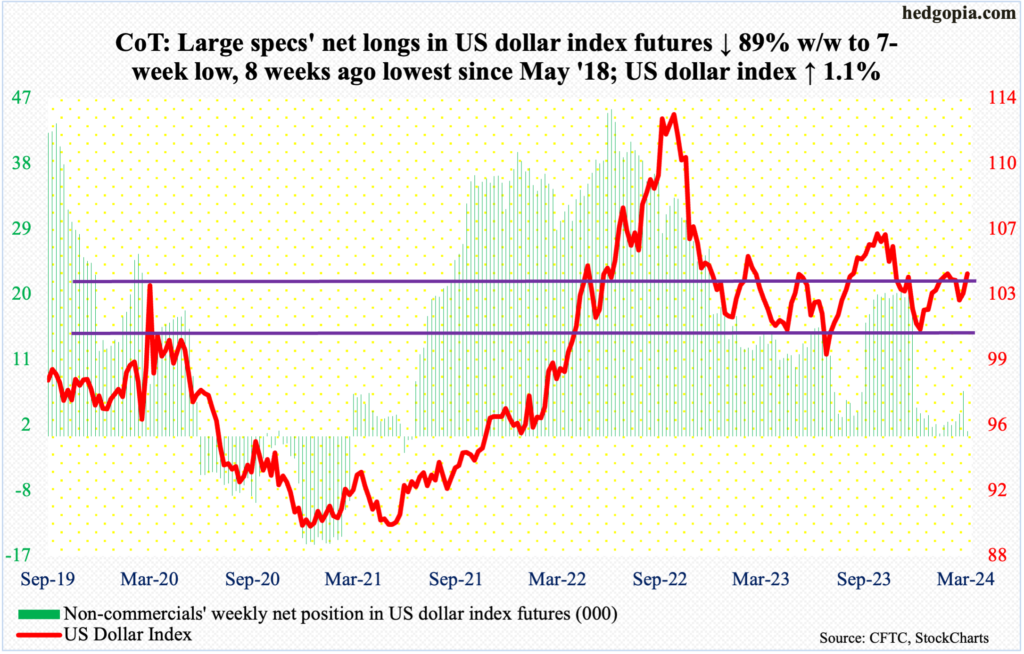
A golden cross, in which the 50-day crosses the 200-day from below, formed this week. If the pattern lives up to its expectations, better days lie ahead for the dollar.
The US Dollar Index this week jumped 1.1 percent to 104.18. Resistance at 103-104 goes back to December 2016.
For now, dollar bulls are probably eyeing the February 14th high of 104.88. Momentum is with them. Since defending lateral support at 1.0230s on the 8th, the index has rallied in eight of 10 sessions.
VIX: Currently net short 44.8k, down 4.3k.
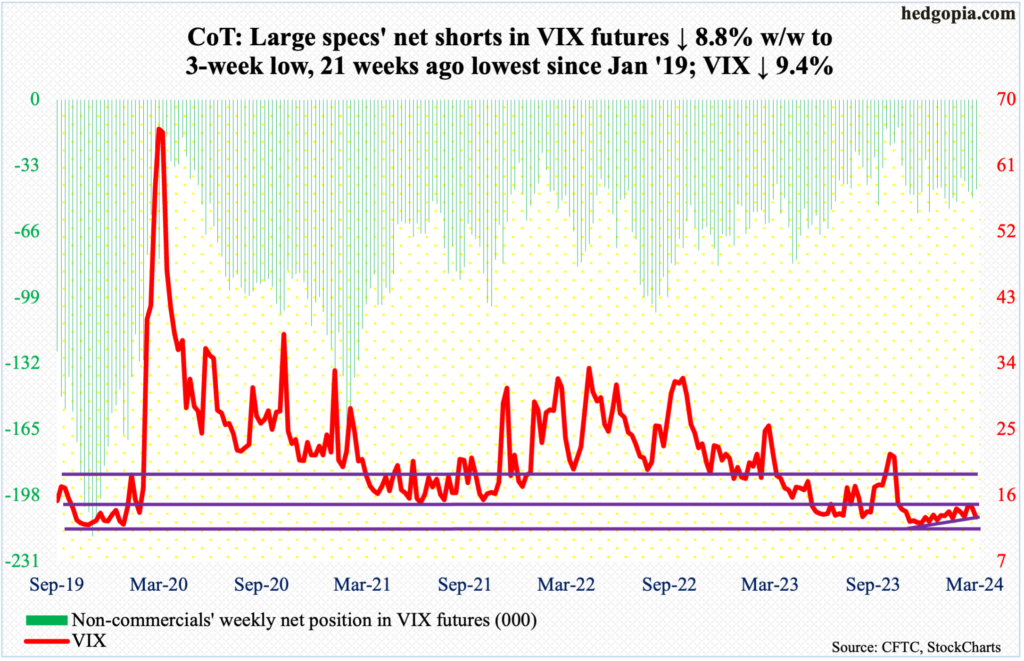
Rather ominously for volatility bulls, a rising trend line from December 12th when VIX bottomed at 11.81 was compromised this week. Concurrently, on both Thursday and Friday, the volatility index produced potentially bullish hammers, which showed up right at/just underneath the daily lower Bollinger band. Thursday’s intraday low of 12.40 was the lowest since early January.
These are mixed signals. As things stand, it is hard to imagine VIX persisting lower. Last December, the index touched 11.80s for three sessions in a row before gradually trending higher.
Thanks for reading!
