
Following futures positions of non-commercials are as of Feb 3, 2026.
10-year note: Currently net short 729.4k, up 3.3k.
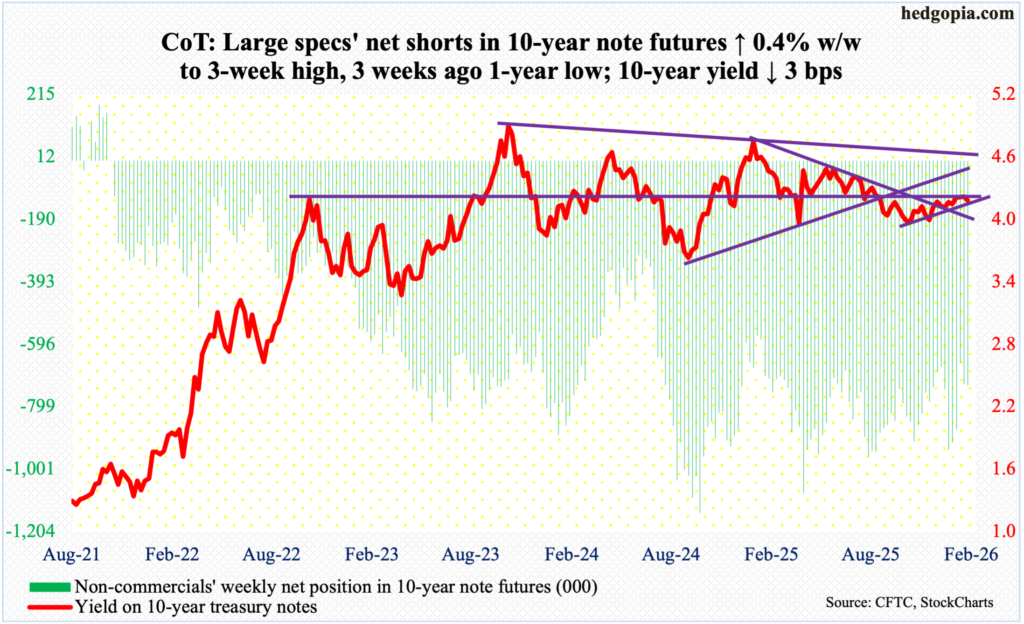
There is a lot of talk around the nominee to replace Chair Jerome Powell regarding the balance sheet of the Federal Reserve. Powell retires in May and has the option of serving out the remaining two years on his governor’s term. Kevin Warsh – the nominee – served as governor between February 2006 and March 2011 and was not a big fan of continued quantitative easing during the financial crisis. Hence the current confusion as to if Warsh will continue his hawkish stance as Fed chair or will be a changed man as he will be operating under different conditions.
Powell came under persistent pressure to lower the rates from President Donald Trump. Since last September, the fed funds rate has been reduced by 75 basis points – in three 25-basis-point increments – and by 175 basis points since September 2024. Trump wants lower rates not only on the short end but also on the long end of the yield curve. The Fed controls the short rates, while long rates, such as the 10-year treasury yield, are priced in the bond market. That said, the central bank can – and does – influence the long end with the help of its balance sheet.
Prior to the financial crisis, its balance sheet was under $1 trillion, which, after three iterations of QE, swelled to $4.5 trillion by January 2015. Post-Covid, it once again went parabolic, as the Fed began another round of QE, and by May 2022 crested at $8.9 trillion. The subsequent quantitative tightening put the brakes on the expansion of the balance sheet, which bottomed at $6.5 trillion last December.
On 10 December, the FOMC (Federal Open Market Committee) decided to expand its balance sheet again to maintain ample reserves. This is aimed at avoiding stress in money markets. As of Wednesday, the balance sheet stood at $6.6 trillion. The current expansion is different from the traditional QE in that the Fed is only buying short-term treasury bills. Previously, large quantities of long-term notes and bonds were purchased, and that helped push rates lower on the long end. Hence the significance of which way Warsh will lean in his new responsibility. This will have repercussions for not only the economy but also several assets including equities.
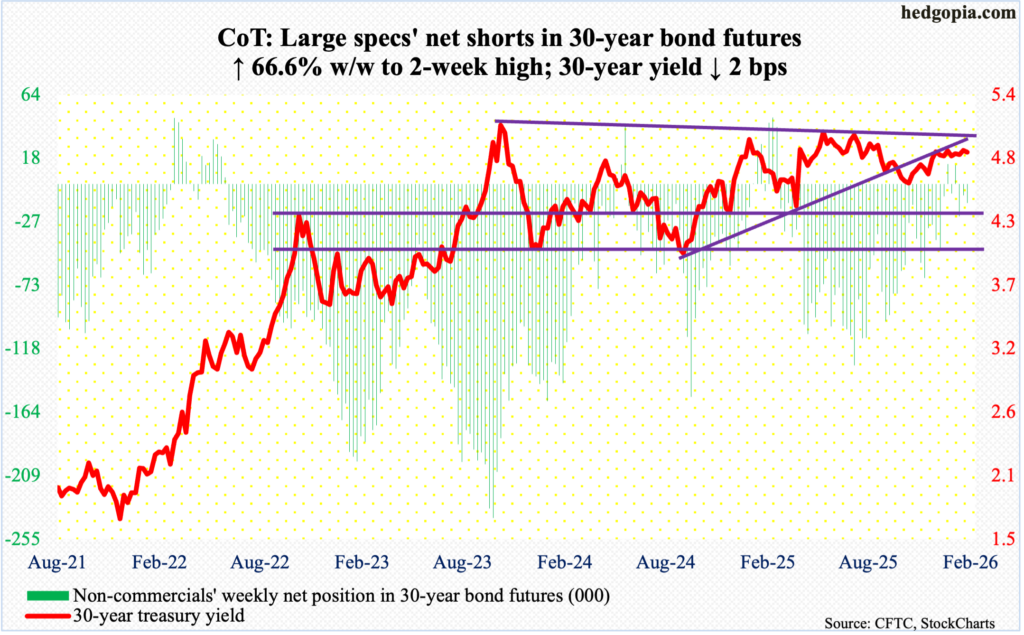
30-year bond: Currently net short 13.6k, up 5.4k.
Major US economic releases for next week are as follows.
The NFIB optimism index (January), retail sales (December) and the employment cost index (4Q25) is on tap for Tuesday.
Small-business optimism in December edged up five-tenths of a point month-over-month to 99.5 – a four-month high.
November retail sales grew 0.6 percent m/m to a seasonally adjusted annual rate of $735.9 billion – a fresh record.
In 3Q25, private-industry total comp increased 3.6 percent from a year ago, setting a three-quarter high.
Payrolls (January) are due out Wednesday. The economy only created 50,000 non-farm jobs in December. For all of 2025, an average 49,000 was added each month – puny compared to a monthly average of 168,000 in 2024, 216,000 in 2023 and 380,000 in 2023.
Existing home sales (January) are scheduled for Thursday. Sales jumped 5.1 percent m/m in December to 4.35 million units (SAAR). This was the highest since February 2023.
Friday brings the consumer price index (January). In the 12 months to December, headline and core CPI rose 2.68 percent and 2.64 percent respectively. Core’s 2.63-percent pace in November was the lowest since March 2021, while headline’s 2.31 percent last April was the lowest since February 2021.
WTI crude oil: Currently net long 202.4k, up 36k.
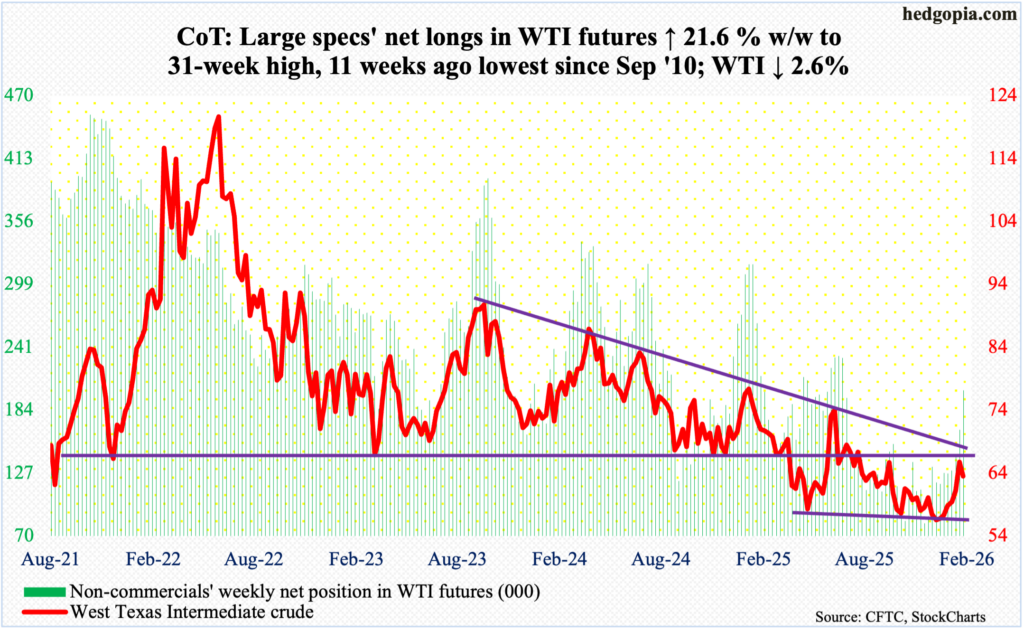
Last week, West Texas Intermediate crude shot up 7.7 percent to test dual resistance. This week, after six up weeks, it dropped 2.6 percent to $63.50/barrel.
On 16 December, the crude undercut horizontal support just north of $56 by tagging $54.98 but soon stabilized; this was the lowest price point since February 2021. Going back to at least last April, $56 consistently drew bids. This was again the case. The rally that followed brought the crude just underneath a falling trendline from March 2022 when it peaked at $126.42 intraday. Right around there – $65-$66 – lies horizontal resistance going back many years. With the daily extended, oil bulls seem to have run out of fuel to push up the price further.
Friday’s low ($62.20) found support at the 200-day, but the average remains vulnerable. The 50-day lies at $59.41; just underneath rests important lateral support.
In the meantime, as per the EIA, US crude production in the week to January 30th decreased 481,000 barrels per day week-over-week to 13.215 million b/d, which was the lowest since November 2024; output registered a record 13.862 mb/d in the week to November 7 last year. Crude imports increased 559,000 b/d to 6.2 mb/d. As did gasoline inventory, which grew 685,000 barrels to 257.9 million barrels. Stocks of crude and distillates dropped – respectively down 3.5 million barrels and 5.6 million barrels to 420.3 million barrels and 127.4 million barrels. Refinery utilization decreased four-tenths of a percentage point to 90.5 percent.
E-mini S&P 500: Currently net short 132.9k, up 33.2k.
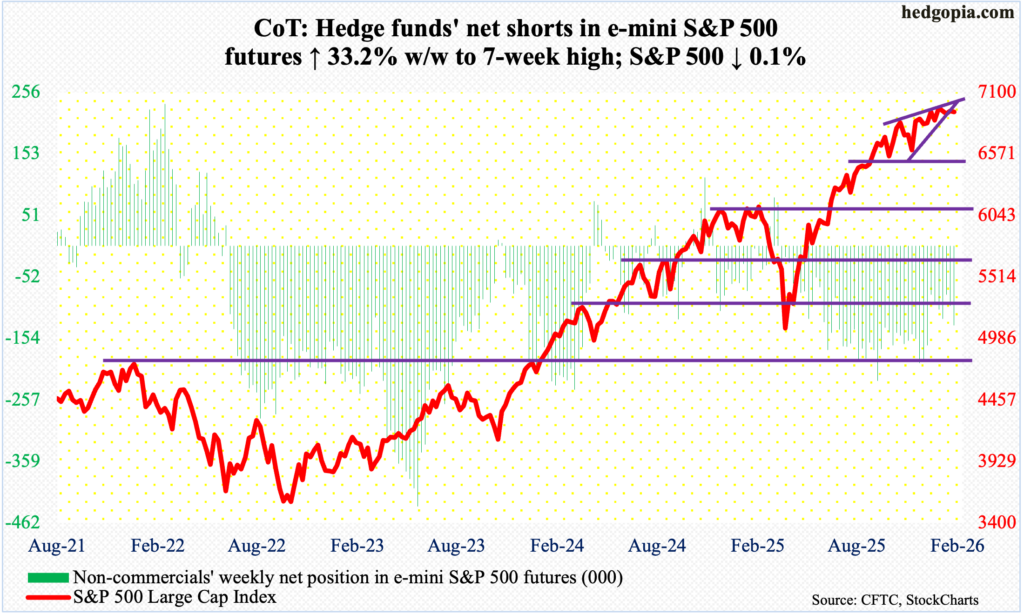
In a volatile week, with a high of 6993 and a low of 6780, the S&P 500 managed to only edge lower 0.1 percent to 6932. At Thursday’s low, it was down 2.2 percent, but Friday’s two-percent jump wrested the ball away from the bearish camp. Bulls still have work to do.
The large cap index has essentially straddled the 6920s since late October, even though it ticked a fresh all-time high of 7002 on 28 January. The sideways move followed a massive rally from last April when the index bottomed at 4835.
The ongoing bull-bear duel is very well reflected in the candles that are showing up on the weekly, with three spinning tops over the last four weeks. Further, on the monthly, January’s spinning top followed December’s spinning top and November’s hanging man. The S&P 500 is also caught in a rising wedge, which often breaks to the downside. Bulls have their work cut out, as they have been treading water for over three months, using up buying power merely to stop the bears from gaining ground.
Euro: Currently net long 163.4k, up 31.2k.
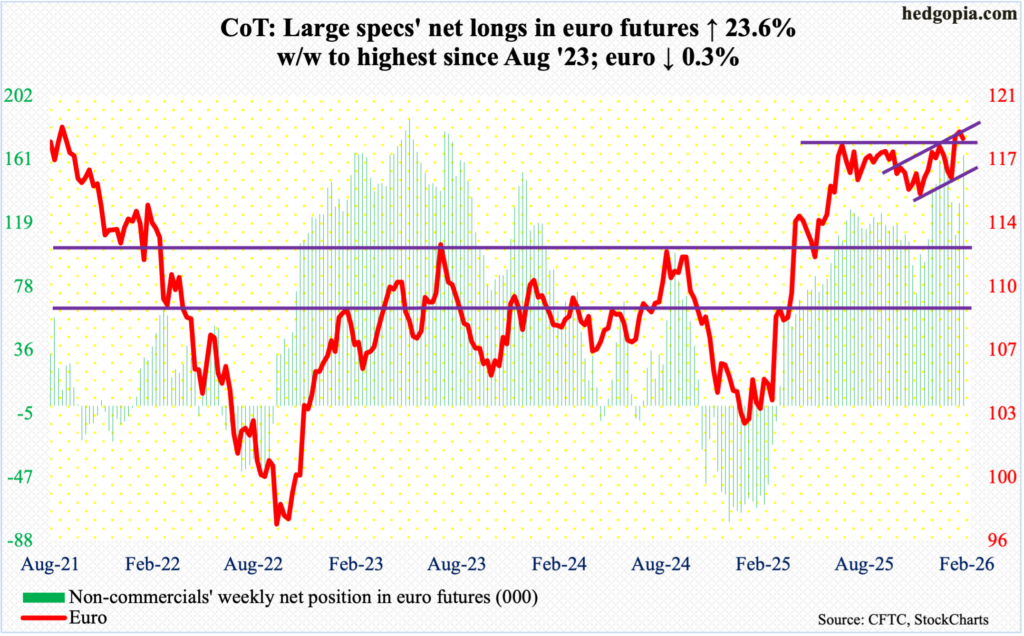
Euro bulls and bears are absolutely locked into a duel for control of $1.18. Resistance just north of $1.18 goes back to at least last June.
Three weeks ago, the euro jumped two percent to $1.1829, breaking a three-week losing streak. This was followed by a breakout last week, with an intraday tag on 27 January of $1.2083, which the bulls were unable to keep, finishing the week at $1.1852 and forming a weekly gravestone doji. If this candle lives up to its reputation, the currency has much further to go on the downside. This week, it gave back 0.3 percent to $1.1817.
There is straight-line support at $1.15s.
Gold: Currently net long 165.6k, down 39.8k.
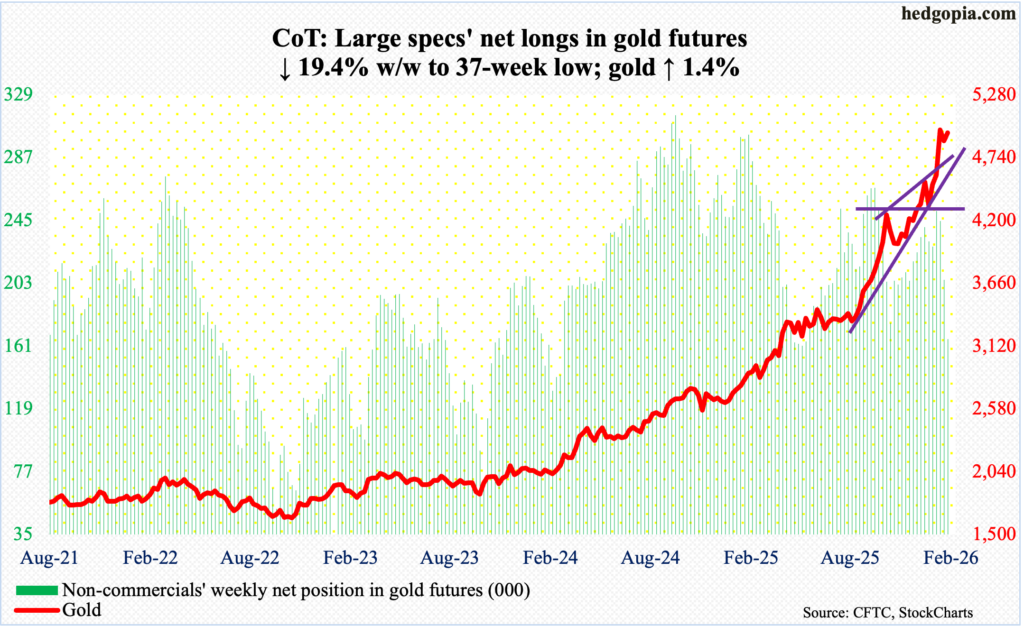
Gold just witnessed a crazy couple of weeks.
Last week, on 29 January, it ticked $5,608 intraday. In October 2023, gold bottomed at $1,810. After this kind of a run, it is now acting very volatile. Gold bugs were unable to hang on to last week’s high, dropping as low as $4,693 and closing at $4,887. This week, the metal opened the week with Monday’s intraday low of $4,405 and a high of $5,092 on Wednesday, closing at $4,964/ounce; for the week, gold rose 1.6 percent.
Month-to-date, February is up 1.6 percent; if this holds up, the yellow metal would have rallied for seven months in a row; in fact, over 27 months, there have only been five down months.
Gold now is going through digestion. The January 29th high could prove to be very important. From the bulls’ perspective, the good news is that horizontal support at $4,370s was defended on Monday, not to mention the 50-day at $4,536.
Once $4,370s yield, the next layer of support lies at $3,900 and then $3,440s.
Nasdaq (mini): Currently net long 14.2k, down 14k.
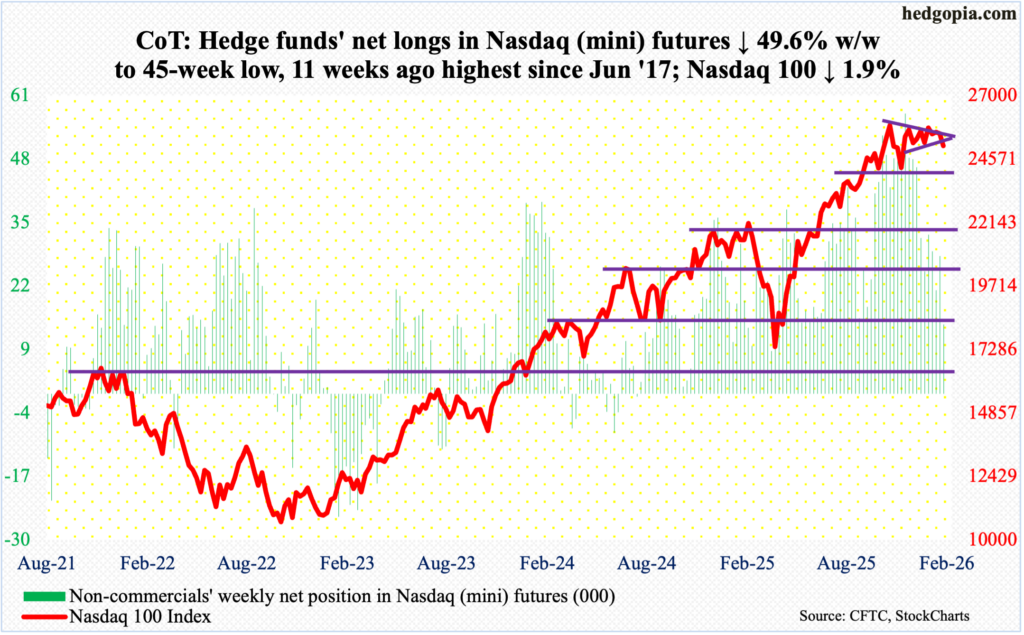
Last week, when four of Magnificent 7 – Apple (AAPL), Facebook parent Meta Platforms (META), Microsoft (MSFT) and Tesla (TSLA) – reported their December-quarter results, the Nasdaq 100 came within 17 points of the October 29th peak of 26182 and met with selling pressure. This week, Google parent Alphabet (GOOG) and Amazon (AMZN) published their numbers, and the tech-heavy index continued to come under pressure, shedding 1.9 percent to 25076.
For tech bulls, the only consolation is that the index at Thursday’s low was down as much as 4.3 percent, and that weakness was taken as an opportunity to load up on Friday. Near-term, a rally is possible. The 50-day lies above at 25452, and this is bound to attract bears. How things transpire at the average should decide which way momentum will trend in the near term.
Mid- to long-term, bulls are sitting on tons of gains, as the Nasdaq 100 rallied 58 percent between the intraday low of 16542 on 9 April and the all-time high on 29 October. Amidst this came November and December – both down months, albeit nominally – which produced a hanging man and a doji, in that order. The Nasdaq 100 is also caught in a symmetrical triangle from the October high, and it is at risk of breaking to the downside.
Russell 2000 mini-index: Currently net long 4.3k, down 8k.
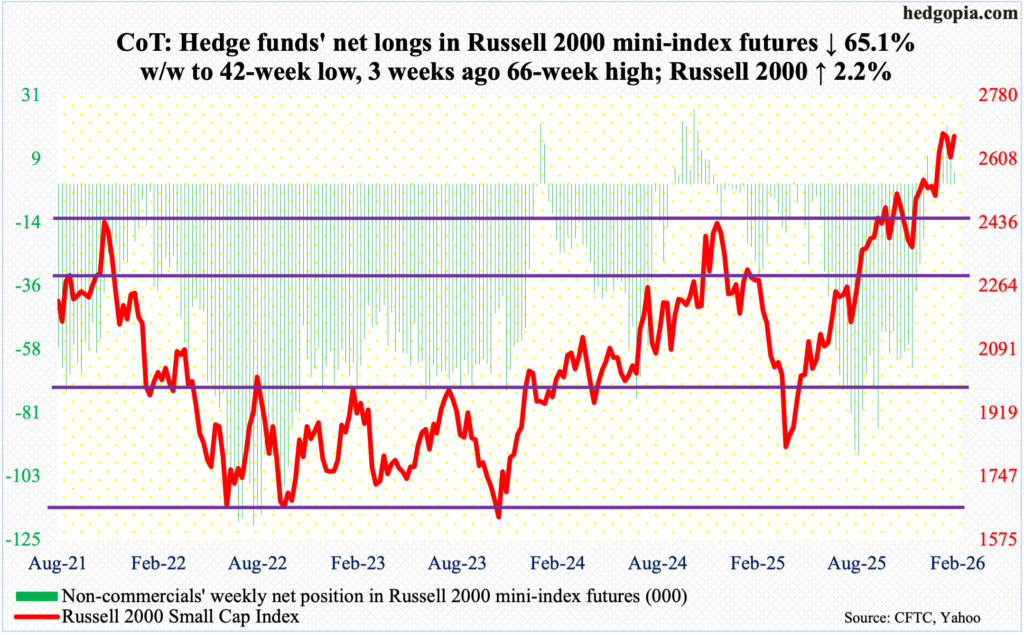
One week does not a trend make, but small-caps arguably are benefiting from tech woes. This week, the Russell 2000 rallied 2.2 percent to 2670. Even at Thursday’s low of 2569, it was only down 1.7 percent for the week; that low also served as a successful breakout retest at 2540s.
The small cap index did peak on January 22 at 2735 and has come under pressure a tad since. For all of January, it rallied 5.5 percent, although it was up as much as 10.2 percent at its high; as a result, the month produced a candle with a very long wick. This comes on the heels of potentially bearish candles of November and December, which respectively produced a hanging man and a shooting star. These candles have not been definitively nullified, but at this stage bulls probably deserve the benefit of the doubt more than the bears.
US Dollar Index: Currently net short 852, down 3.6k.
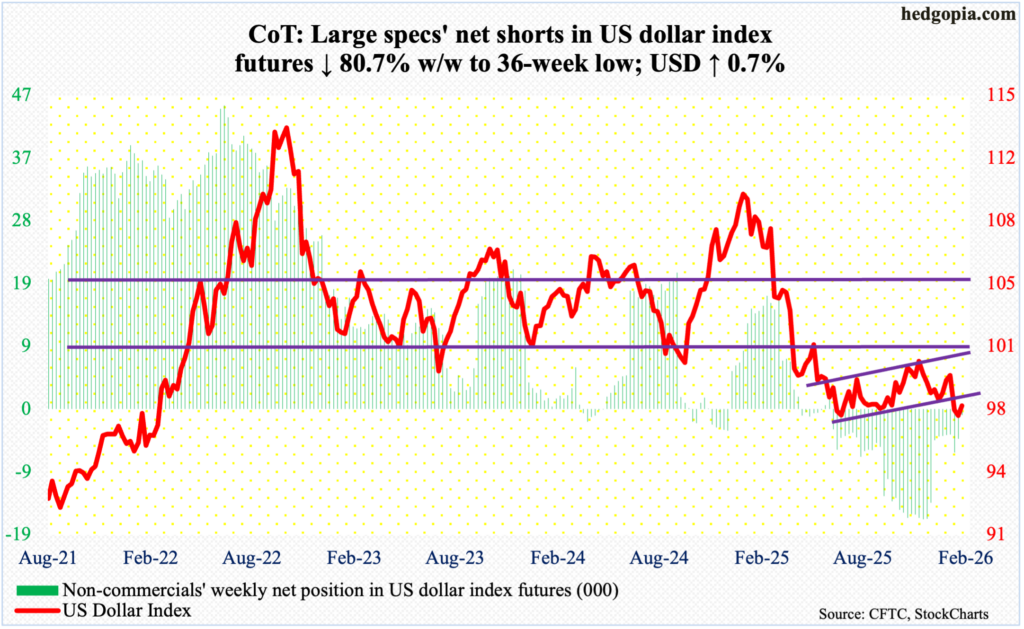
Resistance just south of 98 is proving tough to crack. On Thursday and Friday, the US dollar index respectively tagged 97.99 and 97.97 intraday, before finishing the week up 0.7 percent to 97.69. This follows aggressive buying interest last week under 96.
In January last year, after a three-plus-month rally, the index reversed hard at 110.18, subsequently reaching 96.38 in June and successfully testing that low with a lower low of 96.22 in September. Last week, another lower low of 95.55 was ticked on 27 January, and that was embraced by dollar bulls, ending the week at 97.14 with a weekly dragonfly doji.
Bulls need to recapture 98 before they can eye resistance just north of 100, which goes back more than a decade. They are having difficulty doing so as the daily RSI acts like it wants to retreat at the median.
VIX: Currently net short 80.6k, up 5.6k.
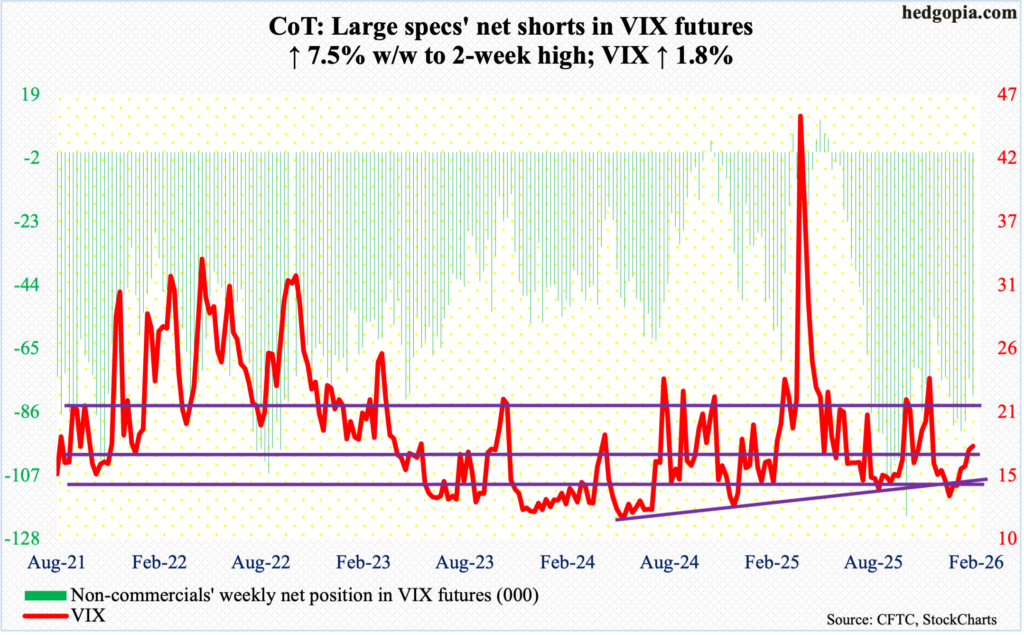
VIX managed to tick 23.10 – a two-and-a-half-month high – on Thursday, but only to then tumble back down on Friday, finishing the week up 0.32 points to 17.76.
On Christmas Eve, the volatility index ticked 13.38 intraday and has been on an uptrend since. This support gets tested just under 17. On the daily, VIX does act like it wants lower prices for now.
Thanks for reading!
