
Following futures positions of non-commercials are as of November 13, 2018.
10-year note: Currently net short 333.2k, down 206k.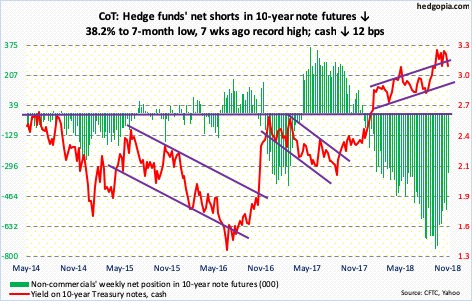
On October 5, the 10-year rate (3.07 percent) began retreating after touching 3.25 percent – the highest since May 2011. Thursday last week, it rallied to 3.24 percent, before once again meeting with selling pressure. On both occasions, yields went on to slightly undercut support at 3.11 percent. This time around, it just might stick.
Friday’s (this week) low of 3.07 percent came just above the daily lower Bollinger band. That was also the case on October 26 when the 10-year rate fell to 3.06 percent to successfully test that band. Should a bounce occur next week, what transpires around 3.11 percent will be telling. The latest breach of 3.11 percent came about after bond bulls kept hammering on that support.
In the meantime, non-commercials have been quietly reducing their net shorts. Since accumulating record net shorts seven weeks ago, they have cut back by 56 percent. Yields potentially drop more if these traders continue to unwind.
30-year bond: Currently net short 73.3k, up 2k.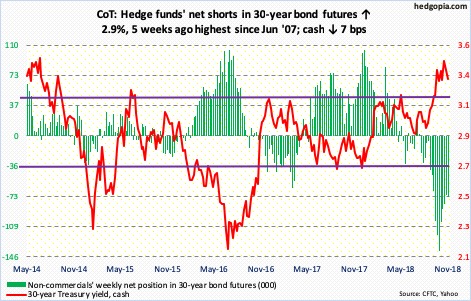
Major economic releases next week are as follows. Happy Thanksgiving!
The NAHB housing market index for November is due out Monday. Builder sentiment in October rose a point month-over-month to 68. Last December’s 74 was the highest since 75 in July 1999.
Tuesday has on tap October’s housing starts. In September, starts fell 5.3 percent m/m to a seasonally adjusted annual rate of 1.2 million units. January’s 1.33 million was the highest since 1.35 million in July 2007.
Wednesday brings durable goods (October), existing home sales (October) and University of Michigan’s consumer sentiment index (November, final).
Orders for non-defense capital goods ex-aircraft – proxy for business capex plans – rose two percent year-over-year in September – substantial deceleration from August’s 7.9-percent increase.
Existing home sales in September dropped 3.4 percent m/m to 5.15 million units (SAAR). Last November’s 5.72 million was the highest since 5.79 million in February 2007.
Preliminarily, November consumer sentiment fell three-tenths of a point m/m to 98.3. March’s 101.4 was the highest since 103.8 in January 2004.
Crude oil: Currently net long 432.7k, down 26.1k.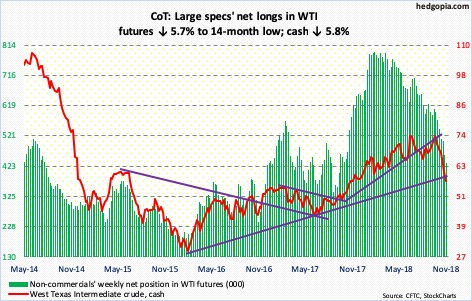
Spot West Texas Intermediate crude ($56.68/barrel) tried to stabilize in the latter part of the week, but not before losing trend-line support from February 2016. Back then, the crude bottomed at $26.05, before beginning a multi-year rally until the high of $76.90 early last month. The underside of that trend line gets tested around $60. It will be an important test.
For now, bulls defended support at $55, with the intraday low of $54.75 Tuesday. The daily chart remains extremely oversold. Medium- to longer-term, the question is, is oil trying to say something about global demand with the WTI having dropped 29 percent from high to low in six weeks?
Concurrently, in the eight weeks ended November 9, US crude stocks jumped 47.9 million barrels to 442.1 million barrels, with a rise of 10.3 million barrels in the latest week. The EIA report also showed crude production rose another 100,000 barrels per day to 11.7 million b/d. Gasoline and distillate stocks, however, fell – down 1.4 million barrels and 3.6 million barrels respectively to 226.6 million barrels and 119.3 million barrels. Crude imports dropped 87,000 b/d to 7.5 mb/d. Refinery utilization inched up one-tenth of a percentage point to 90.1 percent.
E-mini S&P 500: Currently net long 201.4k, up 3.4k.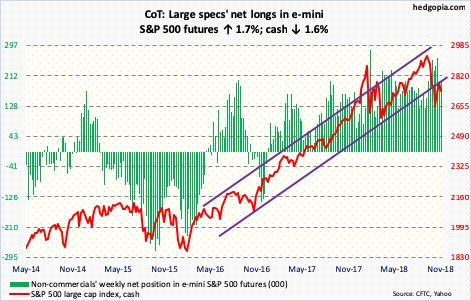
After seeing the cash (2736.27) drop for five consecutive sessions, bulls seemingly put their foot down Thursday when from intraday low to close the S&P 500 rallied 2.2 percent.
Up until Wednesday, flows were tentative. In the week through that session, SPY (SPDR S&P 500 ETF) gained $184 million and VOO (Vanguard S&P 500 ETF) $194 million, even as IVV (iShares core S&P 500 ETF) lost $330 million (courtesy of ETF.com). In the same week, US-based equity funds (including ETF’s) took in $2.7 billion (courtesy of Lipper.com). Since the week ended October 3 when the S&P 500 began its waterfall dive, these funds lost $17.8 billion.
Thursday’s reversal comes at a potentially important spot. If it holds, this would have meant a higher low versus the prior low of October 29 – important given the oversold condition the index finds itself in. Immediately ahead, the 200-day lies at 2760.69. The average, as well as the 50-day, are both falling. Bulls are probably not too excited by this. If the 200-day is recaptured, major resistance lies at 2800, which has proven to be an important level the past nine months.
Euro: Currently net short 37k, down 9.8k.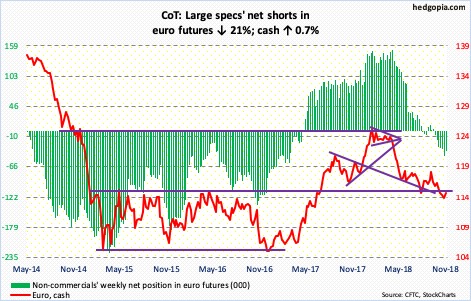
In 3Q18, the German economy unexpectedly fell 0.2 percent sequentially – the first contraction since 2015. Exports took a hit. This comes at a time when Italy continues to be at loggerheads with fiscal overseers in Brussels. The ECB surely hopes 3Q18 does not mark a trend in Germany – and by default in the euro zone. The bank is in a tough spot. It wants to end its QE by December. The German contraction has muddled the planned policy normalization a bit.
The cash ($114.14) opened the week with a gap-down Monday to a 16-month intraday low of $112.15, before proceeding to rally the rest of the week. There is room to rally, if nothing else just to unwind oversold conditions. In the best of circumstances, bulls have a shot at a test of the broken-support-turned-resistance at $115-plus.
Gold: Currently net short 9.2k, up 28.3k.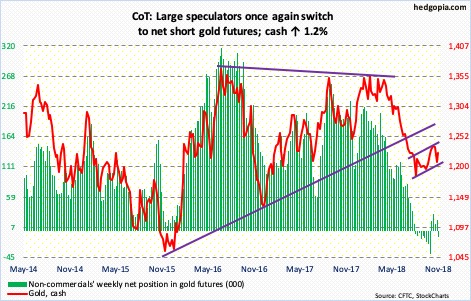
The cash ($1,223/ounce) dropped intraday from $1,369.40 in April to $1,167.10 mid-August. Since that low, gold has traded within a slightly rising channel, the low end of which was defended this week.
In the week ended Wednesday, GLD (SPDR gold ETF) attracted $241 million, for a total $1.2 billion over six weeks. In the same week, IAU (iShares gold trust ETF) lost $40 million (courtesy of ETF.com).
For four months now, bulls and bears fought a tug of war around $1,213. The 50-day ($1,213.96) lies right there. This resistance was recaptured Friday. The next battle will be fought around $1,240, which repelled rally attempts several times in recent months.
Nasdaq 100 index (mini): Currently net short 5.4k, up 4.8k.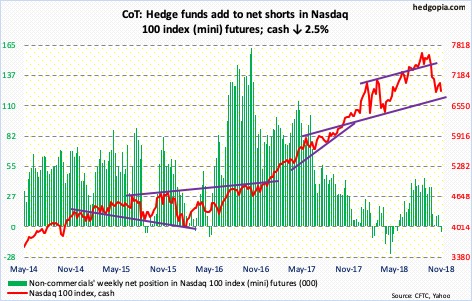
In the aggregate, bears continued to carry the momentum this week. But Thursday’s mini-reversal on the cash (6867.02) should give bulls some hope. The latter defended the late-October lows in that session. Let us see if flows cooperate in the sessions ahead. In the week through Wednesday, QQQ (Invesco QQQ Trust) lost $989 million (courtesy of ETF.com).
Since late October, bulls have shown willingness to go long, even as bears get active at resistance. Mid-October, they were denied at 7300. Three weeks after that, sellers showed up at 7200, for a lower high. If the Nasdaq 100 rallies near term but stops at the 200-day (7070.04), the pattern will have remained intact.
Russell 2000 mini-index: Currently net short 32.6k, down 14.3k.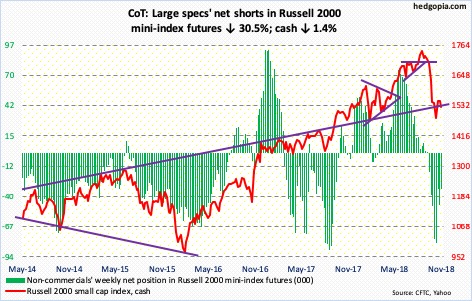
Thursday’s intraday low of 1491.66 on the cash (1527.53) did not even come close to testing the low of three weeks ago when 16-month support at 1450-ish was defended. Immediately ahead, resistance lies at 1535. If bulls manage to genuinely wrestle back the ball, the Russell 2000 index can rally to 1600-plus, where resistance is massive. The 200-day (1614.72) lies there as well.
In the week to Wednesday, IWM (iShares Russell 2000 ETF) and IJR (iShares core S&P small-cap ETF) both saw positive flows – $293 million and $161 million, in that order (courtesy of ETF.com).
US Dollar Index: Currently net long 40.5k, up 231.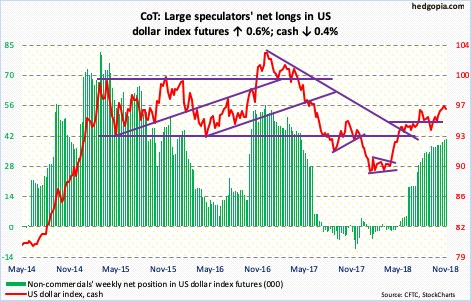
The cash (96.33) Monday rose to 97.53 intraday, which was the highest since May 2017, but not before immediately coming under selling pressure. The week ended with a candle with a long upper shadow. Mid-August, after rallying to 96.86, a shooting star showed up on the US dollar index, which then proceeded to drop 3.6 percent in the next five weeks. It is too soon to conclude if things would evolve the same way, but odds are decent that the index comes under pressure – at least near term. Conditions are overbought. There is decent support at just north of 95.
VIX: Currently net long 22k, up 9k.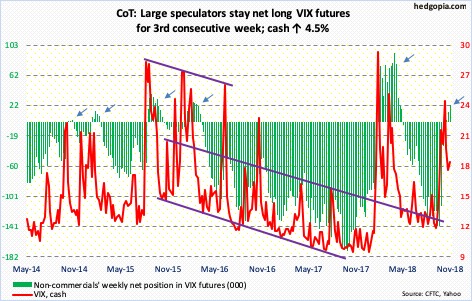
The cash (18.14) peaked at 28.84 intraday on October 11. In the next four sessions, it quickly dropped to just north of 17, before rallying to 27.86 by October 29, for a lower high. During that time, the S&P 500 fell to a lower low. Thursday last week, VIX again dropped to just north of 16, which was defended. The 200-day lies in that area as well. Volatility bulls are defending support, although bears are not allowing a higher high. This will resolve one way or the other.
Thursday’s shooting star is probably an indication that the path of least resistance is down near term. But unless support at 16 gives way, volatility bears should refrain from high-fiving.
Thanks for reading!
