
There is divergence in the markets. Tons of it.
Large-caps are going one way and small-caps the other. Ditto with transports and high-yield.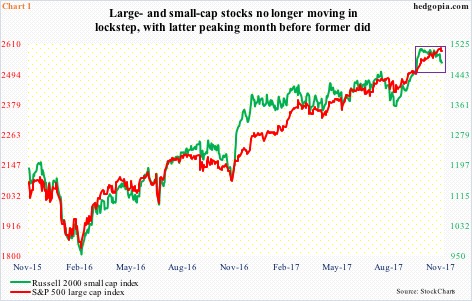
The Russell 2000 small cap index peaked on 1514.94 on October 5, before trending lower in a descending channel. The S&P 500 large cap index reached an all-time high of 2597.02 on November 7.
The Russell 2000 already lost the 10- and 20-day moving averages, and is currently sitting on the 50-day. The S&P 500 is 1.8 percent from the 50-day, with the bulls defending the 20-day last Friday.
The divergence is evident in Chart 1.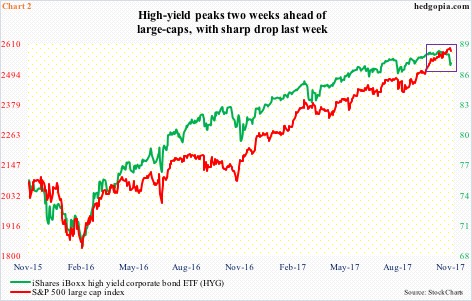
The S&P 500 is only 0.6 percent from its highs. High-yield bonds, on the other hand, took a mini nosedive last week. From its record high of 88.37 on October 23 through the low of 86.72 last Thursday, HYG (iShares iBoxx high yield corporate bond ETF) lost 1.9 percent, before catching a bid Friday (Chart 2).
HYG has lost the 50-day. The 200-day is one percent away.
The correlation (20) between HYG and the S&P 500 has collapsed to -0.5 from 0.91 on October 3.
At any point in time, both high-yield and small-caps in general tend to reflect investor willingness to take on risk – or a lack thereof. Investors tend to gravitate toward these sectors when they are on risk-on mode. Viewed this way, they are currently beginning to lean toward risk-off.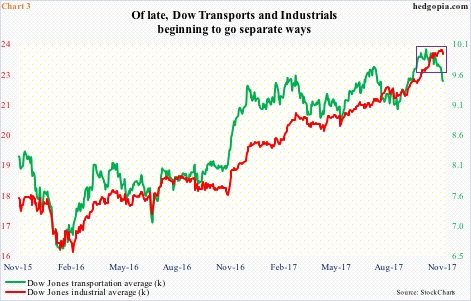
We have all heard of the so-called Dow Theory, which postulates that indices must confirm each other. If, let us say, economic/business conditions are good, both industrials and transports should be moving in tandem, suggesting what is being produced is being transported.
Currently, the Dow Jones transportation average is severely lagging the Industrials (Chart 3). The divergence between the two is recent, with the former peaking on October 13 and the latter on November 7. They are 5.8 percent and 0.8 percent off their highs, in that order.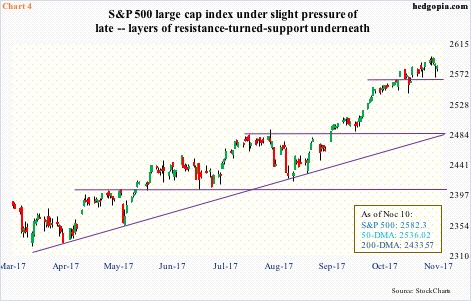
Of late, both the Dow industrials and the S&P 500 have come under some pressure. As stated earlier, both peaked on November 7.
Staying with the S&P 500 for our purposes here, the bulls are not in a mood to give up that easy either.
As overbought as the S&P 500 is on nearly all timeframe, the bulls for now are stepping up where they should. Last Friday, they defended the 20-day.
In two out of last seven sessions, intraday pressure on the S&P 500 was snapped up, resulting in candles with long lower shadows (Chart 4). Is this a hammer or a hanging man? The former tends to be bullish, the latter bearish.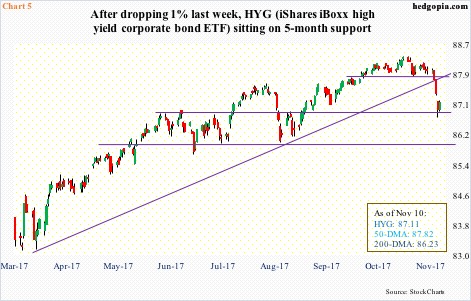
Here are a couple of scenarios how this could all play out in the days/weeks to come.
In scenario one, the S&P 500 continues lower. Short-term support at 2565 is crucial in this regard. If this gets taken out, there is room for downward pressure at least near term. In this scenario, the Russell 2000 ends up losing the 50-day, and the S&P 500 continues to unwind the daily overbought condition it is in.
In scenario two, the 50-day holds on the Russell 2000 – the daily chart is oversold enough bids start showing up. Immediate resistance lies above, at 1485. Similarly, HYG is sitting right on five-month horizontal support.
In this scenario, the question then becomes if this is just a relief rally or something more than that.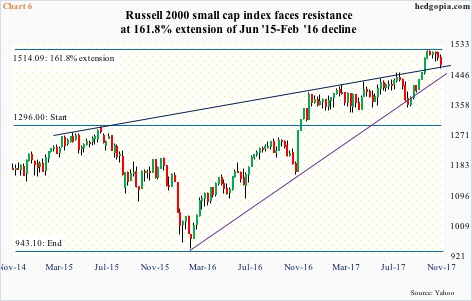
In this regard, the Russell 2000 in particular sits at a critical juncture. Seven weeks ago, it broke out of a multi-year rising wedge. The subsequent rally was stopped right at major Fibonacci resistance – the 161.8-percent extension of the 27.2-percent collapse between June 2015 and February 2016 (Chart 6).
Sellers showed up right on cue at that resistance. This was preceded by a massive 60.6-percent rally off of the February 2016 low. Weekly and monthly charts are way overbought, and need unwinding. This raises the odds that, should scenario two come to pass, it is just a matter of time before relief rally gets sold.
Thanks for reading!
