
The Fed raised rates for the first time in just over three years. Equities are acting as if it is one, or two, and done. But futures traders are pricing in three more hikes by December next year. The major equity indices are nowhere near pricing this in, although they may have upside potential in the very near term.
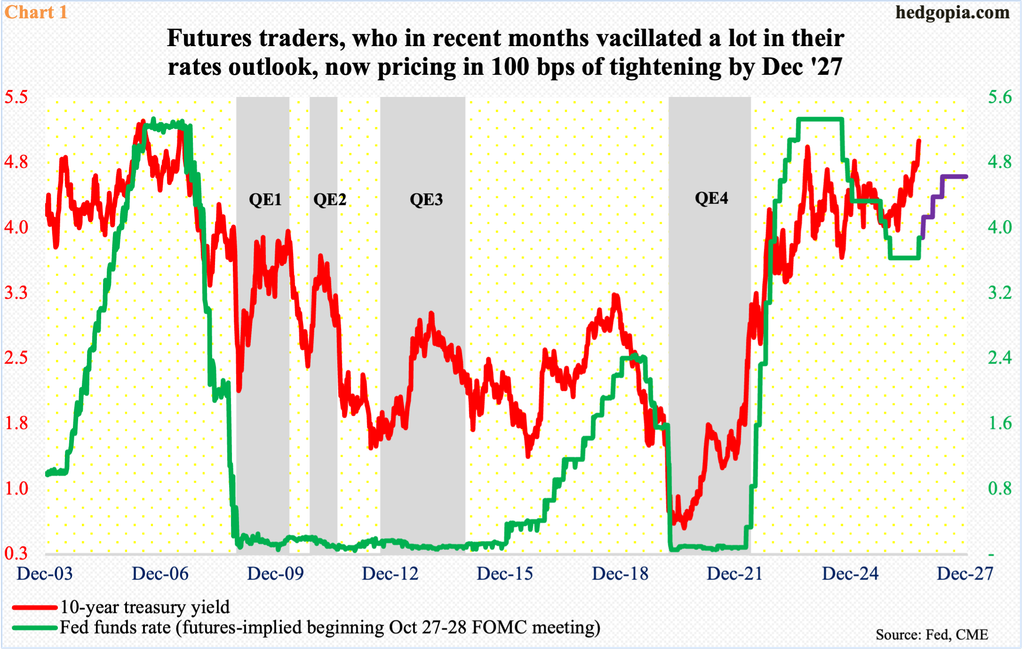
Last week’s 25-basis-point increase in the fed funds rate to a range of 3.75 percent to four percent was the first hike since July 2023. Back then, rates then went sideways between 5.25 percent to 5.50 percent until September 2024 when they were lowered by 50 basis points, followed by two more quarter-point cuts by December. This was then followed by three more cuts for a cumulative 75 basis points in 2025, with the last easing taking place in December. All told, the benchmark rates were lowered by 175 basis points in that easing cycle.
The rates market is beginning to realize that it is unlikely the hike last week is just a one-off or that the cycle will limit to a couple of hikes. The CME’s FedWatch tool is betting on three more hikes by December next year – one this year and two in the first half next year (Chart 1). This would have rolled back 100 basis points of the 175 basis points of easing in the preceding tightening cycle.
Newly appointed Federal Reserve Chairman seems determined to take on inflation that has remained above the central bank’s stated goal of two percent for over five years. Unlike the July FOMC meeting that had three dissents in the majority decision to keeping the rates steady, the decision last week was unanimous.
The 10-year treasury yield, which rallied feverishly ahead of last week’s FOMC meeting and would probably have rebelled if the FOMC went on a hold, sits at a crucial level. In four of the five sessions last week, these notes were yielding five percent intraday, ending the week up two basis points 4.998 percent. The last time the yield was this high was October 2023. There is crucial support at 4.75s. Given the move it has had since February this year from a low of 3.96 percent, the 10-year likely takes a breather near term, with decent support at 4.75s.
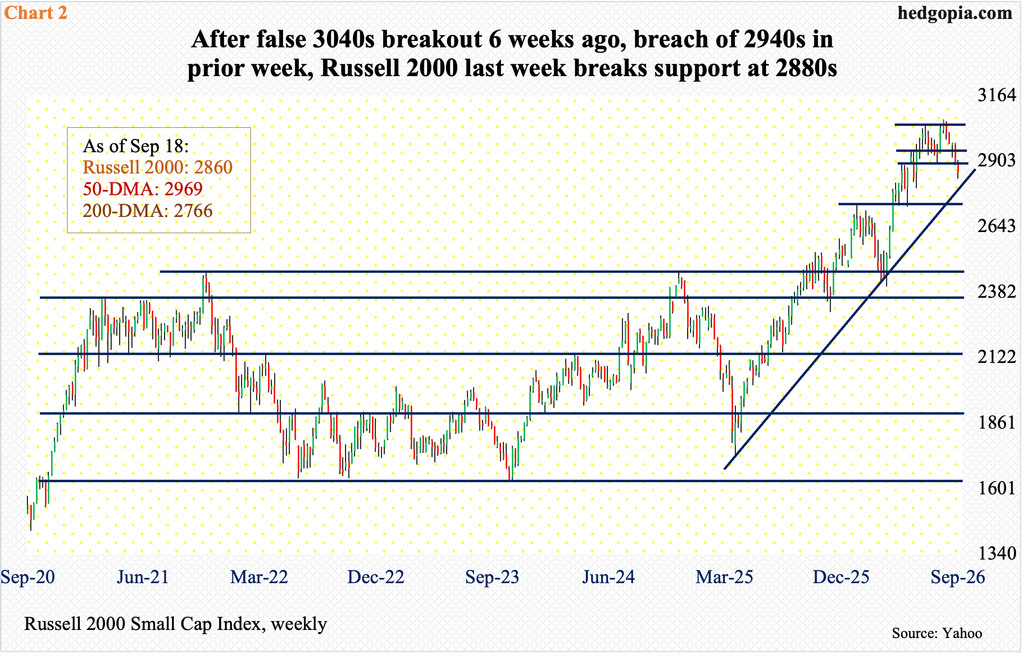
The Russell 2000 took it on the chin last week, down 1.5 percent to 2860. By nature, small-cap businesses have a large exposure to the domestic economy; in contrast, mid- and large-caps also have international exposure. Small-caps also tend to be leveraged, with more exposure to the short end of the yield curve. Higher rates will bite.
The small cap index has been on the defensive ever since it peaked at 3070 on August 14; turns out a preceding breakout at 3040s was false. That peak has been followed by a series of lower highs, with breaches of important support. In the week before, horizontal support at 2940s was compromised; last week, 2880s was gone (Chart 2).
For bulls’ consolation, last Wednesday’s low of 2832 was bought just above trendline support from April last year when the Russell 2000 bottomed at 1733. Bulls’ nearest hurdle obviously lies at 2880s. Inability to recapture this level raises the odds that the index gravitates toward the 200-day moving average at 2766, with horizontal support at 2730s.
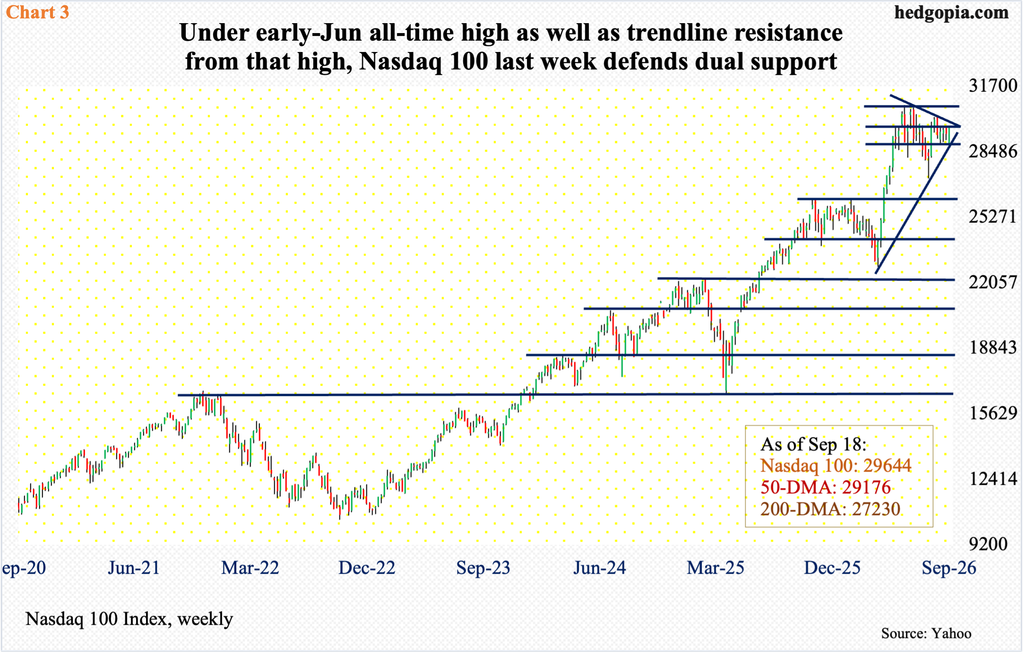
Trendline support also held firm on the Nasdaq 100 last week, but this one goes back to the March low this year, not April last year (Chart 3). This support coincided with horizontal support at 28600s-28800s. The tech-heavy index ended last week up 0.9 percent to 29644, also reclaiming the 50-day at 29176.
The problem for the bulls is that the Nasdaq 100 remains well under its all-time high of 30762 from June 3. Other major indices like the S&P 500 and Russell 2000 already eclipsed their June highs, before posting new ones in August.
The Nasdaq 100 has been caught in a pattern of lower highs since the June high. Trendline resistance from that high will be tested at 29800s, which, now that tech bulls defended 28600s-28800s, likely acts as a magnet for now.
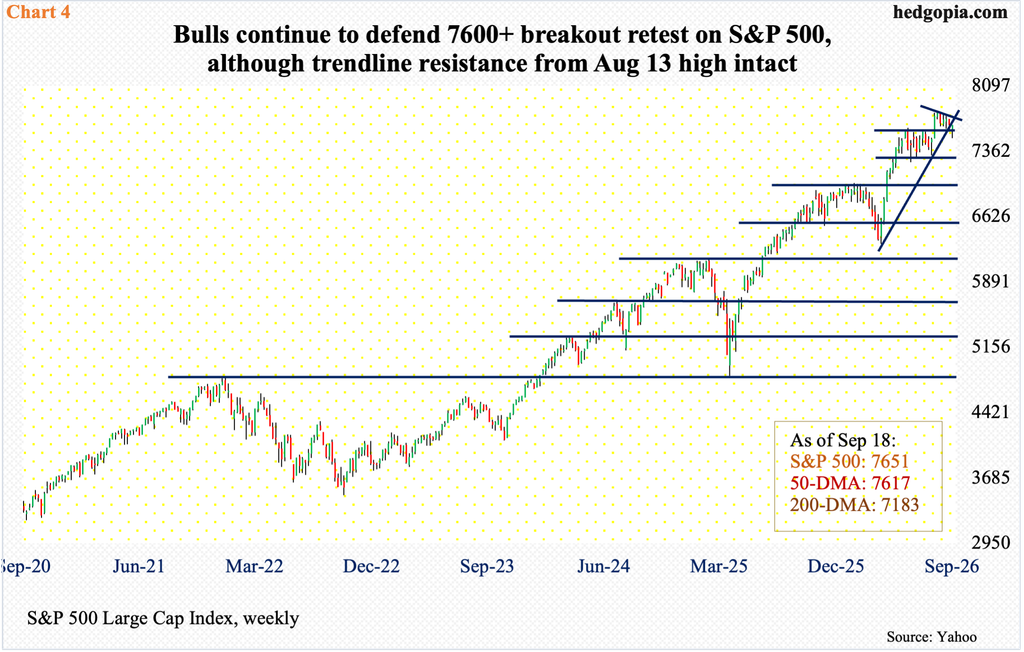
Bulls also successfully defended a crucial support on the S&P 500, which consolidated for a couple of months after peaking at 7621 on June 2; a breakout took place on August 4. By the 13th last month, the large cap index posted a new intraday high of 7817 and headed lower. A series of lower highs followed, but 7600-plus is yet to yield.
Intraday Wednesday last week, after the FOMC decision came out, the S&P 500 fell as low as 7508, but only to close at 7552; the final two sessions brought more gains, as the index closed at 7651, down merely 0.1 percent for the week.
Both Thursday and Friday, the 50-day (7617) provided support; a spinning top formed on Thursday, even as Friday produced what is yet to be decided if it is a hammer (bullish) or a hanging man (bearish).
As things stand, bulls deserve the benefit of the doubt. They have defended 7600-plus for a month now and will face a test at 7700, whereupon rests trendline resistance from the August peak. The S&P 500 closed last week right at trendline support from the March low (Chart 4).
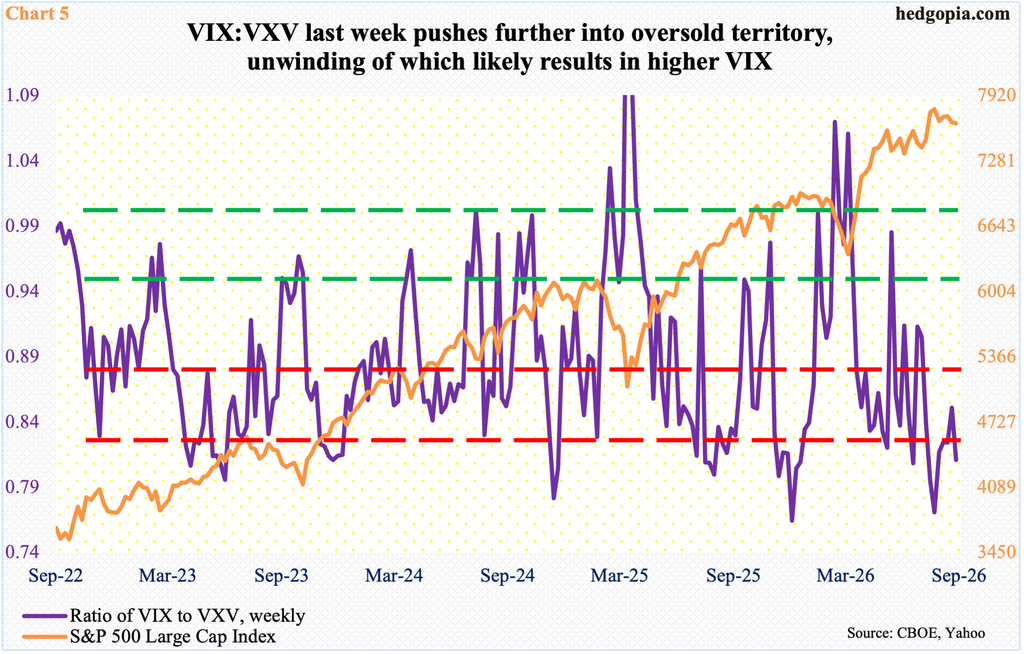
Genuine risk of continued tightening by the Fed is not yet priced in the S&P 500. Volatility is very low, with VIX dropping 1.03 points last week to 14.81, breaching the 50-day (16.17). Volatility bulls failed to cash in on an opportunity to recapture the 200-day (18.08), with Wednesday ticking 18.94 intraday. The index likely heads toward the low-14s near term.
In this scenario, the ratio of VIX to VXV would have pushed further into oversold territory. At 0.812, the ratio is already low enough to warrant unwinding (Chart 5).
VIX measures market’s expectation of 30-day volatility on the S&P 500. VXV does the same, except it goes out to three months. During a risk-on environment, demand for VIX-derived securities is lower than VXV. The opposite is true when sentiment turns to risk-off and VIX rallies.
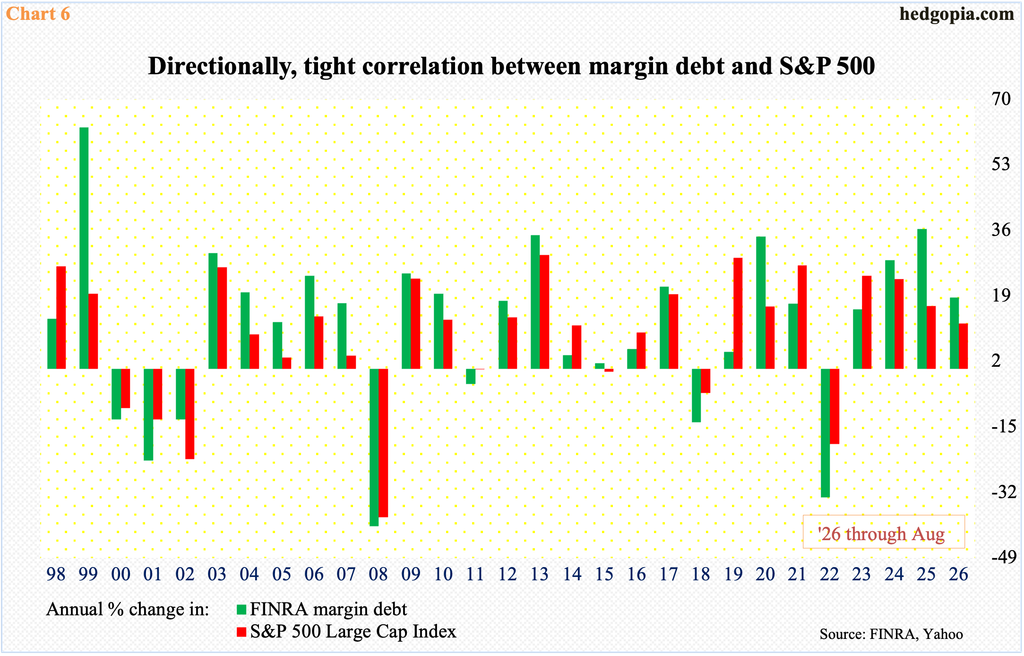
In a tighter monetary policy environment, equity bulls in due course will need to factor in prospects for higher margin calls as borrowing gets more expensive.
Thus far, margin debt has provided a massive tailwind to the bull market. In April 2025, FINRA margin debt bottomed at $850.6 billion, and then again at $1.2 trillion in March this year; by June, it posted a fresh high $1.5 trillion.
Directionally, margin debt and the S&P 500 have a tight relationship (Chart 6). This time around, the large cap index rose to a new high in August but not margin debt, which closed last month at $1.45 trillion; although it is feasible that since the index peaked on the 13th the subsequent drop resulted in unwinding of leverage as well.
The big picture view is that if interest rates follow the path currently projected by CME futures traders, this is bound to negatively impact demand for leverage, and this will have impacted risk-on sentiment.
Thanks for reading!
