
Major equity indices are within striking distance of fresh highs. Bulls hope the low hurdle in 1Q19 earnings helps put volatility under more pressure. Trader reaction to earnings is key.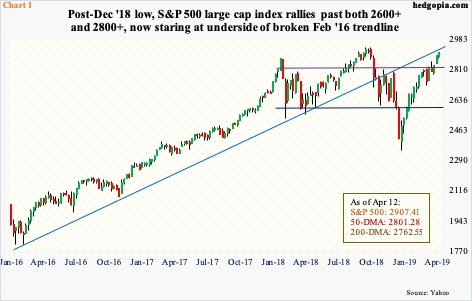
Major US equity indices are a stone’s throw away from eclipsing last year’s highs. Large-caps are leading. The Dow Industrials is two percent away from its October high. The Nasdaq composite is 1.9 percent from its August high. Within tech, the Nasdaq 100 is merely 0.9 percent from its October high. Both the S&P 400 mid cap index and the Russell 2000 small cap index, on the other hand, are 4.5 percent and 9.9 percent from their respective August highs. The S&P 500 large cap index is 1.2 percent from its September high.
From late-December lows, these indices have pushed through one after another resistance. Even the otherwise-lagging Russell 2000 (1584.80) is now above its 200-day moving average. Having broken through a descending channel from February 25, it now eyes crucial resistance at 1600, which goes back to January last year.
The S&P 500 (2907.41) similarly rallied past 2600+ and 2800+ and currently sits right underneath a broken trend line from the lows of February 2016 (Chart 1). Even if the index finds it difficult to take out this resistance right away, there is now solid support 100 points below.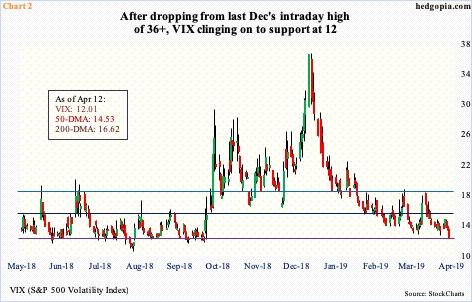
VIX (12.01) sits at a crucial juncture (Chart 2). From volatility bulls’ perspective, the good thing is that it has not closed sub-12 since last September. Last Friday’s intraday low of 11.95 was the lowest since early October last year. That said, bulls cannot afford to lose 12; risks are rising.
In the past, sustained rallies in stocks routinely pushed the volatility index toward 10-11. Its all-time low of 8.56 was recorded in November 2017. Further downward pressure on volatility is an ideal scenario for equity bulls. For at least the next few weeks, earnings can provide tailwind.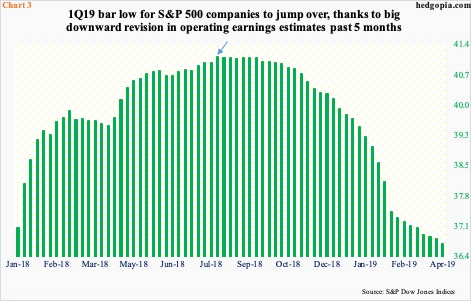
Last Friday, JP Morgan (JPM) and Wells Fargo (WFC) reported their March quarter, earning $2.65 and $1.20 respectively – much better than consensus estimates of $2.35 and $1.09. Here is the thing. Three months ago, they were expected to earn $2.52 and $1.14, in that order. The lowered estimate enabled a much larger beat. Post-earnings, WFC rallied but reversed earlier gains to end the session down 2.6 percent because it guided down its outlook for net interest margin; JPM rallied 4.7 percent.
Later this morning, Goldman Sachs (GS) and Citigroup (C) report, followed by Bank of America (BAC) tomorrow. The story is the same. In the past three months, GS’s estimates have gone from $6.27 to $4.89, BAC’s from $0.67 to $0.65, and C’s from $1.85 to $1.80.
The downward revision trend has persisted for a while. March-quarter operating earnings estimates for S&P 500 companies were $41.12 last August (arrow in Chart 3); by last Thursday, they were lowered to $36.69. The bar is low.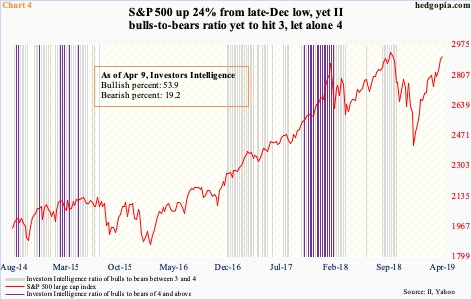
One reason longs are staying put even after racking up handsome gains post-December lows is precisely this. They are hoping stocks will react favorably to earnings results and that this would in turn force bears or those on the sidelines to jump on the bullish bandwagon.
Last week, Investors Intelligence bulls rose five-tenths of a percentage point week-over-week to 53.9 percent; bears dropped two-tenths of a percentage point to 19.2 percent. Early January, bulls were 29.9 percent, and bears 34.6 percent. So there has been quite an expansion in the bulls count. That said, early October last year when stocks began what soon turned into a cliff dive, bulls registered 61.8 percent. Leading up to this, the bulls-to-bears ratio remained in the three range for nine consecutive weeks. Before that, in January, it was four or higher for weeks. Not this time around (Chart 4).
The S&P 500 has rallied 24 percent since December lows, but the ratio is yet to produce a three reading, let alone four. On the one hand, this raises valid questions about the sustainability of the current rally, on the other hand it also points to the possibility of bears exiting their bearish stance kicking and screaming. It could literally go either way.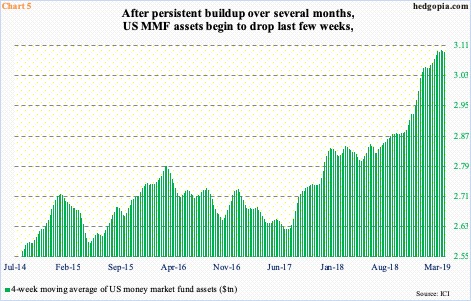
In recent weeks, bulls must like what is transpiring in US money markets. From early March, these assets declined just north of $14 billion to $3.1 billion. This, of course, preceded a massive build-up.
From early October last year to the high of five weeks ago, money market funds went up by $242 billion. The inflows did not stop even after stocks bottomed last December. The parabolic rise particularly since last October is evident in Chart 5, which uses a four-week moving average. The past couple of weeks, the bars have receded – albeit slightly. If the momentum sustains, major equity indices could soon be at least looking at new highs.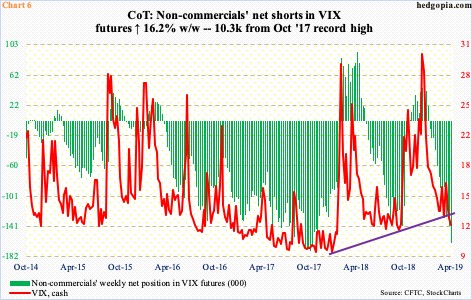
This is a scenario currently being aggressively bet on by non-commercials. Last week, they were net short 164,383 contracts in VIX futures, up 22.9k from the prior week. Having already surpassed last October’s levels, right before the cash began surging, holdings are now merely 10.3k contracts from record net shorts of October 2017 (Chart 6).
These are massive bearish bets and will get unwound sooner or later. The only question is if unwinding begins right here or from still-higher levels. The latter scenario comes to pass if the cash loses 12 and heads toward 10-11.
Nevertheless, equity bulls should remember that unwinding is certain to be painful, as has repeatedly happened in the past. Stretched rubber bands are filled with potential energy.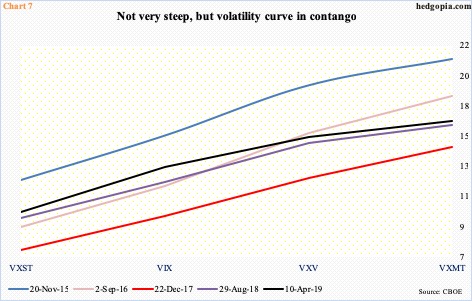
There is a similar message coming out of the VXST (nine days)-VIX (30 days)-VXV (90 days)-VXMT (six months) volatility curve. It is currently in contango, although it is not as steep as several instances in the past that preceded decent pullbacks in the S&P 500 (Chart 7).
Equity bulls obviously hope premium continues to come out of the short end of the curve, putting VIX for instance under more pressure. At least in the next few weeks, this is a scenario that could very well unfold, although this would also mean continued stretching of the rubber band. Thus the significance of traders’ reaction to earnings in the next few weeks. As stated earlier, the bar is low. But stocks have also rallied big into this. Trader reaction will be the tell.
Thanks for reading!
