
The Fed meets this week. It already shifted its bias from hawkish to dovish, helping stocks. With the economy softening, in due course the Fed may once again deploy balance sheet as a tool, which will initially help stocks, but unlike in the QE era, it may not be long-lasting this time around.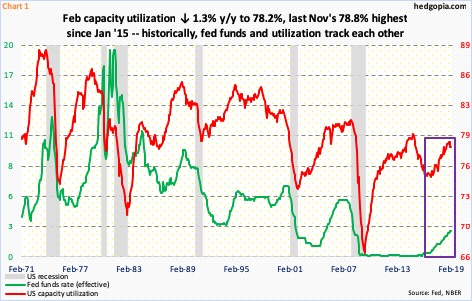
The FOMC begins a two-day meeting Tuesday. The Fed is expected to hold rates steady, with odds of nearly 99 percent in the futures market. The last hike was last December, when the fed funds rate went up 25 basis points to a range of 225 to 250 basis points. This was the ninth 25-basis-point increase since the Fed began raising rates three years ago.
Historically, rates are still very low. The US economy is just three months short of completing a decade of recovery/expansion. Signs of wear and tear are showing up, forcing the Fed to shift its bias from hawkish to dovish. Arguably, it may have waited too long to begin to hike. For several years post-Great Recession, the fed funds rate was left near zero even as US capacity utilization rose (Chart 1). In the past, the two showed a tendency to track each other.
In the current cycle, utilization peaked at 79.6 percent in November 2014 – before even hitting 80 percent. Last November, it once again retreated after touching 78.8 percent, with February at 78.2 percent. If utilization continues lower, the Fed likely responds.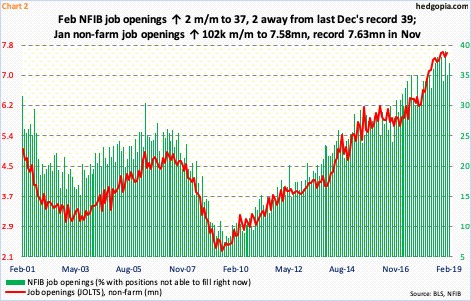
Of its dual mandate – maximum employment and price stability – the Fed has the luxury of alternating between the two. The jobs market is strong, but the official inflation rate is subdued. In a tightening mode, the Fed can focus on the former, and on the latter when it is not. For the bank to begin to ease, the hitherto sturdy jobs market probably needs to show cracks.
In February, only 20,000 non-farm jobs were created. This is just one month. Besides, January produced a very strong 311,000 jobs. A few more weak reports can tilt the balance in favor of easier policy.
In this scenario, job openings begin to weaken. Right now, they are running hot. In February, NFIB job openings were only two points away from last December’s record 39. Similarly, January’s non-farm job openings (JOLTS) were only 45,000 from last November’s record 7.63 million jobs (Chart 2).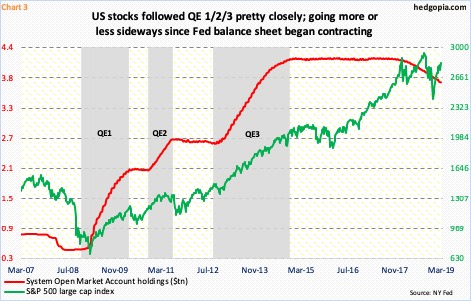
Several other data have already been decelerating. Real GDP grew 4.2 percent in 2Q18. The economy then decelerated to 3.4-percent growth in 3Q and then again to 2.6 percent in 4Q. As of last Wednesday, the Atlanta Fed’s GDPNow model was tracking 0.4-percent growth in the current quarter.
We will find out this week how the Fed reacts to it. The FOMC dot plot will be downgraded for sure. It is only a question of if members now expect one hike this year or none; until recently, they expected two. In all probability, based on recent speeches by several members – both voting and non-voting – they will also announce an end sometime this year to the ongoing balance-sheet reduction. As of last Wednesday, System Open Market Account (SOMA) holdings were $3.76 trillion, down from a peak of $4.24 trillion in April 2017. In December 2008, these were merely $500 billion. The Fed began to run down its balance sheet in October 2017. Currently, up to $60 billion a month can roll off its balance sheet.
Of note, during the three iterations of quantitative easing when the balance sheet ballooned, stocks did very well. The momentum continued even after QE ended and as the balance sheet went sideways, but not since it began contracting (Chart 3). At least in theory, a pause thereof should help stocks. Arguably, this is already occurring. From the December 26 low, the S&P 500 large cap index is up north of 20 percent.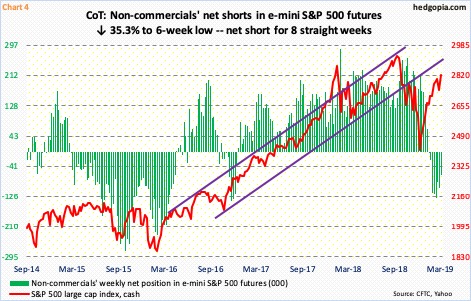
At least in the futures market, bears are being forced to rethink their thesis, which has helped stocks.
In e-mini S&P 500 futures, by the week ended October 30 last year, non-commercials were net long 263,008 contracts. The cash, having peaked early that month, was in serious downdraft by then. Obviously wrong in their bullish thesis, they began to lighten up. The index bottomed late December, but non-commercials continued to reduce net longs, and in fact switched to net short in the week to January 22. By February 19, they were net short 130,834 contracts. Once again wrong in their thesis, they have been reducing net shorts (Chart 4).
This phenomenon is also playing out in Nasdaq 100 index (mini) and Russell 2000 mini-index futures. Risk-on assets are likely to cherish if the Fed this week shifts to ‘no hike’ this year and/or puts an immediate end to balance-sheet reduction. Non-commercials may even decide to go net long – or add to their net longs.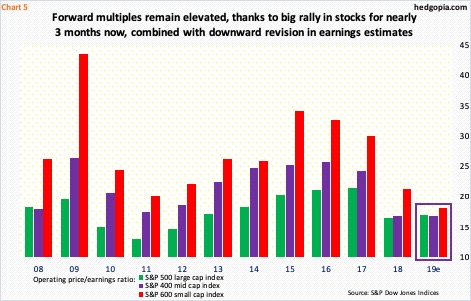
This is one scenario. The other is that stocks have already reacted to the possibility of an easier Fed. Back when the first iteration of QE began in late 2008, stocks were in freefall. Not so now. Back then, the US economy was a couple of quarters from exiting Great Recession, and earnings were suppressed. Not so now.
The current recovery will soon have completed 10 years. And, thanks in particular to tax cuts of December 2017, earnings were phenomenal last year. The sell-side was as enthusiastic for 2019 earnings, but reality sunk in. Estimates for this year are being cut left and right. Operating earnings estimates for S&P 500 companies went from $177.13 in August last year to $165.97. For S&P 400 companies, they went from $124.32 in October last year to $112.99, and for S&P 600 companies from $61.63 in June last year to $52.44.
Combine rising stock prices with falling earnings estimates, you get forward multiples that refuse to improve (Chart 5). On 2019 earnings, the operating P/E is just under 17 for both S&P 500 (large-caps) and 400 (mid-caps) and just over 18 for S&P 600 (small-caps).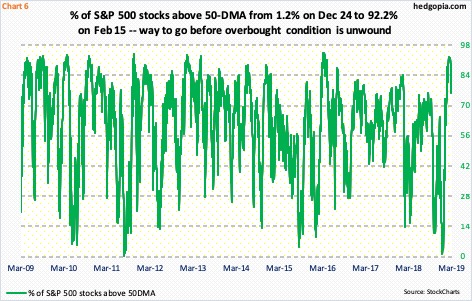
The rally since late December has pushed stocks into deep overbought territory.
On Christmas Eve, merely 1.2 percent of S&P 500 stocks were above their 50-day moving average. A near washout! The recovery since has been no less impressive. Mid-February, this metric rose to 92.2 percent, which was the highest since April 2016. It has been declining since hitting 92 percent late February, even as the index is slightly higher. This is a slight divergence and shows the largest of the large companies are doing the heavy-lifting currently. This is not sustainable and raises odds of unwinding of overbought conditions in weeks to come.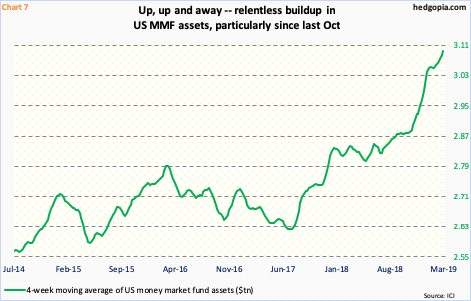
As things stand, that weakness likely gets bought. QE memories are still fresh on investors’ minds. And, there is dry powder.
As of last Wednesday, $3.1 trillion sat in US money-market funds – up $73 billion since stocks began rallying late December and up a massive $241 billion since early October last year. There is a sizable number out there who do not believe this rally has legs. Investor sentiment similarly is rather subdued, when compared to the rally in stocks since the late-December low. In this scenario, shorts cover, kicking and screaming. Money comes in from the sidelines.
Here is the rub! Even if the Fed brings out its stimulus hose, stocks’ reaction function longer term can be different versus the QE era. QE was not the savior it was made out to be. The post-Great Recession recovery is sub-par, with real GDP averaging 2.3-percent growth versus 3.2 percent historically. It increasingly takes more debt to produce the same amount of output. Leverage has gone up since Great Recession ended. Using this logic, bulls initially will get a tailwind from stimulative Fed policy, but bears are likely to have the last laugh.
Thanks for reading!
