
The long end of the Treasury yield curve is doing it again. It refuses to go along with the Fed’s tightening campaign, particularly so Wednesday as policymakers were a slightly more hawkish than previously.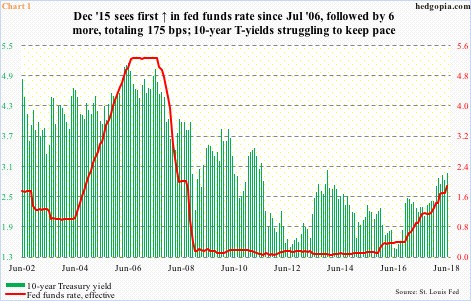
Wednesday, the Fed raised the fed funds rate by 25 basis points to 175-200 basis points (Chart 1). This was expected. What was not expected was the hawkish tilt policymakers made. The dot plot now forecasts four hikes this year, followed by another three in 2019. In March, they were expecting three this year.
Thus far, there have been two 25-basis-point hikes this year (the other being March); four more meetings remain. Pre-FOMC meeting this week, futures were pricing in 70 percent odds of another 25-basis-point hike in September (25-26). Post-meeting, the odds jumped to 82 percent, with December (18-19) now at 53 percent.
Ten-year Treasury yields Wednesday responded to this by rising a couple of basis points to 2.98 percent. They are still below the intraday high of 3.12 percent from May 17, which was the highest since July 2011. (Chart 1 is a little misleading in that it uses month-end data. Despite the intraday high in May, the month closed at 2.82 percent.)
In contrast, two-year T-yields, which reflect markets’ expectations for Fed monetary policy, jumped five basis points Wednesday to 2.59 percent – the highest since July 2008. Consequently, the spread between 10- and two-year yields contracted three basis points to 39 basis points – the narrowest since August 2007. Go figure!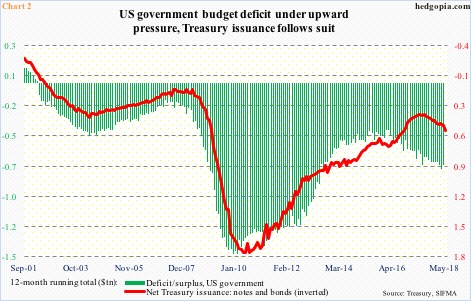
The yield curve’s behavior comes amidst two pronounced tailwinds for the long end.
The US economy is two weeks short of completing nine years of recovery. Subdued yes, but a recovery nonetheless. Throughout all this, the US government ran a deficit. In fact, since bottoming at $403.6 billion in January 2016, the 12-month running total of deficit has trended higher, with April at $706.8 billion.
In all probability, this likely gets worse. The Tax Cuts and Jobs Act of 2017, signed into law last December, is a $1.5-trillion tax-cutting package. This was followed by a $300-billion federal spending increase. Treasury issuance is headed higher. In May, on a 12-month basis, $494 billion was issued in notes and bonds, up from $335 billion last July (Chart 2).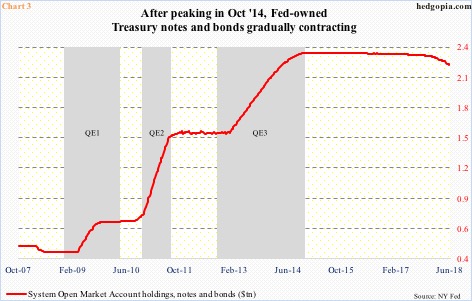
The other tailwind comes courtesy of the Fed. Post-financial crisis, its balance sheet ballooned. In November 2008, when the first iteration of QE got underway, SOMA (System Open Market Account) holdings were just south of $500 billion. By April 2017, they stood at $4.24 trillion. They are currently just south of $4.1 trillion. Albeit in small amounts, the Fed is unwinding its balance sheet. In October 2014, the QE was stopped, in the sense that the bank was no longer buying bonds, only reinvesting proceeds of maturing assets.
As a result, the Fed currently holds $2.22 trillion in Treasury notes and bonds, versus a peak of $2.35 trillion in October 2014. The red line in Chart 3 is gradually rolling over. When the Fed was buying, it was artificially creating demand for these instruments, pushing down yields. Now that demand, if not completely gone, is increasingly less.
With this as a background, many find it a head-scratcher the way 10-year yields are acting. Bond bears were hoping that the 10-year rate would continue to build on momentum since bottoming at 2.03 percent last September. In fact, these yields did break – albeit faintly – out of a three-decade-old descending channel. But building on it has proven tough. The Fed Wednesday gave the bears another opportunity, but the latter more or less fumbled.
Thanks for reading!
