
With investor sentiment elevated and help from the Fed, margin debt and foreigners, major US equity indexes remain near highs. Bulls are positioning for a Santa rally, followed by the onset of 4Q earnings season in the first half next month. How stocks behave leading up to/during this will be a tell as to if unwinding of overbought conditions begins sooner than later.
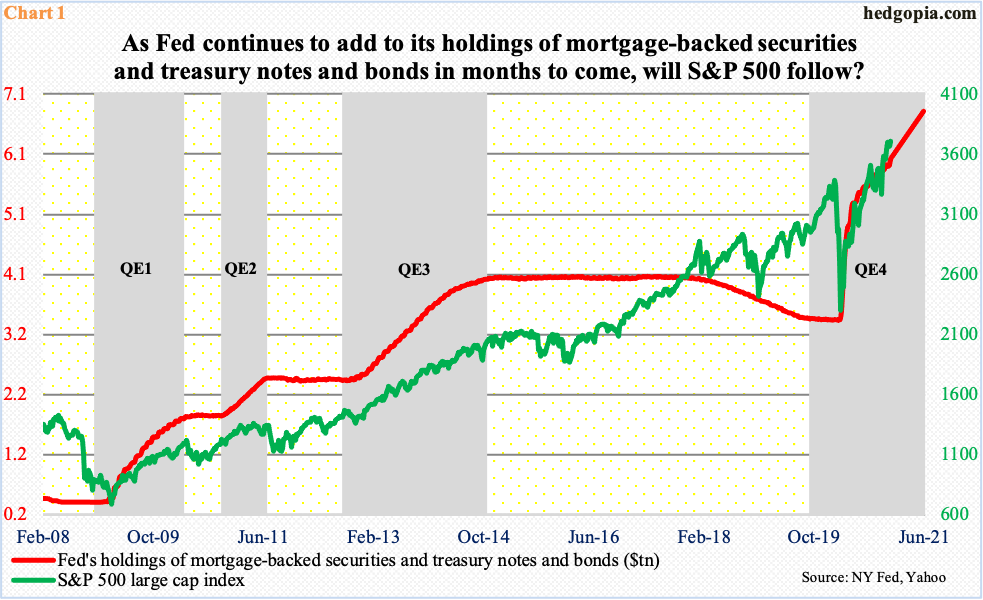
As of last Wednesday, the Fed held $7.36 trillion in assets, up $3.2 trillion in the past 10 months. In between, holdings of mortgage-backed securities and treasury notes and bonds went from $3.40 trillion to $6.04 trillion.
Since March, the Fed has an open-ended quantitative easing (QE) program in place. Speaking to the press at the end of the year’s last FOMC meeting last Wednesday, Chair Jerome Powell said the central bank would adjust its QE if the need be, but for now would purchase at least $120 billion/month in US treasury bonds and mortgage-backed securities. At this pace, these assets are on pace for $6.82 trillion in the next six months.
This could have implications for stocks – at least equity bulls hope so. During the financial crisis, there were three iterations of QE, with the first getting underway in December 2008. During each of these, the S&P 500 closely tracked the beginning and end of QE. Even this year, after a nasty sell-off in February and March, the large cap index (3709.41) bottomed on March 23 at 2191.86; even though its balance sheet had been trending higher since September last year, the Fed announced its unlimited QE on that precise date.
Hence the question, will the red line follow the green line in Chart 1 higher in months to come?
Investor optimism remains elevated. The central bank’s aggressive purchases of these securities is not the sole reason for this but it cannot be hurting either.
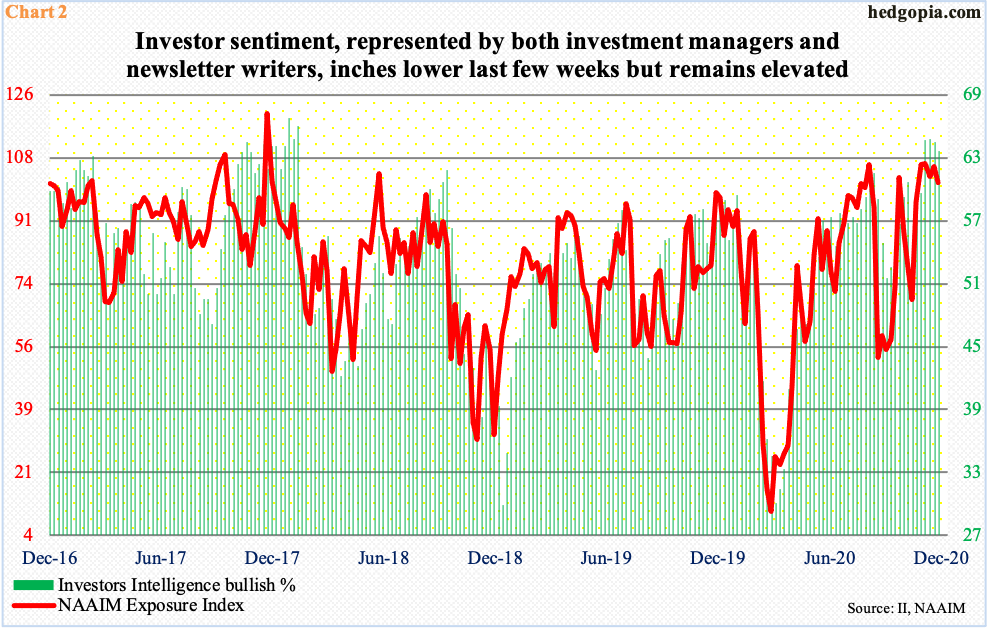
Chart 2 plots investor sentiment reflected in how newsletter writers and professional money managers feel currently, with the first measured by Investors Intelligence’s survey and the latter by National Association of Active Investment Managers’.
In the week to last Tuesday, Investors Intelligence bulls fell eight-tenths of a percentage point week-over-week to 63.6 percent, but this was the fourth straight weekly reading north of 60 percent. Two weeks ago, bulls were 64.7 percent, which was the highest reading since late January 2018.
Similarly, in the week to last Wednesday, the NAAIM Exposure Index, which measures members’ average exposure to US equity markets, dropped 4.6 points w/w to 101.5, but this was the fifth consecutive weekly reading of 100-plus. Going back to July 2006, there have only been 25 100-plus readings, with nine of them just in the past four months.
Arguably, if these investors are not already all in, they could be getting close.
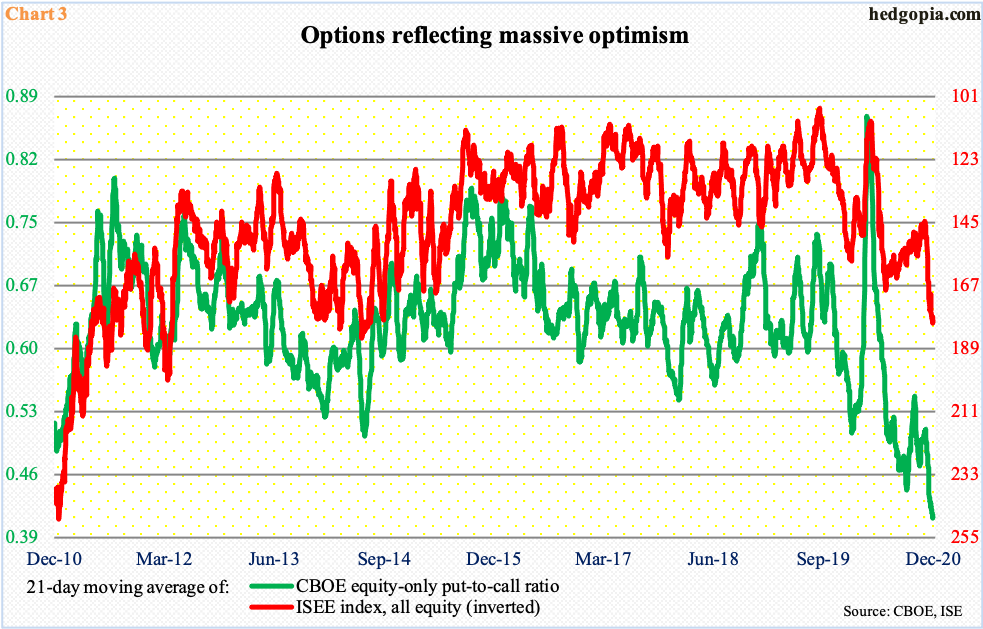
As things stand, greed is pervasive. At the same time, to give credit where credit is due, it has been right to be greedy in the current circumstances. Buying calls have persistently paid off. And bulls are doing exactly that – in record numbers.
The 21-day moving average of the CBOE equity-only put-to-call ratio made a new all-time low of 0.407 last Thursday. The ISEE index (all equity), which is a call-to-put ratio hence inverted in Chart 3, is not quite at a new low but has gone parabolic since mid-November. Many consider ISEE cleaner than the CBOE put-to-call ratio, as it excludes trades from market makers and brokers/dealers and only uses opening long trades. Market makers need to hedge exposure all the time; retail, on the other hand, bets on direction.
For a contrarian, this level of optimism in and of itself is a warning sign. Unwinding is a matter of when not if, although if past is prelude overbought can always get more overbought.
This is particularly so considering we are in a seasonally favorable period. In fact, this seasonality factor could very well be feeding on itself right now. The strategy will work until the last buyer puts in his bid.
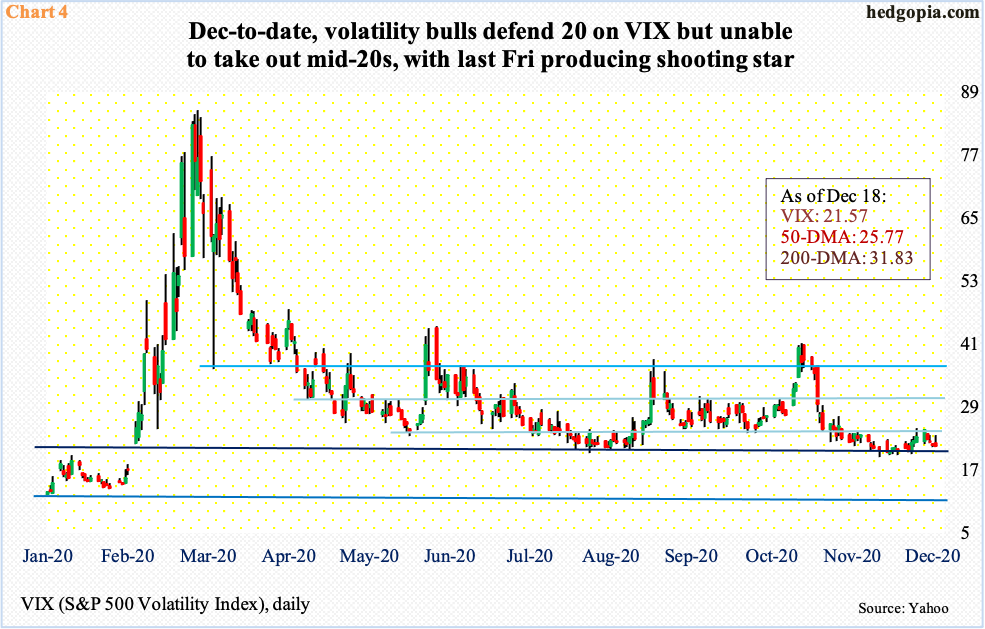
Last Friday, there were signs traders were getting ready for a Santa rally. VIX just got crushed in the last 20 minutes – down 2.02 to end the session with a shooting star at 21.57 (Chart 4). Earlier on Monday, the volatility index – once again – was denied at mid-20s.
Early this month, volatility bulls defended 20 several times. From their perspective, it is important that it holds. Ahead of this, non-commercials raised their net shorts in VIX futures to a 43-week high (chart here). They are hoping for a lower VIX in the sessions/weeks ahead.
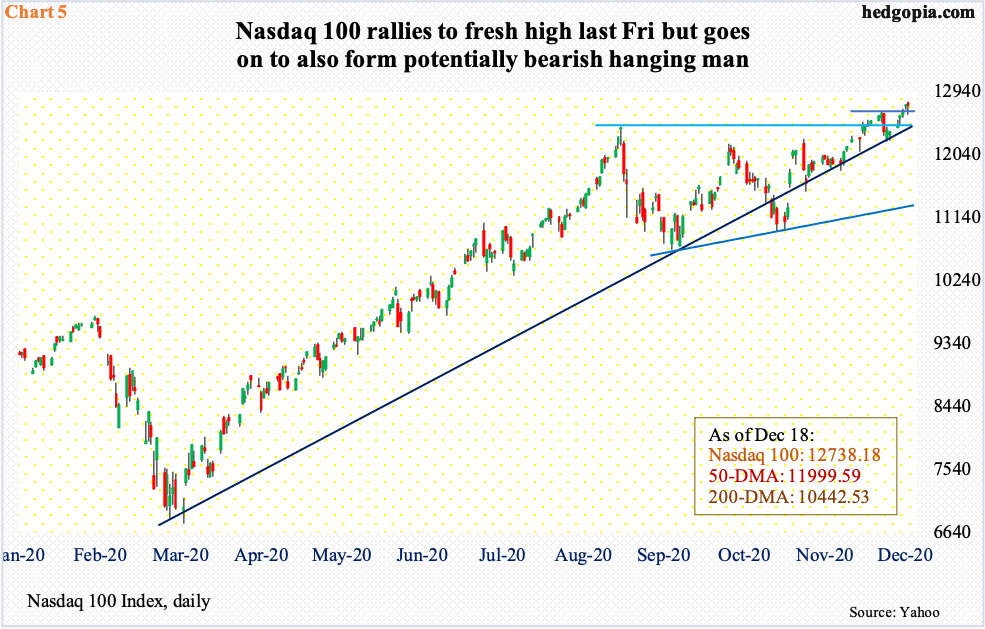
Along the same lines, the Nasdaq 100 index (12738.18) last Friday rallied one percent in the last 20 minutes to end the session down only 0.1 percent. Be that as it may, the session produced a potentially bearish hanging man even as a new high of 12793.47 was hit (Chart 5).
How tech behaves in the remaining sessions of the year and early next year is important. The sector outperformed massively since bottoming in March. This changed on November 9 when Pfizer (PFE) announced its positive vaccine news, subsequent to which investors gravitated toward small-caps. On a relative basis, the latter continue to lead.
For markets’ overall health, tech cannot afford to lag much longer as it is home to the largest five US companies, among others. This will matter particularly in market cap-based indexes such as the S&P 500 and the Nasdaq 100.
How they behave in the next couple of weeks is also important because the 4Q20 earnings season begins in the first half next month. Ahead of this, the revision trend has improved.
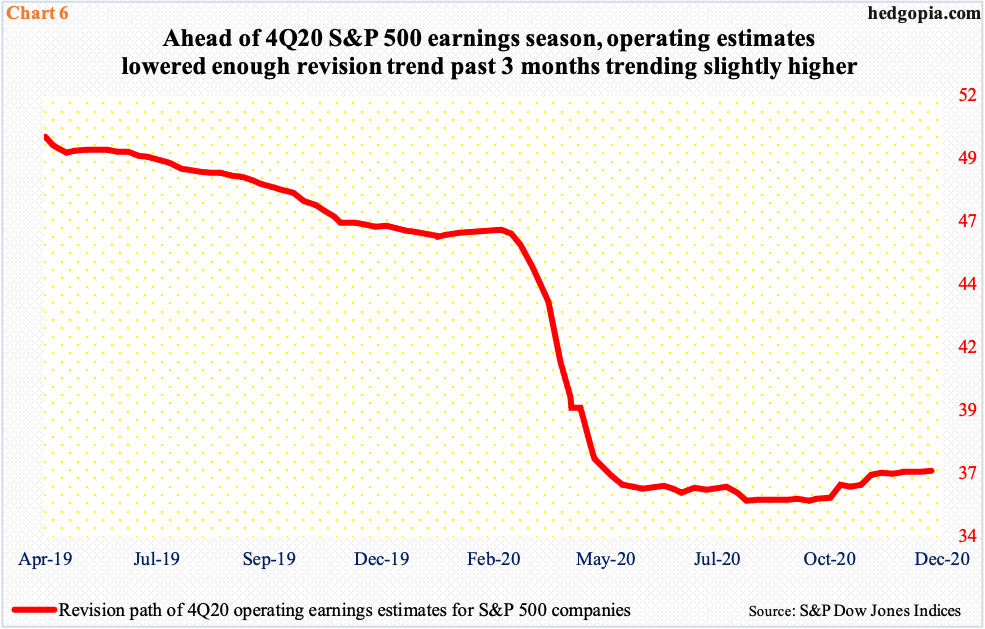
In April last year, the sell-side expected S&P 500 companies to earn $49.85 in the current quarter. Customarily, estimates trended lower until March this year when they nose-dived, before bottoming late September at $35.43 (Chart 6). Since that low, the trend has slightly reversed higher, with the consensus reaching $36.62 as of last Wednesday.
The revision trend has also improved for 2021 as a whole – $160.89 expected mid-July this year versus $166.63 as of last Wednesday. If realized, this will have meant growth of nearly 38 percent over this year’s expected $120.81.
A lot of this earnings optimism is obviously in the price, given the massive rally since March. How stocks behave in the next several weeks can be a tell as to if there is room left for squeezing more gains.
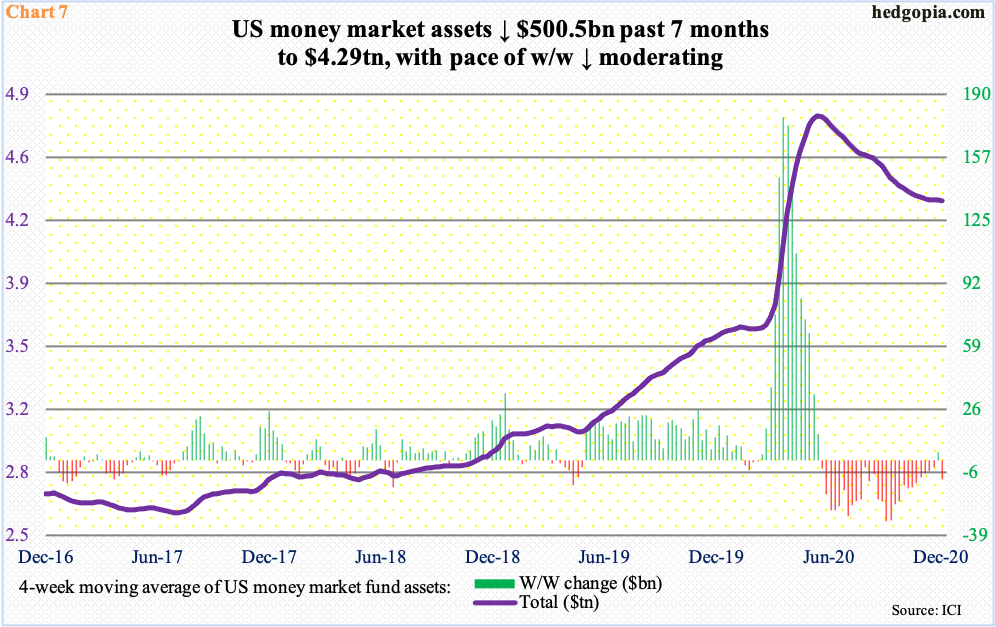
Equity bulls have high hopes for the so-called cash-on-the-sidelines. In the week to March 25 when US stocks bottomed, US money-market assets were $4.22 trillion. But it was not until the week to May 20 these funds peaked at $4.79 trillion. Since then, they have come down by $500.5 billion. This is good. However, from the May high through last Wednesday, US-based equity funds saw redemptions of $88.2 billion, even as taxable bond funds took in $213.7 billion, investment-grade corporate funds $172.4 billion and high-yield funds $24.7 billion, among others (courtesy of Lipper).
Continued decline in these parked funds leading to stocks eventually getting their fair share will create a perfect scenario for equity bulls. The risk is a reversal of the seven-month trend. Chart 7 uses a four-week moving average and it does show a flattening tendency the last few weeks.
Then, there is the issue of corporate buybacks, which have now turned into a heavy headwind.
In 3Q, S&P 500 companies spent $101.8 billion in buying back their own shares. In any normal quarter, this would probably be regarded healthy, but looks paltry relative to how they were splurging not too long ago.
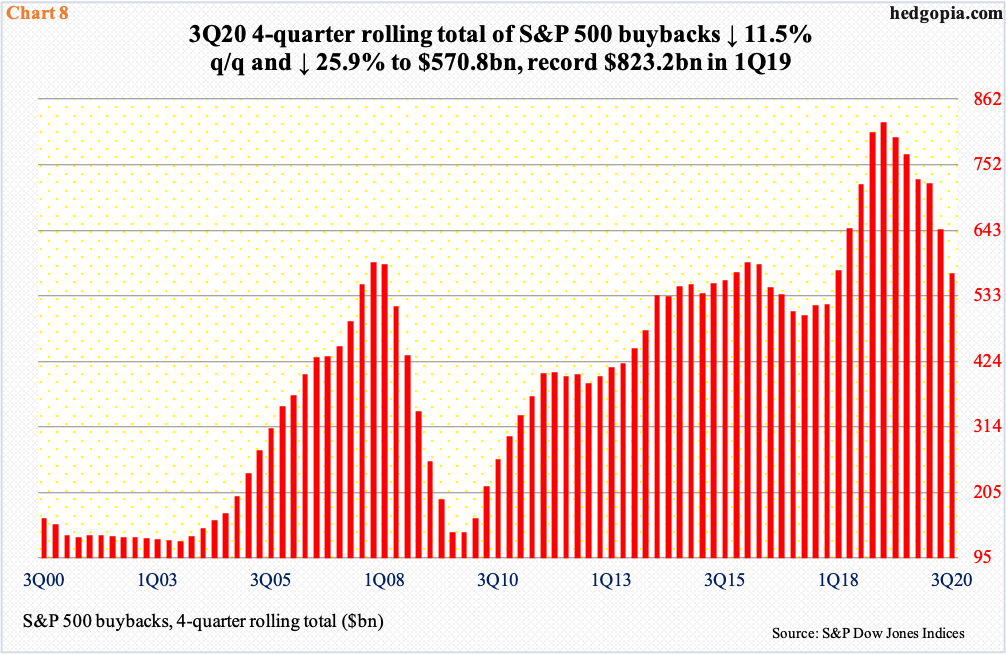
In 4Q18, buybacks totaled $223 billion – the most ever – for a yearly record of $806.4 billion. A four-quarter record was set in 1Q19 with a total of $823.2 billion. On that basis, buybacks were $570.8 billion in 3Q20, down 11.5 percent quarter-over-quarter and down 25.9 percent year-over-year (Chart 8).
The bottom line: buybacks are no longer a tailwind. Margin debt has been the last several months (chart here), while foreigners have been aggressively raising exposure to US stocks, although it is beginning to look lop-sided (more on this here).
Amidst extended conditions and multi-pronged dynamics, bulls are wondering if overbought can get more overbought.
Thanks for reading!
