
Major US equity indices continue to attract bids and are trading at fresh highs. Greed rules, with several metrics at nosebleed levels. In a seasonally favorable period, crazy can get crazier – at least that is what bulls hope. How VIX and gold trade going forward will provide further clues to where various assets might be headed near term.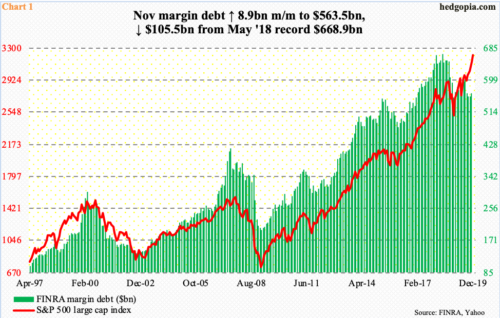
In November, the S&P 500 large cap index rallied 3.4 percent. This was the third consecutive positive month. With five and a half more sessions left, December is up another 2.6 percent, to a fresh new high. For the year, the index is up 28.5 percent! All this, without much help from margin debt.
Through November, FINRA margin debt is only up $9.2 billion this year, to $563.5 billion. It is in fact down $105.5 billion from May 2018 when it recorded its highest ever $668.9 billion. Despite the record high stock prices, margin debt refuses to toe the line.
Historically, margin debt and the S&P 500 have shown a tendency to move together (Chart 1). This time around, the two have decidedly diverged – particularly this year.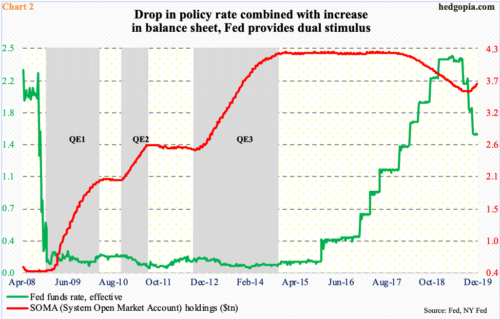
Until not too long ago, we could have said the same thing about foreigners’ buying – or a lack thereof – of US stocks. In the 12 months to April this year, they were selling as much as $214.6 billion worth – a record. Since then, they have substantially reduced the amount of selling, with October seeing selling of $58.1 billion. In other words, what has been a headwind since January last year has turned into a tailwind. Buybacks, on the other hand, have provided a tailwind for a while now, and this continues – albeit at a less frenetic pace. In the 12 months to 3Q19, S&P 500 companies spent $770.1 billion in share buybacks, down from $798 billion in the prior quarter and a record $823.2 billion prior to that (more on this here).
Of late, the Fed, too, has been a source of tailwind. This year, it cut the fed funds rate three times in 25-basis-point increments, to a range of 150 to 175 basis points. At the same time, until recently, it had been cutting back the size of its balance sheet, which ballooned to a gigantic size post-financial crisis. In April 2017, SOMA (System Open Market Account) holdings peaked at $4.24 trillion, which by September this year had been cut down to $3.55 trillion. Since that low, in order to deal with money-market stresses that reared its head toward the end of September, the Fed has been aggressively buying Treasury bills, with SOMA holdings now at $3.7 trillion (Chart 2). Arguably, stealth QE is in progress.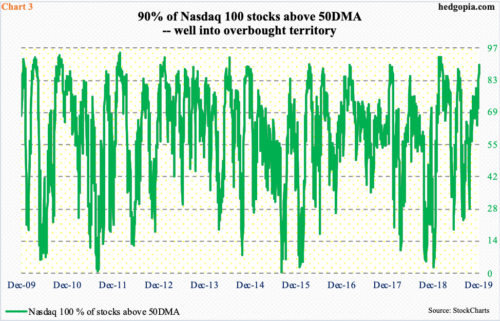
Markets love liquidity. The Fed’s balance sheet has grown at a time when investor mood traditionally tends to be chirpy. Several metrics as a result have been driven to outright greedy levels.
The Nasdaq 100 index has rallied huge since bottoming early October. Through Friday’s fresh high, it is up north of 16 percent. That is in less than three months! The good thing is that participation in healthy in this rally. Granted the index is heavily weighted toward the likes of Apple, Google, Microsoft and Amazon, but the fact remains that 90 percent of stocks are above the 50-day moving average. The not so good in all this is precisely that fact. Historically, this metric peaks in the 90s (Chart 3).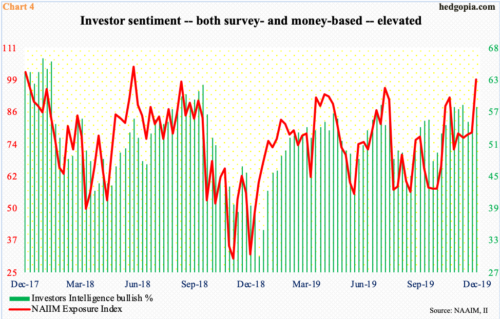
Greed is also beginning to get reflected in Chart 4, which plots Investors Intelligence’s bullish percent with the NAAIM Exposure Index. The former is based on independent advice from newsletter writers, while the latter represents National Association of Active Investment Managers members’ average exposure to US equity markets.
Last week, Investors Intelligence bulls rose 4.4 percentage points week-over-week to 57.7 percent, while bears were 17.1 percent. This was the eighth week in a row the bulls-to-bears ratio came in north of three.
The NAAIM Exposure Index concurrently jumped 20.2 points w/w to 98.9, which is the highest since June 2018. It is rare for the index to cross 100 and stay there.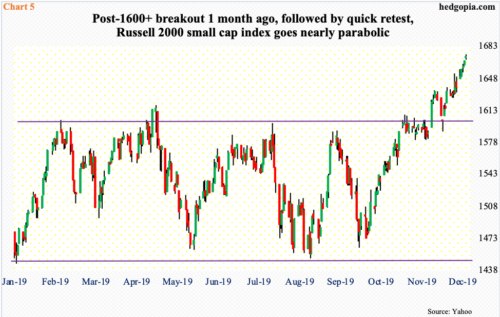
Of late, bulls have been further encouraged by how small-caps have behaved. For too long, the Russell 2000 small cap index (1671.90) remained bound by horizontal resistance just north of 1600.
The index peaked in August last year at 1742.09, then bottoming last December at 1266.92. The rally since got stopped in February, then four more times before the index broke free a month ago (Chart 5). This was quickly followed by a retest, and then a persistent grind higher.
In a perfect scenario, breakout traders could be eyeing the record high from August last year if the measured price objective of last month’s range breakout were to be fulfilled. It is difficult to put odds on this – either for or against. As pointed out earlier, things are stretched – way too stretched – but it is also a seasonally favorable period. Crazy can always get crazier.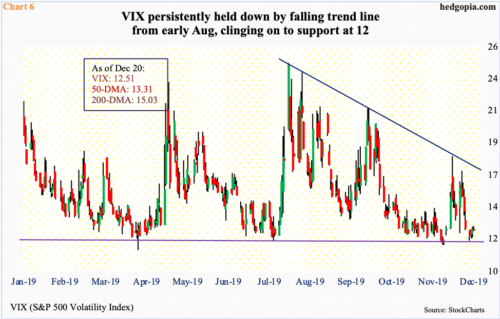
In this regard, Charts 6 and 7 are worth watching for additional signals.
Volatility remains suppressed. As recently as nine sessions ago, VIX (12.51) tagged 16.90 intraday. Monday last week, it once again dipped below 12 intraday before closing higher. Support at 12 is holding. Last week, the S&P 500 rallied 1.7 percent, even as VIX was only down 0.12. But the volatility index remains below all major averages. Rally attempts have been consistently denied at a falling trend line from early August when VIX peaked at 24.81. This trend line does not get broken until 17 is reclaimed (Chart 6). Given where the volatility index sits currently, it likely will be a while before that happens, particularly if 12 is lost. In this scenario, there is support at 10-11. The all-time low of 8.56 was recorded in November 2017, a year in which VIX routinely traded with a nine handle.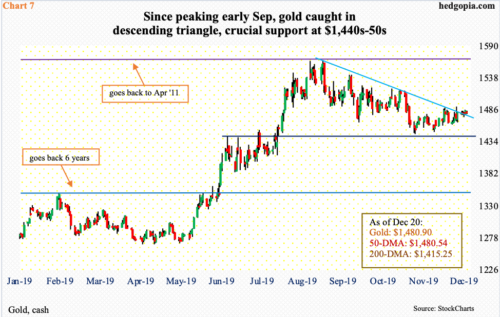
Gold ($1,480.90) is the next one to watch. The metal has been trading within a descending triangle since peaking at $1,566.20 early September. Resistance at $1,560s goes all the way back to April 2011.
For nearly four months now, rally attempts have been consistently denied at a trend line from the September high (Chart 7). Concurrently, support at $1,440-50s has held firm. For three weeks now, gold has lingered around the trend-line resistance in question. A rally past $1,480s opens the door to a test of $1,520s, and, hopefully for gold bugs, the September high.
Nevertheless, a descending triangle typically is a continuation pattern. The daily is beginning to act like it wants to go lower – at least near term. In the event the metal comes under pressure, there is trend-line support at $1,455-70, and after that of course $1,440s-50s. A drop in gold, which is typically considered a risk-off asset, can lead the aforementioned greed to persist – duration and magnitude notwithstanding.
Thanks for reading!
