
U.S. small-caps have been through a lot in recent months. Chart 1 says it all. Will that change following Tuesday’s huge reversal?
Since the Russell 2000 Index (1224.6) broke the mid-October 2014 trend line toward the end of April, it has struggled to really get going. That breakdown, however, could not inflict severe damage as buyers stepped in to defend the March 2014 horizontal support. The Russell 2000 then went on to rally along the underside of that broken trend line, followed by a false breakout. Subsequently, another rally attempt was stopped right where the bears would have liked to – near the late-April high.
In the process, the index carved out a head-and-shoulders pattern for itself. The neckline coincides with that March 2014 horizontal support, which also approximates the 200-day moving average. The index was literally sitting on it on Monday. A make-or-break time for small-cap bulls! A break of the neckline can potentially result in a drop to 1150ish.
The 1215 level, once broken out of in February, stopped two pullbacks – one each in March and May. Currently it is being tested the third time.
Tuesday, it was saved one more time – in an impressive manner, one might add.
Yesterday, early weakness in the first half an hour was bought hand over fist. In the end, the session produced a hammer – in an outside reversal day.
Shorts probably lent a helping hand.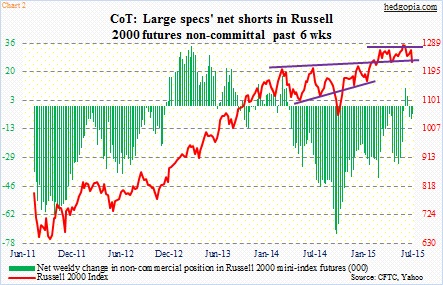
Over in the futures pit, non-commercials of late have shown an indifferent attitude toward the Russell 2000. Last week, they were net short 4,500 contracts (Chart 2). As early as two months ago, they were net short nearly 33,000 contracts. In the past six weeks, they have been going back and forth between being net long and net short – not seriously committing themselves one way or the other.
The same can be said of short activity on IWM, the iShares Russell 2000 ETF. Most recently, short interest has been in decline since late-May (Chart 3). The mid-July count of 109 million is higher than the one-year low of 89 million mid-February, but substantially less than August-October levels of last year. Back in the middle of October last year, when stocks bottomed, short interest was 155 million, which then dropped all the way to the mid-February low. As shorts got squeezed, the Russell 2000 shot up nearly 18 percent during the period. This fuel is lacking currently. Sure, shorts were probably forced to cover yesterday, but their count is not high enough to put sustained upward pressure on the ETF.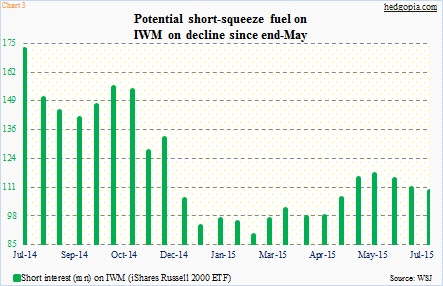
So what might have driven the rally yesterday?
The significance of that neckline/support was not lost on the bulls. Daily momentum indicators were already pushing into oversold conditions. As well, the index was sitting on the lower Bollinger band. This was as good a time as any to put their foot down.
As early as Monday, even as the Russell 2000 fell 0.9 percent to close near the session lows, RVX, the Russell 2000 Volatility Index, was unable to close near the highs (Chart 4). Once again, the 18.50ish resistance, came in the way. That level also coincides with the 200-day moving average (18.77).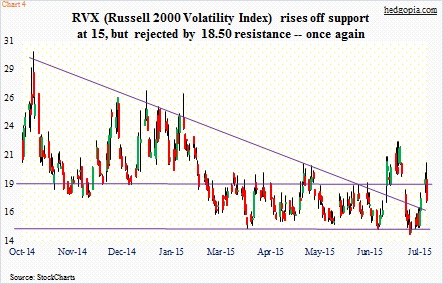
So to answer the rhetorical question in the opening paragraph, it is too soon to say if Tuesday’s reversal guarantees small-caps’ medium- to long-term health. Short-term is another matter. It does not take a whole lot for sentiment to improve in the near-term.
With this in mind, here is a hypothetical trade on IWM ($121.61). Weekly August 7th 120.50 puts fetch $0.93. The idea is to collect the premium at best or effectively go long at $119.57 at worst. IWM’s 200-day moving average lies at $119.94. Bulls likely will fight tooth and nail to save this support – at least near-term.
Thanks for reading!
