“…I want to solve health care, jobs, border control, tax reform.”
The above quote is from a weekend interview president-elect Donald Trump gave to the Wall Street Journal.
The article also talks about his willingness to keep parts of the Affordable Care Act, also known as Obamacare.
One of the platforms Mr. Trump ran on was repealing the healthcare act. Now, he is talking about a possible compromise. During the campaign, he also promised to levy a 45-percent tariff on Chinese imports as well as a 35-percent tax on car imports from Mexico – both inflationary if it comes to pass.
He also promised to deport the 11 million undocumented immigrants that are currently in the U.S. Deporting these many people is a huge undertaking, for sure to put upward pressure on the federal budget. Plus, Americans need to be (1) willing and (2) available in sufficient numbers to replace these immigrants in the workplace. There is already a shortage of construction workers, for instance. In other words, should deportation take place, it is inflationary.
Logic hence tells us that Mr. Trump in due course is likely to shift position on these promises – the way he already seems to have done as relates to Obamacare.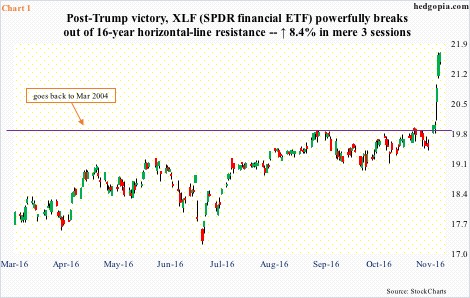
Stocks rallied big last week, with the S&P 500 large cap index up 3.8 percent – a vote of confidence for Trump victory. Several sector/industry ETFs – supposed beneficiaries of Trump policy – have had eye-popping pops.
XLF, the SPDR financial ETF, jumped 11.2 percent last week. During the campaign, Mr. Trump did not talk much about financial regulation, but has said he would like to get rid of Dodd-Frank. Hence the rally in financials, and it is a powerful one.
Just look at the right side of Chart 1. Resistance at $20 goes back to March 2004, and it got taken out. That said, there is a long way to go before it reaches a new all-time high, which was scored in May 2007 at $25.51, versus $21.67 last week.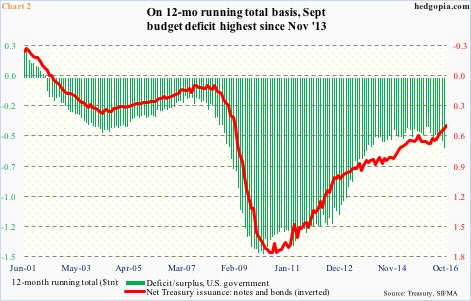
In due course, if Mr. Trump deviates too much from his campaign promises, this potentially reverberates through congressional elections in two years. Currently, the Republicans control both the senate and the house. Along the same lines, there are many Republicans that have won their congressional seats promising budget discipline – so-called deficit hawks.
On a 12-month rolling total basis, the federal deficit has been rising since January this year – from $405.3 billion to $587.4 billion in September. But versus the post-Great Recession peak, it has improved a lot. Deficit was as high as $1.5 trillion in February 2010 (Chart 2). To keep up with this, issuance of Treasury notes and bonds was as high as $1.7 trillion in June that year. In October, issuance was $476 billion.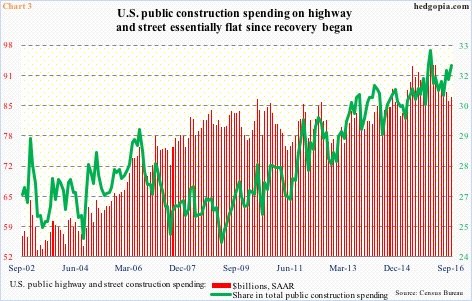
This likely changes in the Trump administration.
He has talked about the need to invest in infrastructure, and, truth be told, it is needed – badly.
When Great Recession ended in June 2009, public construction spending was at a seasonally adjusted annual rate of $321 billion. It peaked the very next month at $322.6 billion. September this year came in at $270.3 billion. Spending has gone nowhere – or gone down.
Similarly, spending on highway and street stood at $82.9 billion in June 2009. In September this year, this was $86.6 billion. As a result, the share of highway and street in total spending has risen over the years, but on an absolute basis, remains suppressed (Chart 3). Be it water supply or sewage or power, it is the same trend.
Mr. Trump has said he wants to rebuild U.S. infrastructure that costs at least double the amount proposed by Ms. Clinton. The latter’s plan was estimated to cost $275 billion over five years. It is worth noting that Mr. Obama’s call for setting up a national infrastructure bank went nowhere for lack of Republican support. It is not going to be easy for Mr. Trump to bring Republican deficit hawks on board.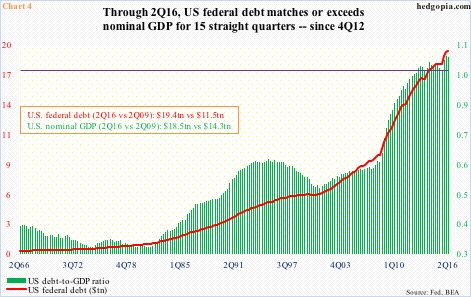
This is particularly so given the nation’s debt load.
In 2Q09, when Great Recession ended, the federal debt was $11.5 trillion. Seven years later, it ballooned to $19.4 trillion. This in the midst of a recovery – subdued, but recovery nonetheless.
As a result, with nominal GDP of $18.5 trillion in 2Q16, the debt-to-GDP ratio surged to 1.05. For the 15 quarters through 2Q16, the ratio has been north of 100 percent (Chart 4). For reference, when Mr. Ronald Reagan began his presidency, the debt-to-GDP ratio stood at 0.31 (4Q80), and had room to rise. Not so now – it is already unsustainable.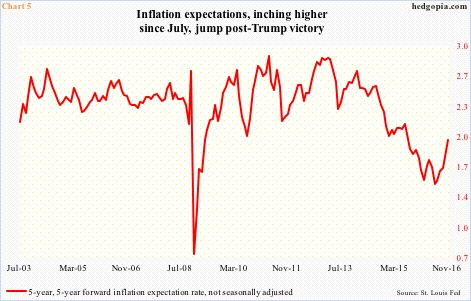
Markets sniff inflation.
From imposing tariffs on imports to building a wall along the Mexican border (Mexico already said it would not pay for it) to infrastructure spending, markets perceive a rise in inflation. The yield curve has steepened, with the 10-year yield jumping 25 basis points in the last three sessions last week.
(In a 60 Minutes interview on Sunday, he said a wall will be built, with possibly some fencing. On deportation, he said he would focus on those with criminal records – probably two to three million strong. And on Obamacare, he said it will be repealed and replaced, with some parts left intact.)
Inflation expectations are on the rise (Chart 5). By Wednesday last week, the five-year, five-year forward inflation expectation rate had risen to just under two percent, although it is rising from a very suppressed level (Chart 5).
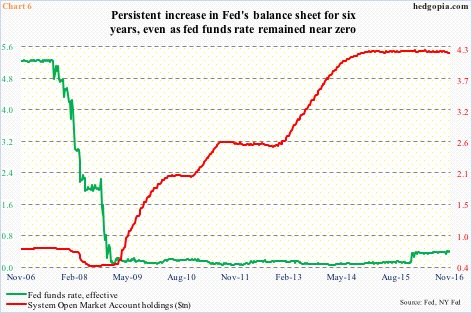
Market participants hope that this should all give the Fed a cover to hike – not only in December, but several more after that. Rates have stayed zero-bound for eight years now, even as the Fed’s balance sheet has ballooned (Chart 6). Despite all this monetary stimulus, the economy remains sub-par.
Amidst all this has come the idea of infrastructure spending. Stocks have reacted, with XLI, the SPDR industrial ETF, rallying 8.1 percent last week and XLB, the SPDR materials ETF, up 3.8 percent. Markets are betting the monetary-to-fiscal transition will be successful.
In this respect, is the enthusiasm premature? How soon before markets shake off this post-election frenzy? The price action is good, and we should respect that. At the same time, it is a risky proposition to expect Mr. Trump to fulfill his infrastructure-spending promises in its entirety.
Charts 2 and 4 in this regard are worth paying attention to. We will hear a lot about deficit and debt in the weeks and months to come.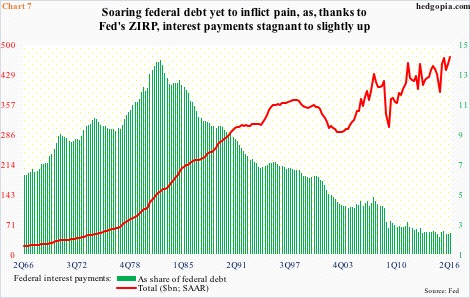
Side note: In 2Q16, federal interest payments were $471.7 billion (SAAR), about on par with $456.6 billion five years ago. This despite the fact that federal debt went up by over $5 trillion during the period. What made the difference? The 10-year yield was more than cut in half from 3.2 percent to 1.5 percent. As a share of federal debt, interest payments were merely 2.4 percent in 2Q16 (Chart 7). If this rises by merely one percentage point, we are talking an additional $187 billion in interest payments.
The point is, rates cannot rise much given the debt load, which is what would happen if inflation picks up steam.
Thanks for reading!

