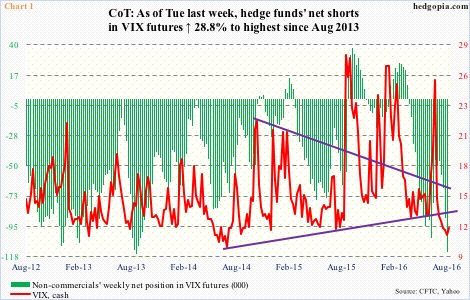
Back in 2013, by August 20th, non-commercials had built 116,317 contracts in net shorts in VIX futures. In the next 10 weeks (by October 29th), net shorts dropped to 39,673 (Chart 1). Intra-day, spot VIX jumped from 11.83 on August 5th to 21.34 on October 9th.
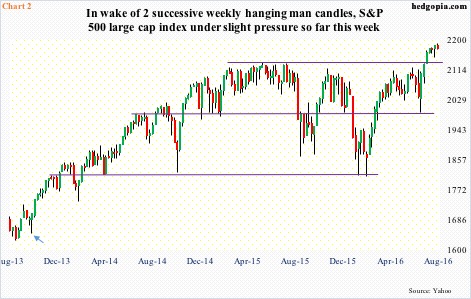
Correspondingly, the S&P 500 dropped from 1709.67 on August 2nd that year to 1627.47 on August 28th, followed by a rally to 1729.86 on September 19th and then a drop to 1646.47 on October 9th (arrow in Chart 2). The August 2nd peak on the S&P 500 preceded a 9.6-percent rally over five weeks, with spot VIX dropping from just under 22 to just under 12.
Fast forward to Tuesday last week when the CoT data revealed that non-commercials were net short 114,603 contracts – the highest since August 2013.
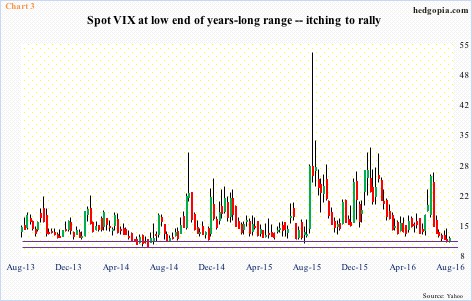
As was the case in 2013, spot VIX has been under pressure in the past several weeks – as a matter of fact right after it hit 26.72 intra-day on June 27th. That was the post-Brexit spike high. On Tuesday, it dropped to 11.02 – the lowest since August last year (Chart 3).
As was the case back then, the S&P 500 rallied 9.8 percent in the past six weeks, and is overbought on pretty much all timeframes. The momentum is not broken, but the index is beginning to struggle to maintain it.
What are the odds the S&P 500 meets the same fate – down in this case – as it did in 2013 in the next several weeks? Pretty decent.
There is not a whole lot to like looking at spot VIX’s daily chart. Both 50- and 200-day moving averages are pointing lower. Last week, it looked like a bullish crossover between 10- and 20-day moving averages was imminent, but that was denied. Rally attempts have been persistently sold in particularly the past couple of weeks.
That said, there is this. The 10-20 crossover once again looks imminent. In the past four sessions, VIX has found support at the lower Bollinger band. Importantly, it is at the bottom of a multi-year range (Chart 3). Support at 11, or sub-11, is solid. From these levels, risk-reward tradeoff favors a rise in volatility than a drop.
The volatility curve suggests as much.
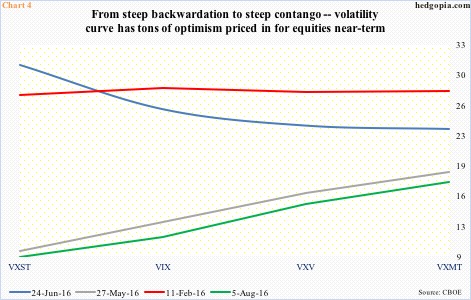
The VXST (nine days)-VIX (30 days)-VXV (three months)-VXMT (six months) curve is in steep contango. The green line in Chart 4 uses closing prices as of last Friday, and looks similar in structure to the one on May 27th, just a few sessions prior to a high in the S&P 500 that ultimately culminated in the post-Brexit sell-off. By June 24th, the grey line (contango) had given way to the blue (backwardation).
As in most other things in life, these things move in cycles. In due course, the curve will transition to backwardation, and then back on to contango again – from one extreme to the other.
Non-commercials’ huge net shorts in VIX futures is just a sign there is too much money betting on continuation of volatility suppression/rally in the S&P 500. The sentiment balance is way tilted on the optimistic side – time to play contrarian.
Thanks for reading!

