
In its rather brief history going back to January 1990, out of 6,725 sessions, there have only been 10 times when spot VIX jumped 40 percent or higher in a single session. That is how rare it is! Last Friday was one such occasion.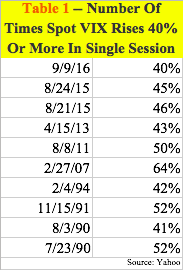
The 40-percent threshold, in and of itself, cannot be treated as a signal. In August last year, there were back-to-back 40-percent jumps on August 21st and 24th (Table 1), with the spot surging from an intra-day low of 12.8 on the 14th to an intra-day high of 53.29 on the 24th.
But a jump of this magnitude is also a time to be looking out for signs of reversal, at least near term. Should Monday’s session be treated as one?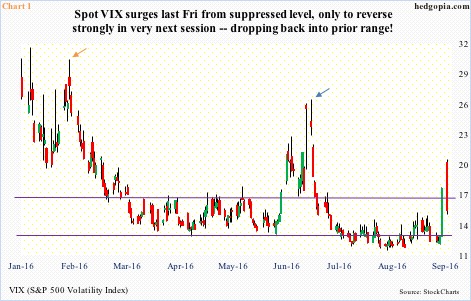
More often than not, spot VIX has shown a tendency to spike and then reverse – reverse hard. In Chart 1, the orange arrow represents the spike reversal on February 11th, the blue on June 27th; the S&P 500 large cap index bottomed on both those dates.
On Monday, VIX rallied another 17 percent before reversing, closing the session down 13.4 percent. The 200-day moving average was lost as soon as it was recaptured, but the spot remains above the 50-day, which is now flat.
Is this reversal potentially as powerful as on the aforementioned dates? Possibly near term, but probably not medium term. Yesterday, VIX barely crossed 20 before coming under pressure.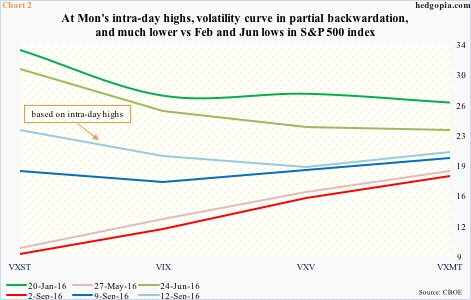
The red line in Chart 2 shows how steep contango was on September 2nd – similar to how it looked on May 27th this year. From equities’ perspective, this signifies complacency – at least short term.
For decent bottom in equities, the VXST (nine days)-VIX (30 days)-VXV (90 days)-VXMT (six months) volatility curve needs to transition to backwardation – the kind witnessed on January 20th and June 24th this year. Both preceded the low in the S&P 500 on February 11th and June 27th. From those lows through recent highs, the Index rallied 21 percent and 10 percent, respectively.
Last Friday, VXST popped nearly 71 percent, but because VXMT managed to rally nearly 11 percent, most of the curve was still in contango (blue line in Chart 2). On Monday, pre-open and right out of the gate in regular session, volatility continued to sell off, but soon peaked. All four gave back early gains and ended with solid red candles.
Using Monday’s close, the curve looks similar in shape to the blue line, only it shifts slightly lower (not shown in Chart 2). But using intra-day highs (light blue), the curve looks a lot different – very close to backwardation except for VXMT. That said, the curve has shifted much lower, probably implying that volatility has not risen enough for decent bottom in stocks – along the lines of February and June bottoms.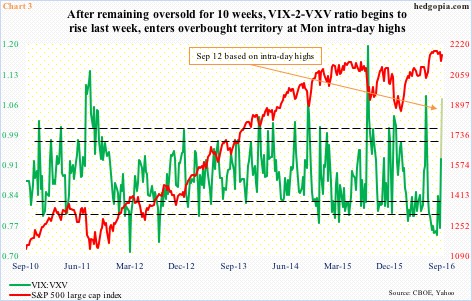
A similar message is probably coming from the VIX-to-VXV ratio.
In Chart 3, the ratio uses weekly closes. After 10 long weeks of languishing in oversold territory – seven of them in mid- to high-.70s – it shot up last week from .765 to .929. The ratio dropped to .878 on Monday, but the picture changes if we use the session highs, which is what the light green portion in the chart shows.
At Monday’s highs, the ratio jumped to 1.07. Near term, this probably opens up room for the ratio to head lower, but risk of increased volatility medium term remains.
Thanks for reading!
