
Both the S&P 500 and VIX closed lower last week. This occurred even as the major US equity indices are at/near decent/major support. Right here and now, odds favor the bulls than the bears.
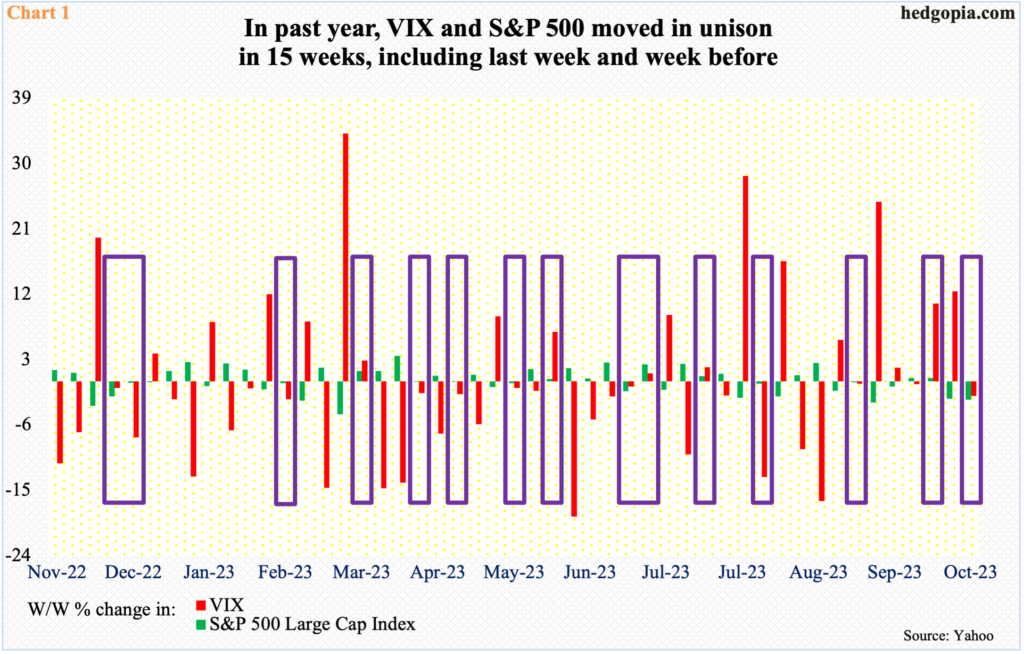
Last week, both the VIX index and the S&P 500 headed lower, with the former down 0.44 to 21.27 and the latter down 2.5 percent to 4117. This does not happen often. The two tend to have an inverse relationship. In the past year – out of the 49 weeks – the two moved in unison 15 times (Chart 1).
This month, this was the second week the large-cap index and volatility moved hand in hand, with the other having come in the week before.
VIX rallied as high as 23.08 intraday Monday, but only to reverse hard lower. Inability to rally in a week in which equities were punished hard could be telling. It is hard to argue last week’s candle was a decisive spike reversal, but it was close.
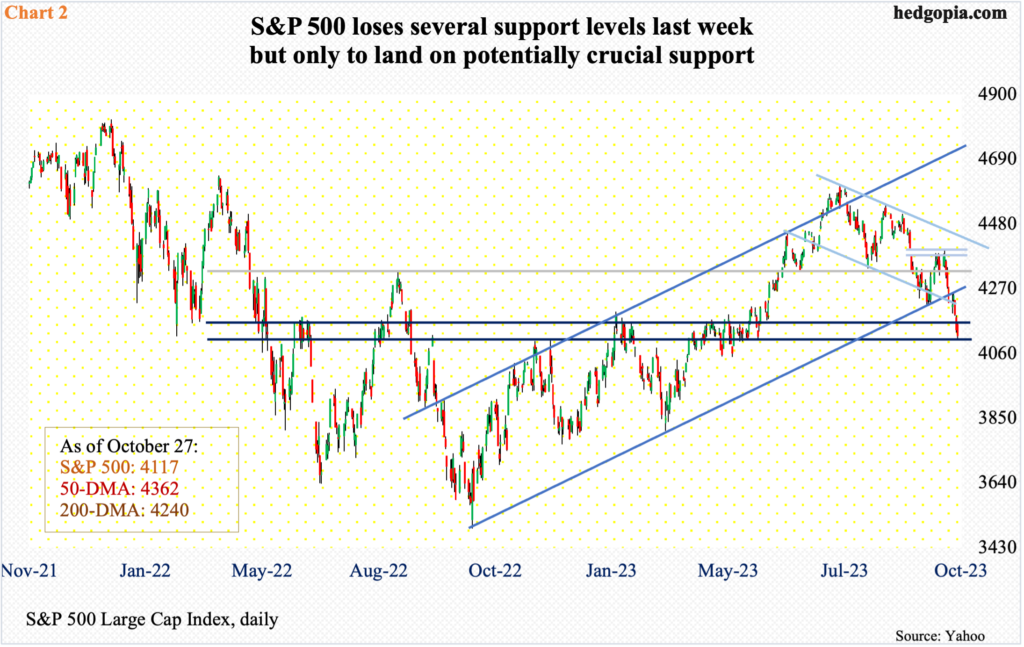
The S&P 500 suffered a back-to-back down week last week, ending on a potentially crucial spot. After tumbling 27.5 percent from its all-time high (4819) posted in January last year, it bottomed last October. The subsequent rally stopped at 4100 several times, until it decisively gave away this May. The breakout is being retested.
After the May breakout, the S&P 500 rallied to 4607 through July, before heading lower in a descending channel from that high. The channel support was breached last week, as was the lower bound of an ascending channel from last October. The 200-day moving average (4240) was compromised as well. After all this damage, it is a show-me time for the bulls.
The selling the last couple of weeks got aggressive as soon as a gap from September 21st got filled just below 4400 (Chart 2). By Friday, the daily RSI was pushed below 30 to 29.05; early this month when the metric went sub-30, the S&P 500 rallied north of four percent in the next two weeks. Longs have an opportunity here.
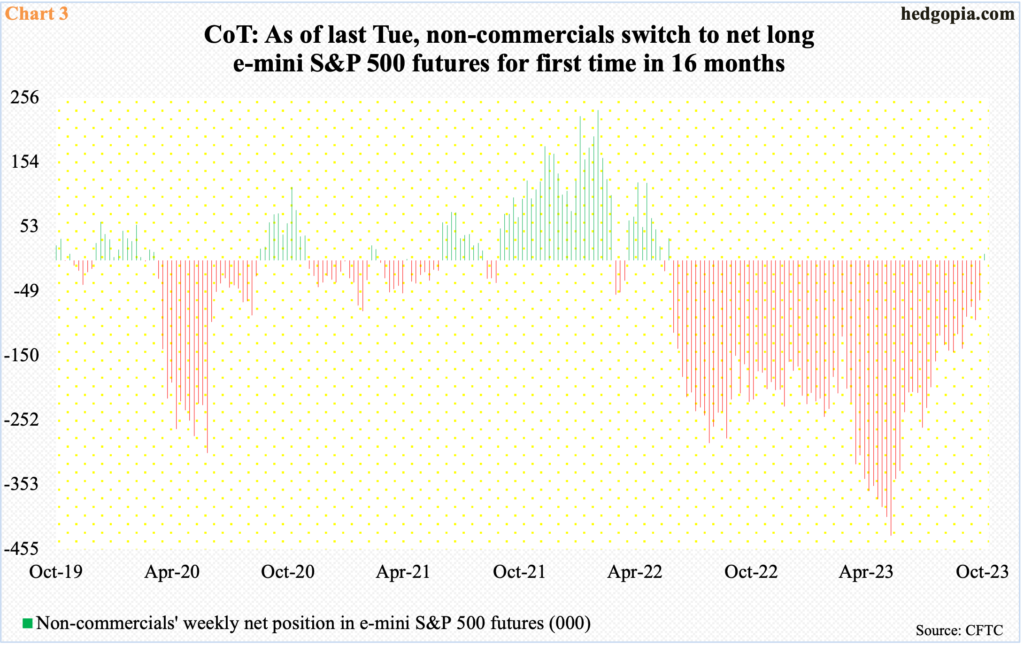
In the futures market, non-commercials just flipped to net long e-mini S&P 500 futures. This is the first time in 16 months they have done so (Chart 3).
Although it must be pointed out that in the week to May 30th, these traders had accumulated record net shorts – a total of 434,170 contracts. By then, the cash (at 4206) had already broken out of 4100 and was on the move, putting non-commercials under pressure to cover, which they gradually did. This contributed greatly to the bullish momentum.
Fast forward to last week, these traders are not always right directionally, but their action is worth a watch. The last time they were net long was in the week to June 14th last year. The S&P 500, having peaked in January, troughed at 3637 on June 17th and rallied to 4325 by August 16th. Strictly based on this, history is on bulls’ side.
Concurrently, small-cap bulls, too, have an opportunity to put their foot down.
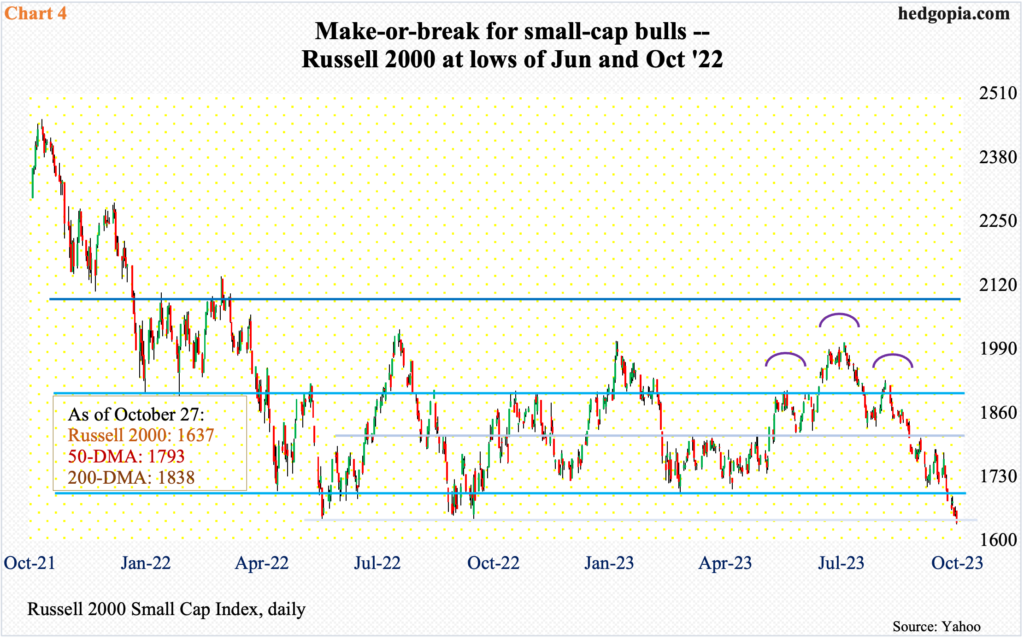
Two months after the Russell 2000 peaked in November 2021, it began trading within a 200-point range between 1700 and 1900. In June and October last year, the small cap index broke down, falling out of the range but only to find bids waiting at 1640s (Chart 4). Bulls’ mettle is being tested again.
Last week, the index closed at 1637. A convincing breach of this support is for sure to open the door to 1600, which is where a head-and-shoulders pattern, the neckline of which was broken on September 21st at 1800, will complete.
Defense of 1640s will give the bulls another shot at 1700, followed by 1800.
The Nasdaq 100 is amid a similar bull-bear tussle, with odds beginning to favor the former for now.
Last week, several tech heavy-weights such as Microsoft (MSFT), Google owner Alphabet (GOOG), Facebook owner Meta Platforms (META) and Amazon (AMZN) reported their September quarter. In aggregate, their results anything but lit the fire under tech stocks.
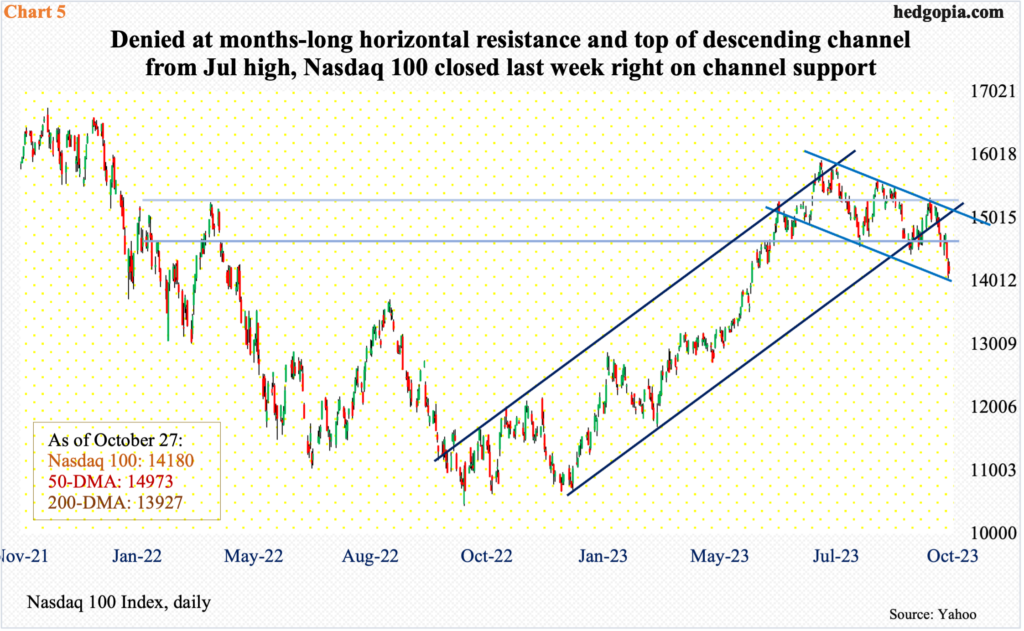
For the week, the Nasdaq 100 declined 2.6 percent to 14180. In the prior week, it gave back 2.9 percent, when sellers showed up at the upper trendline of a descending channel from July; the tech-heavy index peaked at 15932 on the 19th that month. It closed last week at the lower trendline of that channel (Chart 5).
To boot, the 200-day lies at 13927. And a 38.2-percent Fibonacci retracement of the October 2022-July 2023 rally lies at 13834 (more on this here). As things stand, odds are in bulls’ favor.
Thanks for reading!
