
From early October, the S&P 500 is down 18 percent. Important support lies at 2400, or just underneath. Several indicators are at/near panic levels. Risk-reward odds favor unwinding of these conditions sooner than later.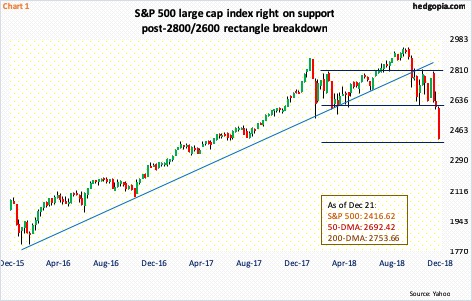
There is blood on the Street. Bulls have been gored.
From its all-time high of 2940.91 on September 21 through last Friday’s intraday low, the S&P 500 index is down 18.1 percent. The Nasdaq 100, which peaked on October 1 at 7700.56, lost 21.9 percent through last Friday’s low. The Russell 2000 small cap index peaked earlier, on August 31 at 1742.09, and is down 26 percent through last Friday’s low.
At one point, through the aforementioned September high, the S&P 500 (2416.62) was up 10 percent for the year. Now, it is down 9.6 percent. Even if Santa shows up in the remaining four and a half sessions this year, it is hard to imagine the losses getting wiped out.
Momentum increasingly is going bears’ way. Monthly indicators are still not done completely unwinding the overbought conditions they were in. This is a risk facing longs medium- to long-term. Near term, daily and weekly charts are oversold, and can start unwinding in the right circumstances. In this scenario, selling hits the pause button.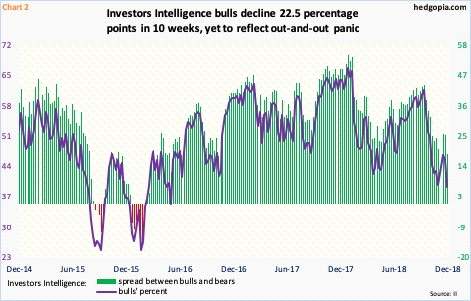
It is too soon to definitively say if the ongoing selloff has exhausted itself.
Investors Intelligence data show bulls still hanging in there. Last week, they registered 39.3 percent, which is the lowest since May 2016 and is down from 61.8 percent early October. Earlier in February 2016, when US stocks in general reached a major low, bulls’ count fell as low as 24.7 percent, with bears rising to 39.8 percent. The bull-bear spread back then was in the minus column (Chart 2). Not this time around. Bears last week were feeling smug at 21.4 percent. The spread has narrowed to 17.9 percentage points, but this is no panic territory.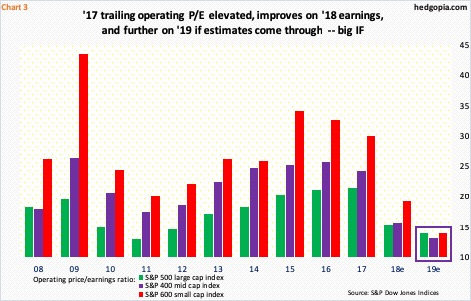
The irony is that, even after this selloff, forward multiples are in the 13-14 percent range. Chart 3 plots the operating P/E for the S&P 500 (large cap), 400 (mid cap) and 600 (small cap). The trailing P/E for 2017 was elevated. Thanks to corporate tax cuts of December last year, this year’s earnings jumped.
With one quarter to go this year, S&P 500 estimates currently are $157.17, S&P 400 $102.40 and S&P 600 $41.98. In 2017, these companies respectively earned $124.52, $78.12 and $31.19. The sell-side expects earnings momentum to continue next year. Estimates are respectively $172.76, $121.66 and $57.54. These analysts are notorious for starting out on a very optimistic note and lower estimates as the year progresses. Next year’s is already being revised downward.
S&P 500 estimates for 2019 peaked early August at $177.13, S&P 400 at $124.32 mid-October, and S&P 600 at $61.63 late June. Due to the downward revision, even though stocks have taken a hit, the P/E multiple is yet to hit mouth-watering levels. Besides, in all probability, the downward revision trend will continue.
Arguably, the selloff in stocks is beginning to reflect this very scenario.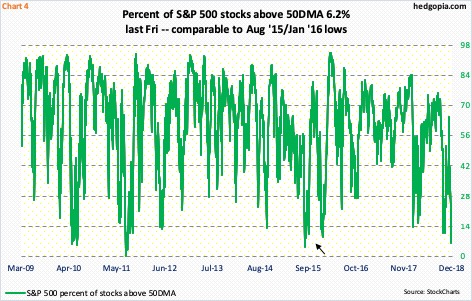
Unlike the afore-mentioned bull-bear sentiment, several other metrics are panicky.
Last Friday, merely 6.2 percent of S&P 500 stocks were above their 50-day moving average. This is comparable to lows during August 2015 and January 2016, when they respectively bottomed at 4.6 percent and nine percent (arrow in Chart 4). These are very low readings, and as can be seen in the chart, a reversal higher is a just a matter of time.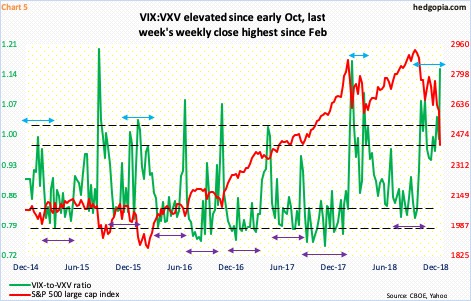
VIX does not act panicky. In February this year, it spiked to 50.11 intraday on the 6th, before reversing lower. Fast forward to October, it jumped to 28.84 intraday on the 11th. The S&P 500 kept going lower, but VIX was not able to surpass that high until Thursday and Friday last week, with the week ending at 30.11. Volatility is high, but not panicky.
That said, the ratio of VIX, which measures market’s expectation of 30-day volatility implied by S&P 500 options, to VXV, which does the same but goes out to three months, is sending a different message. It ended last week at 1.15 – the highest weekly close since February this year (Chart 5). This gets unwound sooner or later.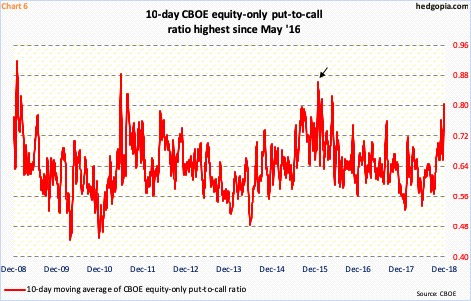
Staying with the options market, the CBOE equity-only put-to-call ratio jumped last week. Twice, readings were in the 0.90s, and Friday’s 1.13 was the highest since January 2016.
Chart 6 calculates the 10-day moving average of the ratio. On that basis, Friday ended at 0.805, which is pretty elevated and the highest since May 2016. In January that year, it rose as high as 0.863.
The 21-day moving average of the ratio ended last week at 0.741; in 2016, it rose as high as 0.764 in May and 0.771 in February (not shown here).
The bottom line: fear is beginning to show up in this metric.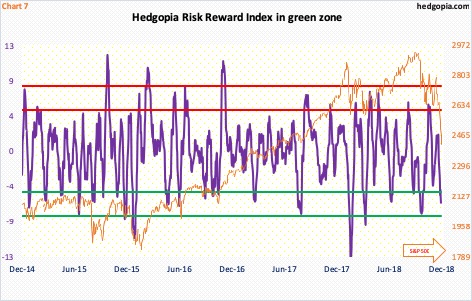
Last but not the least, our own Hedgopia Risk Reward Index just dropped into the green zone (Chart 7). This is designed to capture short-term swings. The index can always continue lower, as it has in the past, but once in the green zone, risk-reward odds are favorable.
As mentioned above, daily and weekly charts of the S&P 500 are in oversold territory. The downward momentum is yet to stabilize. But the index is at an interesting juncture. Once the selloff began early October, for nine weeks, the S&P 500 went back and forth between 2800 and 2600 (Chart 1). Last week, it fell out of the box. A measured-move target of that breakdown lies at 2400, or thereabouts. Last Friday’s intraday low was 2408.55. Concurrently, the 200-week EMA lies at 2388.47. This is 1.2 percent from Friday’s close. Should it be tagged, this will be the first kiss since Feb 2016. In the event this average is tested, bids likely show up. This creates a decent opportunity for a trade with a long bias using options.
Hypothetically, SPY (SPDR S&P 500 ETF) closed last week at $240.70. A one-percent drop from here puts the ETF at $237.90. January 25th 238 puts sell at $6.45, while 241 and 260 calls of the same expiration sell at $7.54 and $0.95, in that order. A short put combined with a bull call spread costs $0.14. The idea is to sell the put and the higher-strike call to finance the purchase of at-the-money call. If put, it is a long at $238.14.
Thanks for reading!
