
 The rally the past couple of sessions, is it an oversold bounce or is there more to it than meets the eye? Particularly on Monday, money did come out of defensives such as utilities and health care, and into offensives such as consumer discretionary and small-caps. But there is hardly any conviction behind the move – now and leading up to this. Volume is thin, so is participation. Come to think of it. It is probably normal for market participants to be tentative at this point. After all, the sell-off did not result from a change in Fed policy or severe deterioration in economic data. Markets were in deep overbought territory, hence the various geo-political issues that made the headlines in recent weeks probably provided a good excuse. Here is the thing. These issues – ranging from Ukraine to Israel/Gaza to Iraq – have not been completely resolved. Yes, the headline risk may subside in any given week, but the problem continues to fester. Now the worrywarts can also nag about the Ebola virus. The point is, there is always something to worry about. There are times markets tend to tune them out. Not so other times, particularly when technicals are extended.
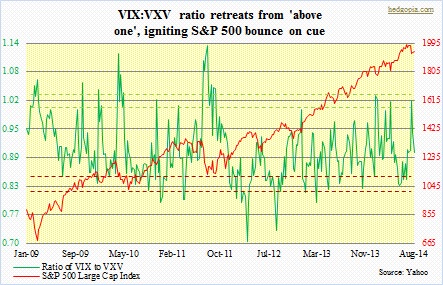 In fact, the sell-off came pretty much on cue. It had been four months since the S&P 500 Large Cap Index suffered a decent correction – down 4.4 percent early- to mid-April. That is how extended things were. Late-May, the index had broken out of 1900. Once again on cue, that ended up as a place for buyers to emerge. To boot, as the accompanying chart shows, the VIX to VXV ratio got inverted on July 28th. To the uninitiated, the VIX measures the implied volatility of S&P 500 Index options 30 days out, while the VXV does the same for options three months (93 days) out. The ratio helps us get a glimpse into if investors/traders expect volatility to rise or fall in the 30- to 93-day time horizon. Whenever the ratio goes over one, it has tended to mark a bottom in the S&P 500 Index – short-, medium- or long-term. In an environment when things are normal and market participants are embracing risk-on, near-term volatility is suppressed more than that for further-out months. This, in derivatives lingo, is known as contango. Backwardation is the opposite of that when near-term volatility is higher. When this happens, near-term concerns are elevated, which is what we had on July 28th, preceded by a quick rally/bounce that followed.
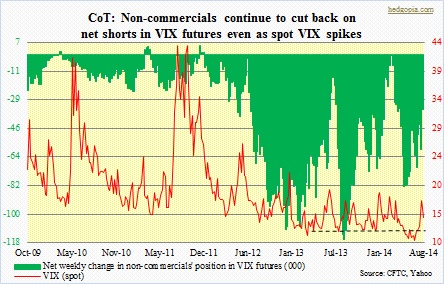
Incidentally, as the top chart shows, large speculators last week cut back on their net shorts in VIX futures – from -60k contracts to -35k. From the high two weeks ago, spot VIX is already down 19 percent. If what we witnessed last week was indeed a VIX-spike signal to go long equities, then the fear-gauge has much lower to go, and equities higher. At this point, the best we can do is watch 1950-1955 on the S&P 500, 4425 on the Nasdaq, 16700-16800 on the Dow Industrials, 22.50-22.60 on XLF (financials), 113 on IWM (small-caps), and 50 on SMH (semis).
