
Small-caps were big laggards last week. IWM, the iShares Russell 2000 ETF, lost 2.5 percent, versus drops of 1.3 percent for the S&P 500 Index, 1.8 percent for the Dow Industrials and 1.7 percent for the Nasdaq Composite, among others.
Truth be told. Small-caps have been struggling for a while now (Chart 1). IWM broke the mid-October 2014 trend line in late April, suffered a false breakout two months later and is now trading below the 200-day moving average.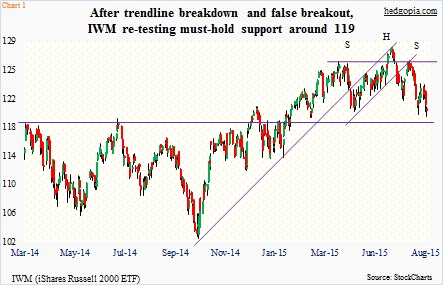
In the process, it has charted out a head-and-shoulders pattern for itself, with the neckline just underneath. It is a make-or-break support.
Non-commercials are beginning to bet the weakness continues. In the past couple of weeks, they have gotten aggressive with their bearish bias in the Russell 2000, with net shorts rising from just under 4,500 contracts to a tad over 28,000 – the highest in nine weeks (Chart 2).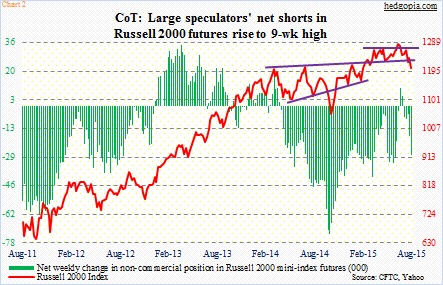
This currently is the yin of the small-cap equation.
Here is the yang. The ETF is literally sitting on support, and it is not any Tom, Dick, or Harry support. Besides going all the way back to March of 2014, this, as stated earlier, also forms the neckline of the head-and-shoulders formation (Chart 1). Since it peaked seven weeks ago, the ETF has lost nearly seven percent. Once that neckline gives away, we could be potentially looking at another seven percent drop.
For this scenario to pan out, RVX, the Russell 2000 Volatility Index, probably needs to break out. Since February in particular, it has not been able to sustain above the 18-19 range (Chart 3). As a matter of fact, it is range-bound. Buyers swoop in as soon as RVX (18.15) dips to between 14 and 15, and sell when it hits the upper end of the range. The spike last Thursday now puts RVX past the mid-October 2014 declining trend line – a positive for volatility bulls – but faces resistance at not only 18-19 but also the 200-day moving average (18.45). Inability to push higher should act as a tailwind for small-caps.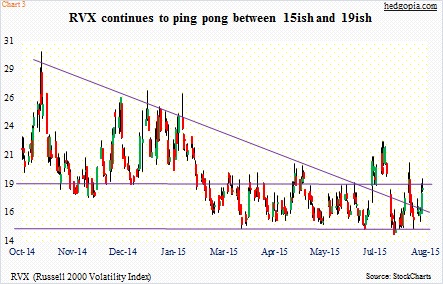
If we focus on Chart 4, bulls – not only small-caps but stocks in general – have reason to be hopeful, at least in the near-term. The red and green lines – particularly the former – are at levels that several times in the past have market a bottom in stocks. It is worth noting that the ISE only uses opening long transactions and excludes market maker and firm trades – hence possibly a better gauge of market sentiment.
On Friday, the ISE reading of 130.9 was the lowest since 129.2 in early February this year. This is a call-to-put ratio, hence inverted in the chart. Similarly, on July 27 the CBOE put-to-call ratio rose to .708 – the highest reading since November 23, 2012. That was the day the S&P 500 Index tagged its 200-day moving average before bouncing. Friday, the reading was .685.
These readings can always push higher – and they have in the past – but the higher they go the higher the odds of a bounce/rally in stocks.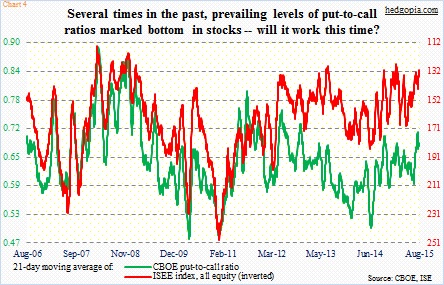
With that said, the fact remains that small-caps currently are not sending good vibes. Money is leaving U.S. stock funds in general. In the week ended August 5, $5.3 billion left – third straight week of outflows (courtesy of Lipper). If stocks do rally this week or next, overhead resistance is plenty. It is hard to imagine IWM making new highs anytime soon.
Mix it all up, and it is probably safer to stay out of IWM ($119.88) for now, as it could go either way near-term. To refresh, on July 29, August 7th 120.50 puts were hypothetically sold for $0.93. These puts are in the money and will be exercised. So it is an effective long at $119.57 – worth selling for a profit of $0.31 and wait for better opportunities.
Thanks for reading!
