
Last week’s mini sell-off in U.S. equities did not materialize all of a sudden. This was building for a while.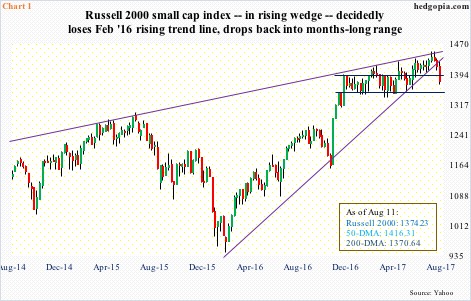
The Russell 2000 small-cap index in particular peaked as early as July 25.
Investors/traders in general gravitate toward small-caps when they are in risk-on mode. In fact, a month after last year’s post-election rally, the Russell 2000 began to go sideways – until it broke out early June. Turns out, it – once again – was false.
The Russell 2000 has been caught within a rising wedge for a while. Throughout this year, rallies persistently got sold near the upper bound, including after the June breakout (Chart 1).
The sell-off accelerated last week after it lost the 50-day moving average. This was preceded by the loss a week earlier of a rising trend line from February last year.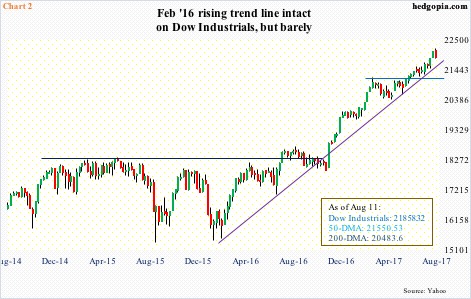
Incidentally, transports peaked well ahead of the peak in the Russell 2000.
The Dow Jones Transportation Average peaked on July 14, before losing the 50-day. Last week, it tested the 200-day, and held. Ditto with the Russell 2000.
The weakness in transports diverges from persistently strong price action in the Dow Industrials. The latter is yet to test the 50-day, let alone the 200. Being an index of 30 large U.S. companies, it has significant exposure overseas. Currency plays a role.
From its peak early this year to the low a week ago, the US dollar index shed 11 percent, which can provide a tailwind to the top line of global companies. At least that is the perception.
Unlike the Russell 2000, which is predominantly domestically focused, the Industrials are yet to lose the February 2016 trend line (Chart 2).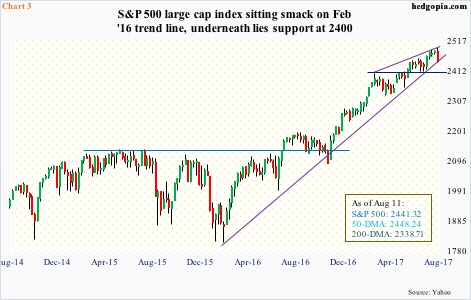
February last year was a major bottom for U.S. equities. From that low through recent highs, both the Russell 2000 and the Nasdaq 100 rallied 54 percent, the S&P 500 large cap index 38 percent, and the Industrials 44 percent. Thus the importance of trend line drawn from those lows.
Last Friday, the S&P 500 closed right on it (Chart 3). On its way here, the index lost the 50-day. A loss of the trend line could open doors for a test of 2400, which it broke out of late May this year.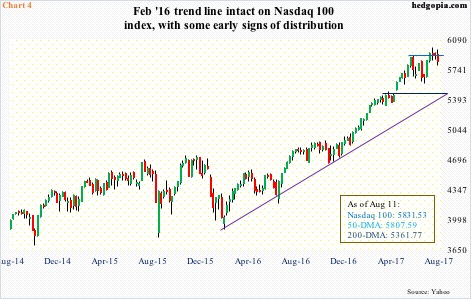
On the Nasdaq 100, the dynamics are a little different. The trend line will not be tested until 5450, which is where four-month horizontal support lies (Chart 4). This is nearly seven percent away.
Last Thursday, it lost the 50-day, but was recaptured in the very next session.
That said, on July 27 the Nasdaq 100 posted a new high of 5995.77 before reversing hard in a bearish engulfing session. On August 8, that high was never surpassed. In contrast, the S&P 500 on August 8 went on to surpass its prior high of July 27.
Tech has been such an out-and-out leader this year. Under the surface, signs of fatigue are showing up on the Nasdaq 100.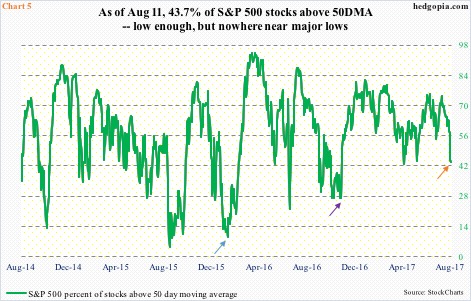
Near term, these indices are getting oversold. This is particularly evident in the Russell 2000. Hence the need to hold the 200-day. The index has dropped back into the afore-mentioned rectangle between 1340s and 1390s. Nearest resistance is the top of that range.
Odds of a relief rally near term have also grown on the S&P 500. If the bulls are unable to save the February 2016 trend line, 2400 is where bids are likely to show up. By that time, Chart 5 would look different for sure.
As of last Friday, 43.7 percent of S&P 500 companies were above their respective 50-day, down from 74.2 percent on July 19.
For reference, prior to the February low last year in the S&P 500, this dropped to as low as nine percent in January (blue arrow in Chart 5), and that is what laid the foundation for that massive rally. In other words, with the current reading (orange arrow), a reliable bottom cannot be had. Even pre-election last year, this dropped to 27 percent (indigo arrow).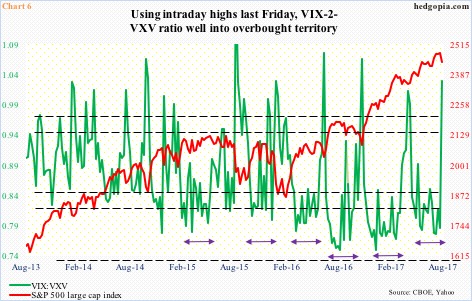
In the event of an S&P 500 test of 2400, the VIX-to-VXV ratio likely appreciates further. It closed out last week at .95 – into overbought territory – but intraday Friday it shot up to 1.03, which is what is used in Chart 6. This is beyond overbought.
Also Friday, after rallying 44.4 percent on Thursday, spot VIX (15.51) had a wild session, with a high of 17.28 and a low of 14.50, ending the session down 3.3 percent. Odds favor it proceeds to unwind its daily overbought condition.
With that said, VIX still has room to rally on a weekly and monthly basis. How it behaves near support – the 200-day at 12 – will be a big tell. Correspondingly, on the S&P 500, the bulls need to first take out 2450, and 2465 after that. How the bears react around these levels, or even near the all-time high, will be an equally strong telltale sign.
Thanks for reading! Please share.
