
Small-caps have sprung back to life in recent sessions.
Since peaking at 1514.94 on October 5 through the intraday low of 1454.17 last Wednesday, the Russell 2000 small cap index (1503.40) shed four percent. It was a slow drip-drip move lower. But since that low four sessions ago, it has rallied 3.4 percent.
What could be driving this – shorts leaving, new funds moving into small cap-focused mutual funds and ETF’s, or futures driving the action in the cash? Or something else?
If anything, it is probably not fundamentally driven.
Small-caps, which are inherently domestically focused, are perceived to benefit more from the proposed tax cuts. This is a bit simplistic, but that is the prevailing sentiment.
As things stand, to assume that the tax plan will reach the President’s desk in its current form will be assuming a lot.
Senator Ron Johnson (R, WI) recently said he would not vote for the Senate’s tax bill as currently written. Susan Collins (R, ME) does not expect either the Senate or the House bill to be passed as drafted. It is anyone’s guess if Bob Corker (R, TN), John McCain (R, AZ) or Jeff Flake (R, AZ) will vote yes. The latter three have had testy relationship with the President. The Republicans only have a two-vote advantage in the Senate.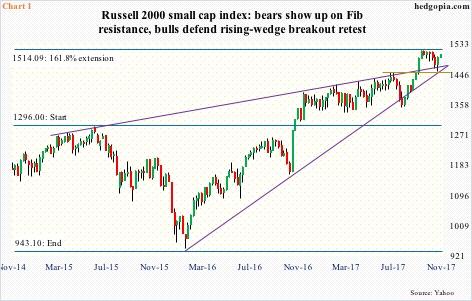
Using this logic, the most recent rally in small-caps is purely technical.
Recall that when the Russell 2000 peaked early October, it reversed right at important Fibonacci resistance. A 161.8-percent extension of the decline between June 2015 and February 2016 puts the index at 1514.09 (Chart 1). As stated earlier, it peaked at 1514.94. This was a victory for the bears, although they had only won the battle, not the war. The bulls, too, stepped up where they needed to.
A couple of months ago, the Russell 2000 broke out of a rising wedge. In the most recent sell-off, that breakout was defended. As was a rising trend line from February 2016. The bulls also defended horizontal resistance from four months ago.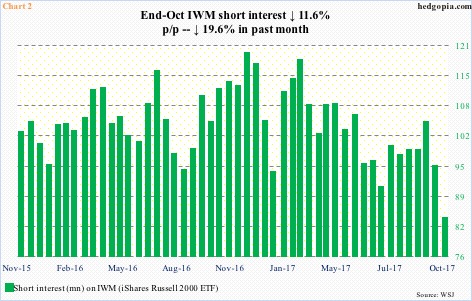
As this was all taking place, help likely came from the shorts.
On IWM (iShares Russell 2000 ETF), short interest at the end of October stood at 83.9 million shares, down 11.6 percent week-over-week (Chart 2). As of Monday, the ETF had 285.9 million shares outstanding. Short interest has trended lower the past several months, but there is still plenty of room for short squeeze.
That said, when mid-November numbers get reported next Monday, it likely would not tell us a whole lot. The reversal on Russell 2000 did begin on the 15th, but the sharp rally came in the subsequent three sessions. If a squeeze did take place, this gets reflected in the November 16-30 period.
Right at this minute, ETF flows are not cooperating with the shorts.
On Wednesday through Friday last week, IWM pulled in $1.2 billion, reversing outflows of $1.9 billion in the prior seven sessions (courtesy of ETF.com). Similarly, IJR (iShares core S&P small cap ETF) attracted $23 million and $132 million during the period, respectively.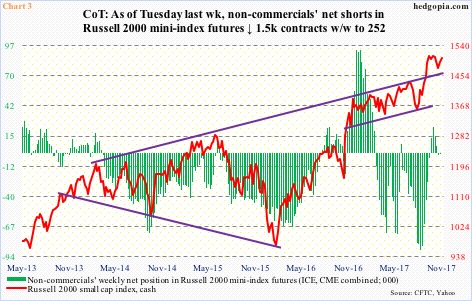
The Russell 2000 has reclaimed the 50-day moving average. Ditto with the 10- and 20-day. The daily MACD is no the verge of crossing over. A test of the recent highs is looking feasible. This also approximates the daily upper Bollinger band.
More important, even if a breakout occurs, would that be enough to coax non-commercials into aggressively going net long Russell 2000 mini-index futures? Small-cap bulls would need their help if the rally were to sustain itself.
As of last Tuesday, these traders were essentially flat – net short 252 contracts. After being net long for four weeks, they have been net short the past couple – albeit only slightly.
Their holdings as of today – scheduled to be out next Monday – will be a big tell in this regard as to which way the winds might blow in the weeks to come.
Thanks for reading!
