
Of late, there is a spring in small-caps’ step. Can it be sustained?
In August, the Russell 2000 small cap index (1239.91) jumped 1.6 percent, even as the S&P 500 large cap index inched down 0.1 percent and the Dow Industrials fell 0.2 percent. The Nasdaq 100 index rose 0.9 percent. (Both the S&P 500 and Dow Industrials had a monthly doji in August.)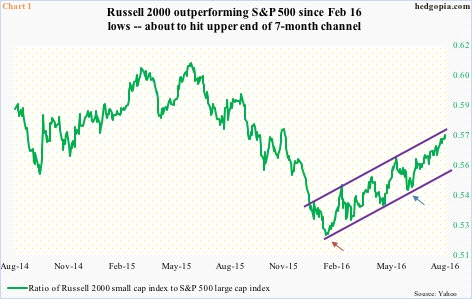
Small-caps are catching up. In fact, the ratio of Russell 2000 to S&P 500 bottomed in early February this year when major U.S. indices troughed. Since then (burgundy arrow in Chart 1), the ratio has been in an uptrend, with the latest bounce coming off post-Brexit low (blue arrow). The ratio currently is spitting distance away from hitting the top end. Odds favor it turns back from here.
This is taking place even as the Russell 2000 rallied 33 percent from February lows through last week’s high, and 15-plus percent from post-Brexit lows in late June. Daily and weekly conditions are grossly overbought.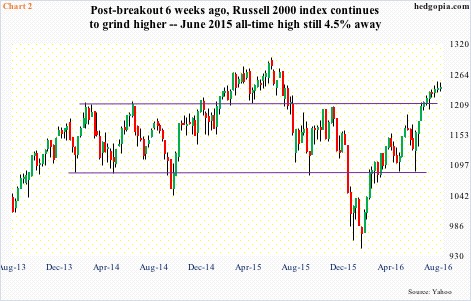
That said, after several failed attempts, the Russell 2000 did manage to break out of crucial resistance going back to March 2014 (Chart 2). Since the breakout six weeks ago, it has continued to grind higher.
The big question is, is it rallying because it senses good times ahead for the economy or because of short-covering, or because oversold technicals were unwinding? (Small-caps tend to have sole/major exposure to the domestic economy.)
Back in February, technicals were way oversold – not only daily and weekly but also monthly. That needed to get unwound. Short interest lent a helping hand as well.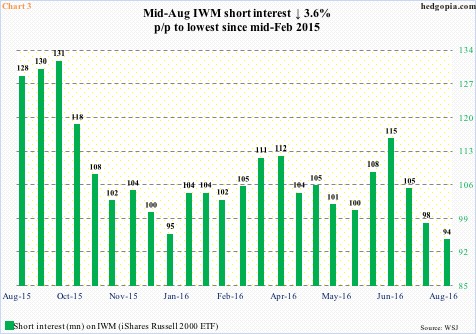
As of the end of June this year, short interest on IWM, the iShares Russell 2000 ETF, stood at 115.1 million. Three periods later – as of the middle of August – it dropped to 94.1 million (Chart 3), which was the lowest since the middle of February last year. Since late June, the Russell 2000 has rallied north of 15 percent.
Separately, since the week ended February 9th this year through Tuesday last week, open interest in Russell 2000 mini index futures has dropped 24 percent to 334,673. In the corresponding period, open interest in e-mini S&P 500 futures and Nasdaq 100 index (mini) futures was flat to nominally high. At the risk of oversimplification, in general, if the price is increasing but open interest is not, this suggests short-covering.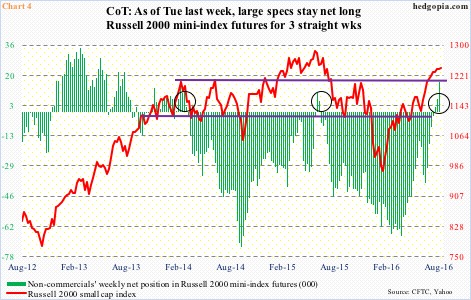
Also helping the Russell 2000 rally in the cash market is short squeeze non-commercials suffered in the futures market. As of April 12th this year, these traders’ net shorts in Russell 2000 mini-index futures were 66,871 contracts, before coming under pressure.
As is seen in Chart 4, contraction in the green bars has accompanied a rally in the red line. In the past three weeks, these traders have switched to net long. This is similar to what transpired in e-mini S&P 500 futures and Nasdaq 100 index (mini) futures, the only difference is that the switch took place much later in Russell 2000 mini-index futures, raising the risk that these traders may be running out of ammo.
Is this the reason why the RVX/VIX premium has not gone away?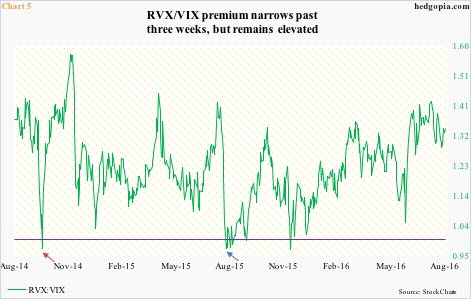
In general, RVX, the Russell 2000 volatility index, tends to trade at a premium to VIX, the S&P 500 volatility index. There are times this premium turns to discount, and that in general tends to be a good time to go long stocks – highlighted by burgundy (October 2014 lows) and blue (August 2015 lows) arrows in Chart 5.
The RVX/VIX premium has narrowed since early August, but remains elevated – near the highs for 2016. Traders still perceive small-cap stocks as risky, and are seeking protection.
Odds favor the small-cap momentum stumbles sooner than later.
Thanks for reading!
